Method for Surface Reflectance Estimation with
MODIS by Means of Bi-Section between MODIS and
Estimated Radiance as well as Atmospheric
Correction with Skyradiometer
Kohei Arai 1
1Graduate School of Science and Engineering Saga University
Saga City, Japan
Kenta Azuma 2
2 Cannon Electronics Inc. Tokyo, Japan
Abstract—Method for surface reflectance estimation with MODIS by means of bi-section algorithm between MODIS and estimated radiance is proposed together with atmospheric correction with sky-radiometer data. Surface reflectance is one of MODIS products and is need to be improved its estimation accuracy. In particular the location near the skyradiometer or aeronet sites of which solar direct, aureole and diffuse radiance are measured, it is possible to improve the estimation accuracy of surface reflectance. The experiment is conducted at the skyradiometer site which is situated at Saga University. There is Ariake Sea near the Saga University. It is rather difficult to estimate surface reflectance of the sea surface because the reflectance is too low in comparison to that of land surface. In order to improve surface reflectance estimation accuracy, atmospheric correction is mandated. Atmospheric correction method is also proposed by using skyradiometer data. Through the experiment, it is found that these surface reflectance estimation and atmospheric correction methods are validated.
Keywords—Sea surface reflectance; Atmospheric correction; Sky-radiometer; MODIS; satellite remote sensing
I. INTRODUCTION
Sea surface reflectance, water leaving radiance are fundamental characteristics and are importance parameters for the estimations of chlorophyll-a concentration, suspended solid, etc. Therefore, there is a strong demand to improve sea surface reflectance estimation accuracy. In order to improve surface reflectance, it is required to improve atmospheric correction accuracy. In the visible to near infrared wavelength region, the absorption components due to water vapor, ozone, aerosols, and the scattering due to atmospheric molecules, aerosols are major components. In particular, aerosol absorption and scattering (Mie scattering) is not so easy to estimate rather than scattering component due to atmospheric molecules (Rayleigh scattering). After the estimation of these components, radiative transfer equation has to be solved for the atmospheric correction. This is the process flow of the atmospheric correction [1]-[6]. Also, atmospheric component
measurement, estimation, retrievals are attempted together with sensitivity analysis [7]-[17]. It is still difficult to estimate the aerosol characteristic estimation which results in difficulty on surface reflectance estimations.
The method proposed here is based on ground based Skyradiometer1 which allows aerosol refractive index and size distribution through measurements of spectral optical depth through direct and aureole as well as diffuse solar irradiance. These are measured aerosol refractive index and size distribution, not estimated refractive index and size distribution. Therefore, it is expected that atmospheric correction can be done much precisely rather than estimation without sky radiometer data.
One of the examples are shown here for sea surface reflectance estimation with MODIS2 data of Ariake Sea in Japan. Method for surface reflectance estimation with MODIS by means of bi-section algorithm between MODIS and estimated radiance is proposed together with atmospheric correction with sky-radiometer data. Surface reflectance is one of MODIS products and is need to be improved its estimation accuracy. In particular the location near the skyradiometer or aeronet sites of which solar direct, aureole and diffuse radiance are measured, it is possible to improve the estimation accuracy of surface reflectance. The experiment is conducted at the skyradiometer site which is situated at Saga University. There is Ariake Sea near the Saga University. It is rather difficult to estimate surface reflectance of the sea surface because the reflectance is too low in comparison to that of land surface. In order to improve surface reflectance estimation accuracy, atmospheric correction is mandated. Atmospheric correction method is also proposed by using skyradiometer data.
In the next section, the method and procedure of the experimental study is described followed by experimental data and estimated results. Then conclusion is described with some discussions.
1 http://skyrad.sci.u-toyama.ac.jp/
II. PROPOSED METHOD A. The Proposed Method
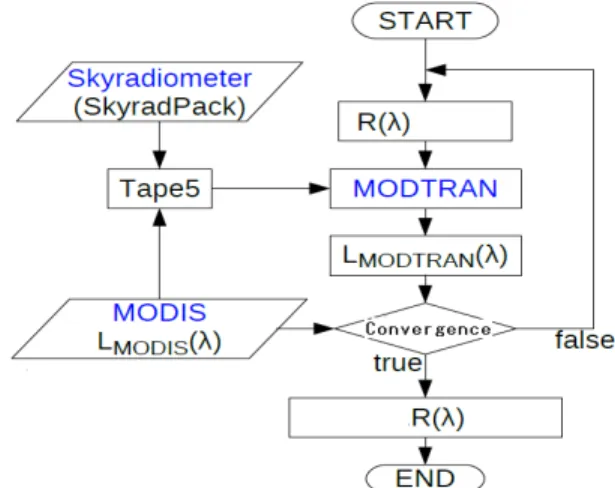
Atmospheric correction is important for estimation of surface reflectance (Remote Sensing Reflectance 3 ) in particular for estimation of sea surface reflectance estimation. The proposed atmospheric correction method is based on Skyradiometer data derived aerosol size distribution and refractive index. The aerosol refractive index and size distribution can be estimated by using SkyradPack4 with direct and diffuse solar irradiance those are measured with skyradiometer. Scattering phase function, extinction as well as scattering and absorption coefficients and asymmetry index are then estimated by using mie2new software code with the estimated refractive index and size distribution. Meantime, geometric relation among the satellite sensor of MODIS onboard AQUA satellite is estimated with MODIS Level 1B product. These estimated values are set to the input parameters (Tape 5) of MODTRAN5of atmospheric radiative transfer code. Other input parameters are set at the default values. In the process of estimation of the Top of the Atmosphere: TOA Radiance, MODTRAN is used.
The well-known bi-section method is used for estimation surface reflectance because TOA radiance is getting large in accordance with sea surface reflectance. First, initial value of the sea surface reflectance is assumed. By using the initial sea surface reflectance together with the aforementioned input parameters, all the required input parameters are set for MODTRAN. Then TOA radiance can be estimated based on MODTRAN. The estimated TOA radiance is compared to MODIS Level 1B product derived at sensor radiance. The sea surface reflectance can be estimated by minimizing the difference between TOA radiance and the at sensor radiance by changing the sea surface reflectance. The proposed process flow is shown in Figure 1.
Fig. 1. Process flow of the proposed surface reflectance estimation method
3
https://books.google.co.jp/books?id=Sy_4jIcRmvUC&pg=PA36&dq=remote +sensing+reflectance+SeaDAS&hl=ja&sa=X&ved=0CBwQ6AEwAGoVCh MIip6IntLyxwIVoiimCh1LTAC0#v=onepage&q=remote%20sensing%20refl ectance%20SeaDAS&f=false
4 SkyradPack is available from the University of Tokyo, Nakajima, et al.,
1996
5 http://modtran5.com/
R denotes the remote sensing reflectance while LMODTRAN denotes MODTRAN derived radiance. LMODIS of SeaDAS6 defined standard product of sea surface reflectance derived from MODIS data is used
The bi-section process is converged within 10 times of iterations because there is only one unknown parameter. The accuracy of this iterative process is around 0.0009765.
B. The Intensive Study Areas
Figure 2 shows the intensive study areas in the Ariake Sea area, Kyushu, Japan.
Fig. 2. Intensive study areas
III. EXPERIMENT A. The Data Used
Terra/MODIS Level 1B of Band 8 to 16 product of Ariake Sea (Latitude: 32.82-33.25 N, Longitude: 130.05-130.65 E), Japan which is acquired at 02:20 (GMT) on May 1 2003 is used. The number of pixel data of Ariake Sea is 638 pixels (Ground resolution of MODIS is 1 km). MODIS Level 1B imagery data is shown in Figure 3.
MODIS on Terra L1B, 2003/5/1 02:20 Latitude 32.82 - 33.25 degree, Lon 130.05 - 130.65 degree
(a)Portion of MODIS image
(b)MODIS image of the intensive study area of Ariake Sea
Fig. 3. MODIS image of the intensive study area of Ariake Sea acquired on May 1 2003
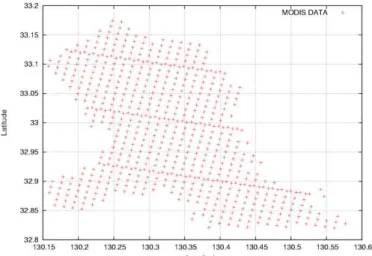
The locations of MODIS pixels of the intensive study area of Ariake Sea are shown in Figure 4.
Fig. 4. Location of the MODIS pixels of the intensive study area
B. The Experimental Results
MODIS band number, center wavelength, Root Mean Square Difference: RMSD between MODIS standard product of surface reflectance and SeaDAS defined standard remote sensing reflectance, the estimated remote sensing reflectance by the proposed method with the default input parameters of the used MODTRAN (Mid-Latitude Summer), and the estimated remote sensing reflectance by the proposed method with the input parameters including phase function of aerosols are shown in Table 1.
TABLE I. ROOT MEAN SQUARE DIFFERENCE:RMSD COMPARISONS
Band Center Wavelength(nm)
RMSD(1/str)
SeaDAS Default Proposed 8 412 0.00283 0.00257 0.00156 9 443 0.00361 0.0019 0.00144 10 488 0.00552 0.00341 0.0022 11 531 0.00692 0.00444 0.00336 12 551 0.00677 0.00396 0.003 13 667 0.00221 0.0016 0.00149 14 678 0.00216 0.00154 0.00146
15 748 0.000495 0.000651 0.000739
16 869 0.000248 0.00082 0.000831
C. Sensitivity Analysis
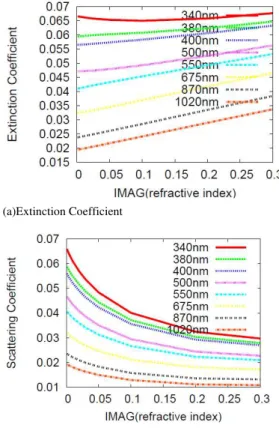
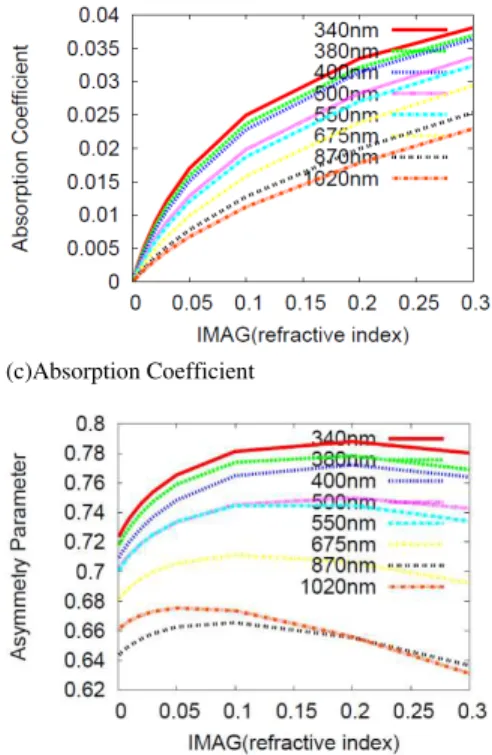
The relations between aerosol refractive index (Real and Imaginary parts) and extinction coefficient, scattering coefficient, absorption coefficient, and asymmetry parameter are investigated at the wavelengths, 340, 380, 400, 500, 550, 675, 870, and 1020nm (relatively transparent wavelength). Figure 5 shows the relations for the real part of the refractive index of aerosol and extinction, scattering, absorption coefficients and asymmetry parameter while Figure 6 shows those for the imaginary part of the refractive index and extinction, scattering, absorption coefficients and asymmetry parameter.
Extinction coefficient consists scattering and absorption coefficients of aerosol particles. On the other hand, asymmetry parameter is an asymmetric characteristic of aerosol scattering phase function. Rayleigh scattering phase function is symmetry while Mie scattering phase function is asymmetry (Forward scattering is dominant). Optical property of aerosol particles can be expressed with these coefficients and asymmetry parameter. Influencing components of aerosol particles to the optical property are refractive index and size distribution. Refractive index consists of real and imaginary parts, complex function. Real part represents refractive component of aerosol particles while imaginary part expresses absorptive component. There are some approximated size distribution functions of aerosol particles. Log-Normal distribution, Power Law distribution as well as Junge distribution functions are representatives. Therefore, the relations among these parameters are examined in these figures,
(a)Extinction Coefficient
b)Scattering Coefficient
(c)Absorption Coefficient
(d)Asymmetry Parameter
Fig. 5. Relations between real part of refractive index and extinction, scattering, absorption coefficients and asymmetry parameter
(a)Extinction Coefficient
(c)Absorption Coefficient
(d)Asymmetry Parameter
Fig. 6. Relations between imaginary part of the refractive index and Extinction, Scattering, Absorption coefficients, and asymmetry parameter
Figure 7 (a) shows a typical size distribution function of volume spectrum while Figure 7 (b) shows a typical size distribution of number spectrum (logarithmic function of aerosol particle number). In the figures, dark blue size distributions are measured at Saga University on October 15 2008. Red colored linear function shows Junge distribution with Junge parameter in the equations (1) and (2). As shown in these figures, in usual, size distribution can be expressed with bi-modal function of Log-Normal function and is based on Power Law expression.
(a)Volume spectra (b)Number spectrum
Fig. 7. Typical aerosol size distributions
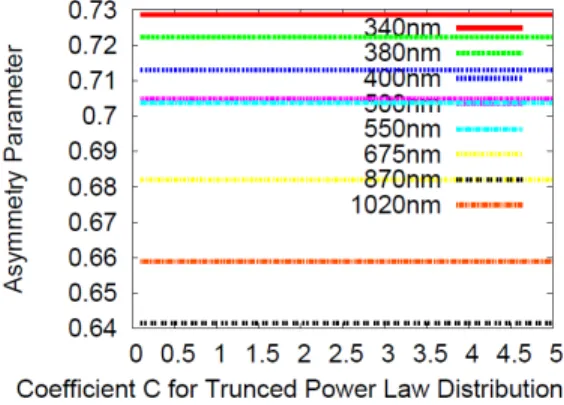
On the other hand, Figure 8 and 9 shows the relations between Junge parameter and extinction, scattering, absorption coefficients and asymmetry parameter as well as
the coefficient “C” of the truncated Power Law Distribution
function of aerosol size distribution (equations (1) and (2)) and extinction, scattering, absorption coefficients and asymmetry parameter, respectively. There are two appropriate aerosol distribution functions,
Power Law and Log-Normal Distributions. Meanwhile, there are four major atmospheric components, extinction, scattering, absorption coefficients and asymmetry parameter. Power Law Distribution function is as follows,
n(r) = C10+1 (r ≤ 0.1 m) (1)
n(r) = Cr-( +1) (r > 0.1 m) (2) where n, r, C denotes the number of aerosol particles, radius of aerosol particles, and coefficient.
(a)Extinction Coefficient
(b)Scattering Coefficient
(d)Asymmetry Parameter
Fig. 8. Relation between Junge parameter for the truncated Power Law Distribution and extinction, scattering, absorption coefficients and asymmetry parameter
(a)Extinction Coefficient
(b)Scattering Coefficient
(c)Absorption Coefficient
(d)Asymmetry Parameter
Fig. 9. Relation between the coefficient C for truncated Power Law Distribution and extinction, scattering, absorption coefficients and asymmetry parameter
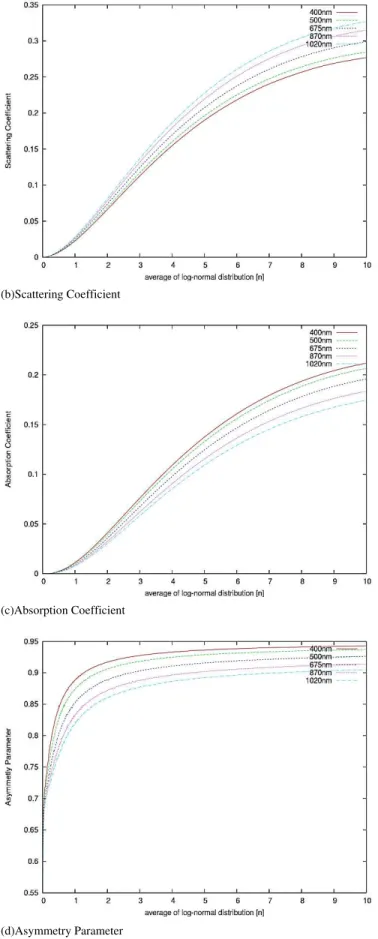
If the Log-Normal Distribution is assumed for aerosol size distribution, then the results from the sensitivity analysis are shown in Figure 10. Log-Normal Distribution function is as follows,
log σg =(Σni(logDi-logDg)2/(N-1))-1/2 (3) Where,
σg = geometric standard deviation (GSD)
Di= midpoint particle diameter of the ith bin
ni = number of particles in group i having a midpoint size Di N = σni, the total
The parameter for the Log-Normal Distribution is as follows,
n=1.0 [cm-3]
σg=0.4[micrometer]
There is a parameter for the Log-Normal Distribution, averaged distribution of n. The sensitivity of extinction, scattering, and absorption coefficients as well as asymmetry parameter are varied by the averaged distribution as shown in Figure 10. It is necessary to care about these sensitivity as well as selection of aerosol size distribution function for the convergence process in the proposed process flow which is shown in Figure 1.
(b)Scattering Coefficient
(c)Absorption Coefficient
(d)Asymmetry Parameter
Fig. 10.Results from the sensitivity analysis assuming Log-Normal Distribution for aerosol size distribution
IV. CONCLUSION
Through experiments with the standard surface reflectance product of MODIS and the estimated remote sensing reflectance based on SeaDAS processing software, and the proposed bi-section based convergence process of estimation method with skyradiometer data derived aerosol refractive index and size distribution, it is found that the proposed method with skyradiometer data is superior to the SeaDAS derived remote sensing reflectance.
Further investigations are required for selection of appropriate aerosol size distribution function. The experiment is conducted with the assumed Junge ditribution with the parametrization of Junge parameter. It, however would better to take the other aerosol size distribution functions, Log-Normal, and Power Law distributions from the results of the sensitivity analysis.
REFERENCES
[1] Ramachandran, Justice, Abrams(Edt.),Kohei Arai et al., Land Remote Sensing and Global Environmental Changes, Part-II, Sec.5: ASTER VNIR and SWIR Radiometric Calibration and Atmospheric Correction, 83-116, Springer 2010.
[2] Kohei Arai, Atmospheric correction and vicarious calibration of ADEOS/AVNIR and OCTS, Advances in Space Research, Vol.25, No.5, pp.1051-1054, 2000.
[3] Kohei Arai, Atmospheric correction and residual error in vicarious calibration of AVNIR and OCTS both onboard ADEOS, Advances in Space Research, Vol.25, No.5, pp.1055-1058, 2000.
[4] K.Arai, Atmospheric correction and vicarious calibration of ADEOS/AVNIR and OCTS, Advances in Space Research, Vol.25, No.5, pp.1051-1054, (2000).
[5] K.Arai, Atmospheric correction and residual errors in cross calibrationof AVNIR and OCTS both onboard ADEOS, Advances in Space Research, Vol.25, No.5, pp.1055-1058, (2000).
[6] Chrysoulakis,Abrams, Feidas and Kohei Arai, Comparison of Atmospheric correction methods using ASTER data for the area of Crete, Greece, International Journal of Remote Sensing, 31,24,6347-6385,2010.
[7] K.Arai, Monte Carlo simulation of polarized atmospheric irradiance for determination of refractive index of aerosols, International Journal of Research and Review on Computer Science, 3, 4, 1744-1748, 2012. [8] O.Uchino, T.Sakai, T.Nagai, I.Morino, K.Arai, H.Okumura, S.Takubo,
T.Kawasaki, Y.mano, T.Matsunaga, T.Yokota, On recent stratspheric aerosols observed by Lidar over Japan, Journal of Atmospheric Chemistry and Physics, 12, 11975-11984, 2012(doi:10.5194/acp-12, 11975-2012).
[9] K.Arai, Monte Carlo ray tracing based sensitivity analysis of the atmospheric and oceanic parameters on the top of the atmosphere radiance, International Journal of Advanced Computer Science and Applications, 3, 12, 7-13, 2012.
[10] K.Arai Error analysis on estimation method for air temperature, atmospheric pressure, and relative humidity using absorption due to CO2, O2, and H2O which situated at around near infrared wavelength regions, International Journal of Advanced Computer Science and Applications, 3, 12, 192-196, 2012.
[11] Kohei Arai, Method for estimation of aerosol parameters based on ground based atmospheric polarization irradiance measurements, International Journal of Advanced Computer Science and Applications, 4, 2, 226-233, 2013
[12] Kohei Arai, Sensitivity analysis and validation of refractive index estimation method with ground based atmospheric polarized radiance measurement data, International Journal of Advanced Computer Science and Applications, 4, 3, 1-6, 2013.
lower tropospheric ozone over Saga (33.24N, 130.29E) in Japan and comparison with a chemical climate model, Journal of Atmospheric Measurement Techniques, 7, 171-194, 2014.
[14] Kohei Arai, Comparative study among least square method, steepest descent method, and conjugate gradient method for atmospheric sounder data analysis, International Journal of Advanced Research in Artificial Intelligence, 2, 9, 30-37, 2013.
[15] Kohei Arai, Sensitivity analysis for aerosol refractive index and size distribution estimation methods based on polarized atmospheric irradiance measurements, International Journal of Advanced Research in Artificial Intelligence, 3, 1, 16-23, 2014.
[16] Kohei Arai, Aerosol refractive index retrievals with atmospheric polarization measuring data, Proceedings of the SPIE, 7461-06, 1-9, 2009.
[17] Kohei Arai, Reflectance based vicarious calibration of ASTER/VNIR with aerosol refractive index and size distribution estimation using measured atmospheric polarization irradiance, Proceedings of the SPIE, 7461-08, 1-9, 2009.
AUTHORS PROFILE
Kohei Arai, He received BS, MS and PhD degrees in 1972, 1974 and 1982, respectively. He was with The Institute for Industrial Science and Technology of the University of Tokyo from April 1974 to December 1978 also was with National Space Development Agency of Japan from January, 1979 to March, 1990. During from 1985 to 1987, he was with Canada Centre for Remote Sensing as a Post Doctoral Fellow of National Science and Engineering Research Council of Canada. He moved to Saga University as a Professor in Department of Information Science on April 1990. He was a councilor for the Aeronautics and Space related to the Technology Committee of the Ministry of Science and Technology during from 1998 to 2000. He was a councilor of Saga University for 2002 and 2003. He also was an executive councilor for the Remote Sensing Society of Japan for 2003 to 2005. He is an Adjunct Professor of University of Arizona, USA since 1998. He also is Vice