www.biogeosciences.net/9/3213/2012/ doi:10.5194/bg-9-3213-2012
© Author(s) 2012. CC Attribution 3.0 License.
Biogeosciences
Optical characterisation of suspended particles in the Mackenzie
River plume (Canadian Arctic Ocean) and implications for ocean
colour remote sensing
D. Doxaran1, J. Ehn1,2, S. B´elanger3, A. Matsuoka4, S. Hooker5, and M. Babin4
1Laboratoire d’Oc´eanographie de Villefranche, UMR7093, CNRS-UPMC, France 2Centre for Earth Observation Science, University of Manitoba, Manitoba, Canada 3Universit´e du Qu´ebec `a Rimouski, Canada
4Takuvik Joint International Laboratory, CNRS - Universit´e Laval, Qu´ebec, Canada 5NASA/GSFC/Code 616.2, Greenbelt, MD 20771, USA
Correspondence to:D. Doxaran ([email protected])
Received: 31 March 2012 – Published in Biogeosciences Discuss.: 27 April 2012 Revised: 24 July 2012 – Accepted: 30 July 2012 – Published: 22 August 2012
Abstract.Climate change significantly impacts Arctic shelf regions in terms of air temperature, ultraviolet radiation, melting of sea ice, precipitation, thawing of permafrost and coastal erosion. Direct consequences have been observed on the increasing Arctic river flow and a large amount of organic carbon sequestered in soils at high latitudes since the last glacial maximum can be expected to be delivered to the Arc-tic Ocean during the coming decade. Monitoring the fluxes and fate of this terrigenous organic carbon is problematic in such sparsely populated regions unless remote sensing tech-niques can be developed and proved to be operational.
The main objective of this study is to develop an ocean colour algorithm to operationally monitor dynamics of sus-pended particulate matter (SPM) on the Mackenzie River continental shelf (Canadian Arctic Ocean) using satellite im-agery. The water optical properties are documented across the study area and related to concentrations of SPM and par-ticulate organic carbon (POC). Robust SPM and POC : SPM proxies are identified, such as the light backscattering and attenuation coefficients, and relationships are established be-tween these optical and biogeochemical parameters. Follow-ing a semi-analytical approach, a regional SPM quantifica-tion relaquantifica-tionship is obtained for the inversion of the water reflectance signal into SPM concentration. This relationship is reproduced based on independent field optical measure-ments. It is successfully applied to a selection of MODIS satellite data which allow estimating fluxes at the river mouth
and monitoring the extension and dynamics of the Macken-zie River surface plume in 2009, 2010 and 2011. Good agree-ment is obtained with field observations representative of the whole water column in the river delta zone where terrigenous SPM is mainly constrained (out of short periods of maxi-mum river outflow). Most of the seaward export of SPM is observed to occur within the west side of the river mouth.
Future work will require the validation of the developed SPM regional algorithm based on match-ups with field mea-surements, then the routine application to ocean colour satel-lite data in order to better estimate the fluxes and fate of SPM and POC delivered by the Mackenzie River to the Arc-tic Ocean.
1 Introduction
presumably highly refractory terrigenous particulate organic carbon (POCter), expected to be resistant to degradation in
coastal waters until burial in marine sediments, is quite un-certain (Hedges et al., 1997; Schlunz and Schneider, 2000) and warrants careful monitoring in coming years.
The bulk of river discharge into the Arctic Ocean occurs during a relatively short (3–4 months) summer period. Dur-ing the rest of the year river outflow is greatly reduced by the presence of land-fast ice at the river mouths (McClel-land et al., 2012). Monitoring Arctic coastal environments is difficult and costly as they constitute remote sparsely popu-lated areas affected by extreme meteorological conditions. Due to limited field observations of concentrations of ter-rigenous substances transported by rivers to estuarine zones, current estimates of fluxes delivered by rivers to the Arctic Ocean are associated with dramatic uncertainties which pre-vent operational monitoring (Schlunz and Schneider, 2000; Lefouest et al., 2011). Ocean colour remote sensing obser-vations represent a great potential for monitoring the fluxes of coloured terrigenous substances delivered by rivers into the Arctic Ocean, i.e. it can be employed to quantify fluxes at monthly, yearly and multi-year temporal scales and de-tect significant variations induced by changes in Arctic river regimes and draining basins. Such monitoring requires a cal-ibration of existing ocean colour algorithms to account for the specific inherent optical properties (IOPs) of the coloured suspended and dissolved matters detected within the river mouth and turbid plume areas.
The Malina oceanographic expedition was conducted in the Beaufort Sea (Canadian Arctic ocean) onboard the Cana-dian research ice-breakerCCGS Amundsenin August 2009 (Fig. 1). The overall goal of the Malina project is to under-stand how biodiversity and biogeochemical fluxes in the Arc-tic Ocean are controlled by light penetration and how they are affected by ongoing climate change in the Arctic. The objec-tive of the present study is to develop an algorithm to quantify and monitor the concentrations of suspended particulate mat-ter (SPM) in the Arctic coastal wamat-ters directly influenced by the discharge of the Mackenzie River (Canada) and to apply this algorithm to ocean colour satellite data.
The Mackenzie River on its own delivers more terrige-nous SPM to the Arctic Ocean than all the other Arctic rivers combined (Rachold et al., 2004; O’Brien et al., 2006), and is the main source of POCter (Rachold et al., 2004).
How-ever, spatial and temporal variations in these fluxes remain poorly documented. Lack of regular measurements made at the mouth of the Mackenzie River prevents the operational monitoring of the solid (SPM and POCter)fluxes delivered
by the river to the Arctic Ocean. Based on field data collected episodically more than ten years ago, Yunker et al. (1993) ob-served an approximately stable SPM content of POCterat the
river mouth (1.4±0.2 %) during spring and summer floods; the annual fluxes of SPM and POCterhave been roughly
es-timated (Macdonald et al., 1998; O’Brien et al., 2006).
The first step in the present study is to document the con-tent in organic carbon of SPM exported by the Mackenzie River in the Canadian Beaufort Sea, and then follow the spa-tial variations of this content along the river plume to the lim-its of lim-its extension. Taking into account variations of particle composition, a second step is to determine the mass-specific IOPs of the SPM. The results obtained are used to establish a regional SPM quantification relationship for the MODIS ocean colour satellite sensor. This relationship is established using a semi-analytical then an empirical method, then ap-plied to selected MODIS satellite data to remotely sense the dynamics of SPM within surface waters of the Macken-zie River plume. Satellite observations are complemented by field bio-optical measurements carried out in the delta zone to document the dynamics of SPM within the whole water column and estimate the monthly SPM and POC fluxes ex-ported to the coastal Arctic Ocean.
2 Data and methods
2.1 Study area
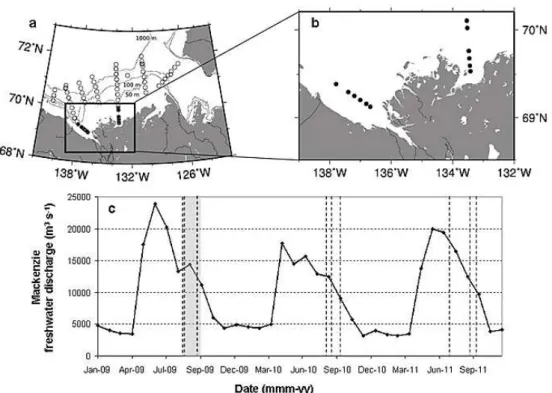
The southeast of the Beaufort Sea is characterized by the presence of a large continental shelf occupying more than 60 000 km2, bordered to the east by the Amundsen Gulf, to the west by the Mackenzie Canyon, to the south by the delta of the Mackenzie River, and by the Beaufort Sea and Canada Basin to the north (Fig. 1, Carmack and MacDon-ald, 2002). North of the Mackenzie Shelf, the circulation is highly variable and often linked to the seasonality of the out-flow of the Mackenzie River which discharges ∼330 km3 of freshwater within a relatively short temporal window (3– 4 months, with a peak at the end of June) (e.g. O’Brien et al., 2006). This discharge typically varies from about 4000 m3s−1during a long winter period (from December to May) to about 25 000 m3s−1during summer (from June to August) (Fig. 1c).
At the end of winter, thermodynamically grown land-fast ice reaches a thickness of approximately 2 m and extends to the 20 m isobath. The external margin of the land-fast ice is subject to dynamic interactions with the Arctic pack ice, which results in the formation of a ridged ice barrier of con-siderable thickness (>20 m) (Macdonald et al., 1995). This zone of ice accumulation, known as the stamukhi zone, forms a barrier that traps fresh waters from the Mackenzie River. The river water accumulates behind the stamukhi zone dur-ing winter and forms what is essentially a lake (unofficially called Lake Herlinveaux) containing approximately 70 km3 of turbid freshwater (Carmack and Macdonald, 2002). Pri-mary production under the land-fast ice is weak during this period due to light limitation caused by solar cycle, ice and intensive vertical mixing.
Fig. 1.Study area and sampling stations: whole study area(a)and river transects(b). Sampling stations (white points) and river transects stations (black points). Mackenzie River freshwater discharge in 2009, 2010 and 2011(c)with the Malina field experiment period (in grey) and dates of the selected MODIS satellite images (dashed lines).
inundates the coastal zone until the stamukhi gives way un-der the pressure and melting generated by the warm mass of freshwater collecting upstream. Rapidly, the warm and very turbid plume can extend over an area of several thousand km2 (Macdonald et al., 1995).
During the summer, melting ice and continual inputs from the Mackenzie River form a 5 to 10 m layer of freshwater which occupies the shelf. It should be noted that it is not un-usual to find ice above the continental shelf up until the end of July. In September, however, the shelf is typically com-pletely free of ice (up to around 72◦N). The movement of the Mackenzie River freshwater plume depends principally on the wind conditions. Under calm or westerly winds, the Coriolis effect tends to maintain the freshwater stream along the coast in an eastward direction, while easterly winds trans-port the waters offshore towards the Canada Basin (e.g. Mac-donald et al., 2002).
2.2 Sampling strategy
A network of sampling stations (Fig. 1) was set up to cover the Mackenzie River mouth, delta and continental shelf up to the limit of the Arctic pack ice extent. A total of 74 stations were sampled at least once: (i) using the CTD-rosette from the research ice-breaker; (ii) from a barge which was sys-tematically deployed from the ship for bio-optical measure-ments; and (iii) from a Zodiac to collect water in the shallow
waters along river transects. Only the barge and Zodiac were used along the river transects stations (Fig. 1b).
At each station, a standard frame comprising a CTD and optical sensors was deployed from the barge using a hand winch and a davit along vertical profiles from surface to 40 m depth (at 0.2 m per second). Temperature, pressure and salin-ity were measured using a Seabird Fastcat SBE-49. The opti-cal sensors included: two absorption and attenuation meters (Wetlabs ac-9) equipped with 10 and 25 cm long tubes, two backscattering meters (Wetlabs ECO-BB3), one chlorophyll fluorescence sensor (Chelsea) and one CDOM fluorescence sensor (Wetlabs ECO-FL2). Light absorption and attenua-tion were measured at 14 wavelengths covering the visible and near-infrared spectral regions: 412, 440, 488, 510, 532, 555, 630, 676, 715, 730, 750, 767, 820 and 870 nm. Light backscattering was measured at 6 wavelengths within a sim-ilar spectral range (440, 532, 650, 720, 770 and 870 nm).
Apparent optical properties were measured using a Compact-Optical Profiling System (C-OPS) built by Bio-spherical Instruments Inc. (San Diego, California). The C-OPS system was equipped with an above-water global so-lar irradiance sensor (Ed)and two in-water downward
ir-radiance and upwelling ir-radiance (Ed andLu, respectively)
during at least three consecutive downcasts between the sea surface and a variable water depth corresponding to the 1 % light level.
At the end of each cast, water samples were collected from selected depths using Niskin bottles mounted on the CTD-rosette and from surface waters (0.2 m depth) using a water sampling bottle from the barge and Zodiac. Water samples were kept stored in the cold and dark (up to two hours) until returning to the ship for immediate filtration and analyses. 2.3 Biogeochemical measurements
SPM concentration – known volumes (V, in l) of seawa-ter (0.2 to 6 l, depending on turbidity) were filseawa-tered in trip-licate through pre-ashed (1 h at 450◦C) and pre-weighed (mass M0, in mg) 25-mm glass-fibre filters (Whatman, GF/F 0.7 µm nominal pore size) at low vacuum (Van Der Linde, 1998). Each filter was then rinsed with Milli-Q wa-ter, dried for 12 h at 60◦C and then stored at−80◦C in a clean Petri dish covered with aluminium foil. In the labora-tory, filters were dried for 24 h at 60◦C, prior to weighing under a dry atmosphere (massM1, in mg) to obtain the SPM concentration (in g m−3)as
SPM=(M1−M0)/V . (1) The average coefficient of variation of SPM for triplicates was±16 %, 10 % and 2 %, respectively, for SPM concentra-tions in the ranges 0.04–1, 1–10 and 10–100 g m−3. The rela-tive uncertainty on measured SPM concentrations was there-fore higher for minimum SPM concentrations, possibly due to (i) insufficient volume of water filtered, so that the increase in the filter mass (M1–M0) was negligible; (ii) increased variability in spatial distributions of particulates in the clear-est sampled waters. It was not practical to filter larger vol-umes of water as filtrations were done until near clogging of the filters. Thus, a reduction in uncertainty would require more replicate sampling, however, this was limited by the volume of water available and the number of filters prepared. Particulate organic carbon (POC) concentrations were measured on the same GF/F filters used for SPM determi-nation. The filters were acidified with 200–350 µl HCl 2N to remove carbonates, dried at 60◦C overnight and then burned on a pre-calibrated CHN analyzer (Perkin Elmer, 2400, com-bustion at 925◦C) for determination of the CO2 produced.
The average coefficient of variation of POC for triplicates was 11 %, and it was 7 % for the POC : SPM ratio.
2.4 Optical measurements
In this section we describe successively the measurements of the inherent optical properties (IOPs, measured in situ and in laboratory) and apparent optical properties (AOPs, namely the remote sensing reflectance,Rrs in sr−1, measured in the
field).
CTD-IOP frame– the CTD, absorption, attenuation and fluorescence signals recorded using the instruments carried by the CTD-IOP frame were binned over 1-s periods, which is imposed by the instrument with the lowest acquisition rate, i.e. the ECO-BB3. A time lag of 0.5 s was imposed to mea-surements made on pumped water (CTD and ac-9). Taking into account the down and upward speed of the frame, a re-sulting minimum of 5 measurements was obtained every me-ter along the wame-ter column.
The ac-9 sensors were regularly calibrated using pure (Milli-Q) water, i.e. before, during and after the Malina field campaign. The raw absorption and attenuation spec-tral values were corrected for temperature and salinity ef-fects following the recommended procedure (Wetlabs ac-9 User’s Guide, 2008) using correction coefficients provided by Sullivan et al. (2006) and Langford et al. (2001), respec-tively, in the visible and near-infrared spectral regions. The “proportional” method was then used to correct for resid-ual scattering effects on absorption measurements (Zaneveld et al., 1994). Wavelength 870 nm was used as the reference wavelength where particulate absorption was assumed to be negligible.
The total volume scattering function measured at 117◦ with the ECO-BB3 sensors,β (117◦) in m−1sr−1, was first corrected for absorption losses along the scattered photon pathway (Wetlabs ECO BB User’s Guide, 2007). Then, tak-ing into account the measured water temperature, molecular scattering by water was calculated (Morel, 1974) and sub-tracted from the absorption-corrected values to retrieve the particulate scattering signal,βp (117◦). Finally, the partic-ulate backscattering coefficient, bbp(λ) in m−1, was
deter-mined through estimation ofβp (117◦) using the χ factor proposed by Boss and Pegau (2001) based on measurements of the volume scattering function with high angular resolu-tion in a diversity of water types. The different steps in the processing of the ECO-BB data are summarized as
bbp(λ)=2π χ (β(117◦, λ, a)e0.0391a−βw(117◦, λ)) (2)
whereλ, in nm, is the wavelength;ain m−1, is the absorption coefficient measured with ac-9 sensors at the corresponding wavelength; andχhas a fixed value of 1.1.
The particulate scattering coefficient,bpin m−1, was
sim-ply obtained as the difference between the measured attenu-ation and absorption coefficients:
bp(λ)=c(λ)−a(λ). (3)
As a result, the vertical profiles of water temperature, salin-ity and fully-corrected multi-spectral optical properties (ab-sorption, attenuation, particulate scattering and backscatter-ing coefficients, CDOM and Chlafluorescence signals) were obtained at each station.
through Whatmann GF/F glass-fibre filters. Each filter was then placed in the centre of a 150-mm integrating sphere (Labsphere) equipped with a home-made filter-holder (see R¨ottgers and Gehnke (2012) for technical details). This method does not require near-infrared correction as scatter-ing effects are negligible. The optical density (ODf)of
parti-cles retained on the filter was then measured using a Perkin-Elmer Lambda-19 spectrophotometer, from 300 to 800 nm. ODf was converted into particulate absorption coefficient
(ap, m−1)using the following expression:
ap=
2.303
α ×(ODf−ODblank)× A
V (4)
where ODblank is the absorbance of a blank filter, A the
clearance area of the particles on the filter (m2),V the vol-ume filtered (m3), andαa path length amplification factor. ODblank was determined by averaging the absorbance
spec-tra of 12 blank-filters measured during the course of the field campaign (e.g. ODblank(550) =−0.005±0.002). While
αis within the range 2 to 2.5 when OD is determined us-ing the common transmittance technique (Roesler, 1998); it reaches∼4 to ∼4.5 when OD is determined using an in-tegrating sphere (R¨ottgers and Gehnke, 2012). R¨ottgers and Gehnke (2012) observed a linear relationship between ODf
andap, with the condition ODf<0.1 and recommended a
value of 4.5 forα; however,αtends to decrease when ODf
increases beyond 0.1 (R¨ottgers and Gehnke, 2012). Since it was not always possible to keep ODf<0.1 due to the large
number of samples processed onboard, we adopt the follow-ing relationship betweenαand ODfderived from batch
cul-tures (R¨ottgers, personal communication):
α=2.9OD2f−4.76ODf+4.5. (5)
Pigments were then extracted within 24 h, using methanol (Kishino et al., 1985), which essentially removes all pig-ments (95 % of sample). The filter was once again placed in the centre of the integrating sphere to measure the ab-sorption coefficient of non-algal particles,anap in m−1. The
absorption coefficient of phytoplankton,aphy in m−1, was
obtained by subtracting anap from the total particulate
ab-sorption coefficient. For some exceptions,anapdata were
fit-ted between 300–380, 521–640 and 700–750 nm to eliminate residue of pigment absorption (see Babin et al., 2003a). For a few samples, noanapdata were available and theaphy
spec-trum was obtained numerically following Bricaud and Stram-ski (1990).
The detailed methodology to determine the light absorp-tion coefficient of CDOM is described in Matsuoka et al. (2012). Briefly, water samples from the barge and Zo-diac were collected using cleaned plastic bucket or glass-bottles and kept stored in the cold and dark until our return to the ship. Water samples were then immediately filtered using 0.2 µm GHP filters (Acrodisc Inc.) to measure light ab-sorbance by CDOM using a liquid waveguide system, Ultra-Path (World Precision Instruments, Inc.), from 200 to 735 nm
at 1 nm increments. This instrument allows selection of the most appropriate optical path length ranging from 0.05 to 2 m (i.e. 0.05, 0.1, 0.5 or 2 m). In most cases, a 2 m optical path length was used for the measurement, except for coastal waters at the Mackenzie River mouth where a 0.1 m optical path length was used. The absorption coefficient of CDOM,
aCDOMin m−1, was then calculated (Matsuoka et al., 2012). In situ AOP measurements – the Rrs signal is defined
as the ratio between the water-leaving radiance, Lw in
W m−2sr−1nm−1, and the global solar irradiance signal,Ed
in W m−2nm−1, both just above the sea surface at z= 0+ (Mobley, 1994). At each station, theLwandEdsignals were
respectively derived and measured using a C-OPS. This in-strument is based on a cluster of 19 state-of-the-art micro-radiometers spanning 320–780 nm and a new kite-shaped backplane design (Morrow et al., 2010) which includes tune-able ballast and buoyancy plus pitch and roll adjustments, to provide unprecedented stability and vertical resolution in near-surface waters. Data sets collected as part of the devel-opment activity to produce the first C-OPS instrument and the Malina expedition were of sufficient resolution and qual-ity to show uncertainties in the execution of apparent optical properties; sampling protocols are measurable at the 1 % and 1 cm level with C-OPS (Hooker et al., 2012).
During three consecutive C-OPS downcasts, the upwelling radiance was measured as function of water depth and ex-trapolated up to the water surface (at null depthz= 0−)over a near-surface interval with homogenous water properties (verified with temperature and attenuation parameters). The water-leaving radiance signal, Lw, was obtained from Lu
(0−)as
Lw(λ,0+)=0.54Lu(λ,0−) (6)
where the constant 0.54 accurately accounts for the partial reflection and transmission of the upwelled radiance through the sea surface, as confirmed by Mobley (1999). A verifica-tion of the extrapolaverifica-tion process used to determine Lu (λ,
0−)was provided by comparing the in-water determination ofEd(λ, 0−)to the above-water solar irradiance signal using
Ed(λ,0−)=0.97Ed(λ,0+) (7)
where the constant 0.97 represents the applicable air–sea transmittance, Fresnel reflectances, and the irradiance re-flectance, and is determined to an accuracy better than 1 % for solar elevations above 30◦ and low-to-moderate wind speeds.
3 Results and discussion
3.1 Concentration and composition (organic carbon content) of suspended particles
During the Malina field campaign, SPM concentrations within surface waters (0–1 m depth) were observed to vary between 0.05 and 142 g m−3, with arithmetic and geometric mean values of 2.9 and 0.6 g m−3, respectively. Suspended particles from the river delta, river plume and from the Beau-fort Sea away from direct influence of the river plume could be considered separately and were distinguished based on their SPM concentration range: 10–150 g m−3, 1–10 g m−3 and 0.05–1 g m−3, respectively. The surface POC concen-tration was observed to vary between 0.01 and 2 g m−3,
with arithmetic and geometric mean values of 0.11 and 0.05 g m−3, respectively.
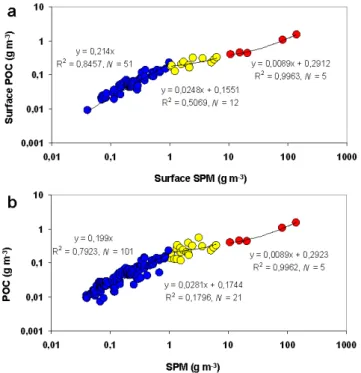
Interestingly, linear relationships were found between the SPM and POC concentrations, in each of the water masses (delta, plume and open waters) (Fig. 2). A determination co-efficient close to 1 (N= 5) and a slope of 0.0089 were found in the river delta (Fig. 2a), indicating a stable composition of suspended particles (a priori mineral-rich particles, av-erage POC : SPM = 2.2 %). The robustness of this relation-ship could not be assessed in detail as only two river tran-sects were conducted (west and east river mouths). In the river plume, the determination coefficient of the linear rela-tionship is much lower (R2= 0.51,N= 12) indicating higher variations of the SPM composition in this transition zone be-tween mineral-rich particles in turbid river waters and po-tentially organic-rich particles in open ocean waters (aver-age POC : SPM = 12.2 %). This last statement is confirmed by a high determination coefficient (R2= 0.85,N= 51, av-erage POC : SPM = 21 %) observed between the SPM and POC concentrations in open ocean waters (probably due to reduced variability in particle composition).
A major implication in terms of operational monitoring is that if surface SPM concentrations can be retrieved from either ocean colour remote sensing or field optical measure-ments over the study area, the corresponding POC concen-tration can be reasonably well estimated using the empirical linear relationships presented here (Fig. 2a). This statement remains valid when considering SPM which was sampled at various water depths from 0 to 150 m, including the deep chlorophyll maximum (DCM) (Fig. 2b). Based on chloro-phyll fluorescence data (not shown), there was no DCM in the very shallow waters of the delta zone. Along the conti-nental shelf (water depths ranging from 20 to 200 m) directly influenced by the river plume, a DCM was usually located at depths varying from 15 to 40 m. It was systematically de-tected within 60 and 90 m depth in open ocean waters (data not shown). Compared with results obtained for surface wa-ters, the relationship between SPM and POC within the water column: (i) is the same in the river delta (as only surface wa-ters were sampled); or (ii) only slightly changes in the open
Fig. 2.Relationship between the POC and SPM concentrations in the Mackenzie continental shelf:(a)within surface waters (0–4 m depth) and(b)within the water column (0–150 m depth). The fol-lowing three ranges of SPM concentrations are distinguished: 0.02– 1 g m−3(blue); 1–10 g m−3(yellow) and 10–200 g m−3(red).
ocean waters (slope of 0.20 instead of 0.21) with a slight de-crease of the determination coefficientR2of 0.79 (N= 101) instead of 0.85 (N= 51). However, in the river plume wa-ters, the linear relationship between SPM and POC becomes highly scattered (R2of 0.18,N= 21); this is most probably due to the wide range of particles sampled in the river plume and oceanic waters below it (i.e. mineral-rich suspended sed-iments, organic-rich phytoplankton cells, aggregates of min-eral and organic particles) corresponding to wide variations of the POC : SPM ratio from 2 to 25 %. This explains why there is no relationship between the measured POC and SPM concentrations.
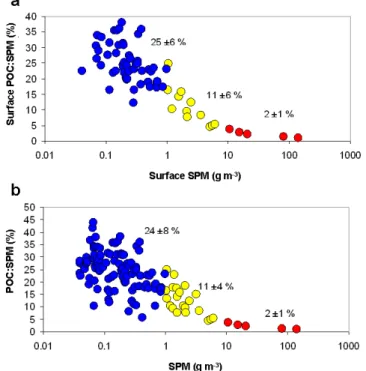
A simple way to examine the variations of SPM compo-sition in the study area is to use the POC : SPM ratio, ex-pressed in %. In open ocean waters, an average relation-ship has been observed relating the POC content of ma-rine particles to their mean organic matter composition: SPMorg: POC = 2.6 (Copin-Mont´egut, 1980; Van Raaphorst
and Melschaert, 1996; see also Babin et al., 2003b). In the case of organic-rich particles (SPM≈SPMorg), the inverse
In the Malina dataset (Fig. 3), suspended particles sampled in the river delta present a POC : SPM ratio of 2±1 %, with extreme values of 1 and 4 %, which is in close agreement with previous observations of Yunker et al. (1993). Inversely, in open ocean waters, the POC : SPM ratio presents strong variations from 15 to 40 %, indicating that some of the partic-ulate samples in the Beaufort Sea were almost 100 % organic. Again the river plume waters appear as a transition zone where the POC : SPM ratio varies from 5 to 16 %, i.e. from mineral-rich to organic-dominated particles. When consider-ing SPM sampled at all waters depths, maximum POC : SPM ratios are observed (corresponding to almost entirely organic particles in the DCM).
3.2 Characterisation of the inherent optical properties
The inherent and apparent optical properties of surface wa-ters in the Mackenzie continental shelf are analysed in or-der to establish proxies for the quantification of SPM from in situ and satellite remote sensing measurements. The in-herent optical properties which directly impact on the ocean colour remote sensing signal (Rrs) are the absorption and
backscattering coefficients (e.g. Gordon et al., 1975; Morel and Prieur, 1977). Inherent optical properties commonly used in field measurements for quantifying SPM concentration are the attenuation, and particulate scattering and backscattering coefficients. In this section, only measurements carried out along the river transects and in the most turbid stations of the river plume (SPM>1 g m−3)are considered, as the objec-tive of the study is to monitor the SPM dynamics in the river mouth and plume areas.
Firstly, consistency between absorption measurements made in situ with ac-9 sensors and in the laboratory with bench spectrophotometers is assessed. As the ac-9 sensor is calibrated using pure water, the measured absorption signal is only representative of the CDOM plus SPM contributions. Absorption values measured within the first meter below the water surface (0–1 m depth) were averaged for direct com-parison with laboratory absorption measurements on water samples collected at the same water depth. A satisfactory re-sult was obtained when plotting the absorption coefficient from the ac-9 vs. the CDOM absorption coefficient (from the UltraPath) plus the total particulate absorption coefficient (from the spectrophotometer equipped with the integrating sphere). At 440, 555 and 715 nm, linear relationships were obtained with slopes close to 1 (in the range 0.96 to 0.98), negligible intercepts and determination coefficients close to 1 (R2>0.96,N= 16). A direct implication is that the total par-ticulate absorption coefficient can be retrieved by subtracting theaCDOMsignal (UltraPath) from the absorption coefficient
measured with the ac-9 sensors.
As the total absorption coefficient is obtained from the inversion of the Rrs signal, i.e. from atmospherically
cor-rected ocean colour satellite data, the next step was to iden-tify spectral bands where the contribution of SPM is
pre-Fig. 3.Variations of the POC : SPM ratio (in %) in the Mackenzie continental shelf as a function of the SPM concentration:(a)within surface waters (0–4 m depth) and(b)within the water column (0– 150 m depth). The following three ranges of SPM concentrations are distinguished: 0.02–1 g m−3(blue); 1–10 g m−3(yellow) and 10–200 g m−3(red).
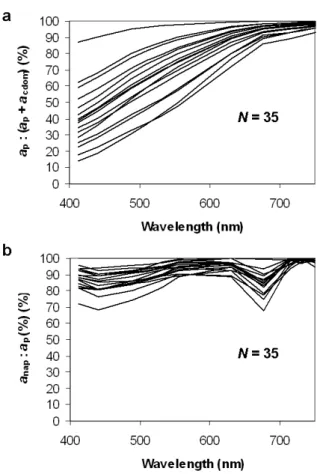
dominant over that of CDOM. The inverse exercise (i.e. re-trieving the CDOM absorption coefficient from the total ab-sorption signal) was successfully achieved in the Mackenzie River plume by B´elanger et al. (2008). Except at the river mouth where the water optical properties were observed to be SPM-dominated, the CDOM contribution to total absorp-tion proved to be predominant at short visible wavelengths (<550 nm) (Fig. 4a). Therefore, longer wavelengths should be preferably used to avoid a major influence of CDOM.
The respective contributions of phytoplankton pigments and non-algal particles to particulate absorption were then assessed using spectrophotometer measurements on parti-cles retained on glass-fibre filters, before and after bleach-ing for depigmentation. The spectral variations of the ratio
anap:ap(Fig. 4b) show as expected that spectral bands
cen-tred around the Chl a absorption peaks (440 and 675 nm) should be avoided. The contribution of phytoplankton pig-ments is minimum (<20 %) in the near-infrared spectral re-gion (>700 nm) but also within a visible spectral window (530–650 nm).
Fig. 4.Spectral contribution of particulate light absorption to par-ticulate plus CDOM light absorption(a). Spectral contribution of light absorption by NAP to particulate light absorption(b). Results were obtained from CDOM and particulate light absorption mea-surements carried out in laboratory on surface waters sampled in the field (see the text for details).
To determine the SPM-specific absorption coefficient,ap∗
in m2g−1, the measured absorption signal from the ac-9 mi-nus CDOM absorption, i.e. the difference [aac9–aCDOM], was
regressed as a function of SPM concentration. Linear rela-tionships (R2>0.95,N= 16, mean RMSE = 0.15 m−1)were obtained at visible and near-infrared wavelengths (440, 555 and 715 nm) which show that as a first approximation, a unique SPM-specific absorption coefficient can be derived which is representative of the most turbid waters in the Mackenzie River plume and delta. The meanap∗(440) value
obtained (0.0611 m2g−1)is well in the range of previous
val-ues reported for mineral-rich suspended particles in coastal waters (Babin and Stramski, 2004; Estapa et al., 2012).
The next step, in the scope of quantifying SPM from field and remote sensing bio-optical measurements, was to relate the attenuation, particulate scattering and backscattering co-efficients (respectivelyc, bp andbbp, in m−1)to the SPM
concentration.
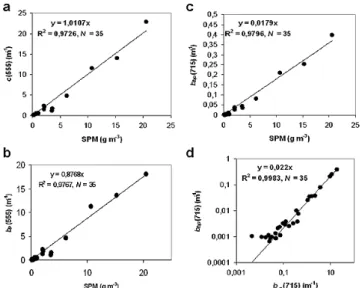
A linear relationship is obtained betweenc(555) and SPM (R2= 0.97,N= 35, RMSE = 0.77 m−1), with a slope and
de-termination coefficient both close to 1, and a negligible in-tercept (Fig. 5a). This 1 : 1 relationship makes the beam at-tenuation coefficient at 555 nm an excellent proxy for the SPM concentration in the Mackenzie River plume. Note that results are only presented up to SPM concentrations of 20 g m−3, as the ac-9 sensors did saturate at the highest SPM concentrations encountered at the river mouth (west side). A linear relationship with null intercept and a determination coefficient close to 1 is obtained betweenbp(555) and SPM
(Fig. 5b) (R2= 0.98,N= 35, RMSE = 0.61 m−1); however, the slope (0.88 m2g−1)is lower than that obtained forc(555) indicating that at 555 nm, light scattering by particles con-tributes to almost 90 % of the total attenuation signal. These results are quite consistent with those reported by Babin et al. (2003b) and recently Neukermans et al. (2012) in Case 2 waters.
Finally, a third linear relationship is established between the particulate backscattering coefficient, bbp, and SPM,
which is a fundamental relationship for the remote sens-ing of SPM in the Mackenzie River plume. This linear relationship is obtained at all the considered visible and near-infrared wavebands (R2>0.94,N= 35), with the high-est determination coefficient and lowhigh-est RMSE (R2= 0.98,
N= 35, RMSE = 0.012 m−1)in the near-infrared spectral re-gion, e.g. at 715 nm (Fig. 5c). Note that the value of the SPM-specific backscattering coefficient obtained at 715 nm (0.0179 m2g−1, i.e. the slope of the linear regression estab-lished betweenbbp(715) and SPM, Fig. 5c) is slightly higher
than values reported by Neukermans et al. (2012) in the North Sea and French Guyana coastal waters, most proba-bly as our dataset is mainly representative of the mineral-rich particles of the Mackenzie delta zone. The inverse linear re-lationship (SPM = 54.7×bbp(715), R2= 0.98,N= 35, mean
RMSE = 1.05 g m−3)can be used to derive the SPM concen-tration frombbpmeasurements.
Additionally, the particulate backscattering ratio,bbp:bp
in %, is known to be to some extent representative of the SPM composition. This ratio is typically lower or equal to 1 % in phytoplankton-dominated waters (Twardowski et al., 2001) and higher or equal to 2 % in coastal waters (McKee et al., 2009) (see also Boss et al., 2004 for the theoretical foun-dation). The Malina dataset reveals that SPM in the Macken-zie River plume typically consists of mineral-rich particles specific of so-called Case 2 waters, with abbp:bp ratio at
715 nm of 2.2 %, which is the slope of the linear regression established betweenbbp(715) andbp(715) (R2= 1, N= 35,
RMSE = 0.056 m−1) (Fig. 5d). This ratio significantly
de-creases to 1.5 % in the clearest waters sampled offshore the river plume, i.e. forbp(715)<0.05 m−1 (1.5 % is the slope
Fig. 5.Attenuation(a), particulate scattering(b)and backscatter-ing(c)coefficients as a function of the SPM concentration. Results are presented at 555 nm (attenuation and scattering) and 715 nm (backscattering). Relationship between particulate light scattering and backscattering at 715 nm(d).
3.3 Ocean colour SPM quantification algorithm
Characterization of the inherent optical properties in waters directly influenced by the Mackenzie River plume has there-fore allowed (i) establishment of direct bio-optical proxies for SPM concentration, namely the attenuation and backscat-tering coefficients; and (ii) identification of the most appro-priate spectral bands for remotely sensing SPM using, e.g. MODIS or MERIS satellite data.
Taking into account the results obtained (Sect. 3.2), a semi-analytical approach is used to develop a robust SPM quantification relationship for the Mackenzie River plume. Following the approach developed by Doxaran et al. (2006), the spectralRrssignal can be related to the SPM
concentra-tion according to
Rrs(λ)=
0.176
Q(λ)
bb(λ)
a(λ)+bb(λ)
(8) witha andbbthe total absorption and backscattering
coeffi-cients (including the pure water contribution) andQthe ratio of upwelling irradiance to upwelling radiance (to a first ap-proximation, a constant Q-value of 3.6 sr was considered).
Note that there are currently no agreed look-up tables for the Q-factor in turbid coastal waters, but see the simulations made by Loisel and Morel (2001) and Park and Ruddick (2005). The Q-factors measured along river transects during the Malina field campaign, using a miniaturized multispec-tral (406, 438, 494, 510, 560 and 628 nm) radiance camera (see Antoine et al., 2012 for measurement details), showed very limited spectral variations: maximum variations of 10 % between 406 and 628 nm, 7 % on average, at nadir. While
limited to the visible spectral domain, these measurements support the use of a spectrally-flat Q-factor in our model. Botha andbbcoefficients are the sums of the contributions
by the main optically active water constituents: pure seawa-ter (w), CDOM and SPM (p) (which can be subdivided into Chla, for phytoplankton, and non-algal particles):
a(λ)=aw(λ)+aCDOM(λ)+SPM×ap∗(λ) (9)
bb(λ)=bbw(λ)+SPM×bbp∗(λ) (10)
whereap∗andbbp∗ are respectively the SPM mass-specific
absorption and backscattering coefficients, in m2g−1. In moderately turbid waters, visible wavebands have been considered in the scope of developing general relationships between theRrs signal and SPM concentration, e.g. Stumpf
and Pennock (1989) and more recently Nechad et al. (2010). In highly turbid sediment-dominated waters, robust SPM quantification relationships can be established usingRrsband
ratios between the near-infrared (e.g.λNIR= 800 or 850 nm)
and visible (e.g. λVIS= 550 or 650 nm) spectral regions
(Doxaran et al., 2002, 2003, 2006). Considering the near-infrared spectral region is required in such waters where the
Rrssignal tends to saturate at visible wavebands (Doxaran et
al., 2002). As a first approximation, assuming limited spec-tral variations of bi-directional effects, such a ratio can be written as
Rrs(λNIR)
Rrs(λVIS)=
bbp(λNIR)
bbp(λVIS) (11)
×aw(λVIS)+aCDOM(λVIS)+SPM× [ap
∗+bbp∗](λVIS)
aw(λNIR)+SPM× [ap∗+bbp∗]
(λNIR)
where light absorption by CDOM is assumed to be negligible in the near-infrared; the contribution by pure water to light backscattering is also negligible compared to that of SPM (for SPM>1 g m−3).
This simple model was run selecting 560 and 780 nm, re-spectively, as visible and near-infrared wavelengths (as they match available C-OPS bands). The spectral pure water ab-sorption coefficients are taken from Kou et al. (1993). The SPM-specific absorption and backscattering coefficients are set to the mean values documented in the present study: 0,0198 and 0,0031 m2g−1 for the mass-specific absorption coefficients at 560 and 780 nm; 0.0187 and 0.0175 m2g−1 for the mass-specific backscattering coefficients at 560 and 780 nm. The contribution of CDOM to light absorption is determined based on results reported in Fig. 4a: [ap+
aCDOM](560)=1.30×ap(560) and [ap+aCDOM](780)=
1.05×ap(780). Using these values as inputs in the
semi-analytical model Eq. (11), the resulting relationship ob-tained between Rrs(780) :Rrs(560) and the SPM
concen-tration (Fig. 6a) is of the same type as those obtained in several European sediment-dominated estuaries, namely the Gironde, Loire and Tamar (Doxaran et al., 2006).
Fig. 6.Relationship between theRrs(780) :Rrs(560) ratio and SPM
concentration along the two river transects.(a)Empirical relation-ship (black points) with the associated best second order polynomial fit and semi-analytical relationship (grey points).(b)Inverse rela-tionship giving the SPM concentration from theRrs(780) :Rrs(560)
ratio.(c)Potential influence of variations in CDOM contribution to light absorption at 560 nm on the established SPM quantification relationship (grey lines).
the C-OPS system as a function of measured SPM concentra-tions. A second order polynomial equation fits this empirical relationship over the whole range of SPM observed in situ (0.1–150 g m−3)and closely reproduces the semi-analytical relationship established using the mean SPM-specific inher-ent optical properties (Fig. 6a). Note that the semi-analytical model tends to overestimate the lowest SPM concentra-tions (≤1 g m−3)where some of the assumptions made in
Eq. (9)–(11) are no longer valid. In order to compare these empirical and semi-analytical relationships, the measured
Rrs(780) :Rrs(560) values were used as inputs in Eq. (11)
to compute SPM concentrations. The statistics of the linear regression established between the measured and computed SPM concentrations (R2= 0.98,N= 45, slope = 0.94, mean RMSE = 6.1 g m−3)shows the overall good performance of
the semi-analytical model which only slightly underesti-mates the field-measured SPM (considered here as ground-truth). The averaged absolute differences observed between the computed and measured SPM concentrations (46 % (all data), 18 % (SPM≥5 g m−3) and 7 % (SPM≥10 g m−3))
confirm the good performance of the semi-analytical model at least in the turbid waters of the Mackenzie River plume associated to high SPM concentrations. The inverse relation-ship allows retrieval of the surface SPM concentration in the Mackenzie River mouth and turbid plume fromRrs
measure-ments around 560 and 780 nm (Fig. 6b).
We further examine the sensitivity of the mean semi-analytical relationship to the variations in the SPM-specific IOPs and the CDOM contribution to total absorption. The sensitivity of theRrs(780) :Rrs(560) ratio to variations in (i)
ap∗, (ii) bbp∗and (iii) CDOM contribution to light
absorp-tion by CDOM plus SPM was investigated using the semi-analytical model Eq. (11). Based on the IOPs and SPM con-centrations measured in the field,ap∗andbbp∗were observed
to vary within±25 % and±15 %, respectively, around their mean values at 560 and 780 nm. The CDOM contribution to light absorption by CDOM plus SPM was observed to vary from 10 % to 50 % at 560 nm, and from 1 % to 5 % at 780 nm. These natural changes inap∗andbbp∗have rather limited
im-pacts on the computed Rrs(780) :Rrs(560) ratio (variations
of 10 % and 15 %, respectively). Changes in the CDOM contribution to light absorption by CDOM plus SPM have a higher impact (25 % variations in the Rrs(780) :Rrs(560)
ratio). Using the established quantification relationship be-tween Rrs(780) :Rrs(560) and SPM, a changing
contribu-tion of light absorpcontribu-tion by CDOM is therefore the main factor inducing uncertainties in the estimated SPM concen-tration. Based on results reported on Figure 4a, the ratio [(ap+aCDOM)/aCDOM] at 560 nm varies from 1.10 to 1.60
around the mean value initially set at 1.30. Taking into ac-count these variations of the CDOM contribution to absorp-tion, the extreme relationships used to retrieve the SPM con-centration from theRrs(780) :Rrs(560) ratio can be computed
(Fig. 6c), which provide a first estimation of the uncertainties associated with the recovered SPM concentration.
3.4 Remote sensing of SPM dynamics in the Mackenzie River plume
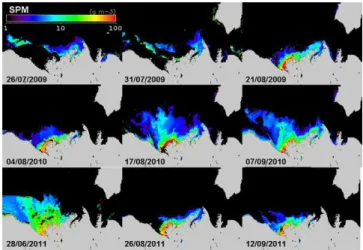
MODIS-scenes were selected in 2009, 2010 and 2011 to provide a synoptic view of the seasonal to multi-annual dy-namics of SPM in the Mackenzie River plume. The selected dates are: 26 July, 31 July and 21 August 2009 (the 2009 summer period when the Malina campaign took place was associated with high cloud coverage); 4 August, 17 August and 7 September 2010; 28 June, 26 August and 12 September 2011. Two multi-scattering atmospheric corrections meth-ods were tested on the selected MODIS data: (i) the near-infrared correction (two bands) suitable for the case of mod-erately turbid waters and (ii) the near-infrared/shortwave-infrared switching method better adapted to highly turbid wa-ters (Wang and Shi, 2007). The first correction proved to be suitable for the majority of the turbid waters of the Macken-zie River plume with only the most turbid waters located at the river mouth being sometimes flagged. The second correc-tion produced very similar results as the switch to shortwave-infrared wavelengths was only required for a few pixels cor-responding to the most turbid waters at the river mouth. The two correction methods were assumed to provide satisfactory results in the turbid waters of the Mackenzie River plume as they allowed retrieving similar Rrs values and spectral
variations (500–800 nm) within the range observed in situ based on C-OPS measurements (Hooker et al., 2012). The first correction method was thus selected to retrieve theRrs
signal at 555 and 748 nm, compute theRrs(780) :Rrs(560)
ratio and finally apply the established SPM quantification relationship (Fig. 6b). Clouds and sea-ice were systemati-cally flagged. Results proved to be satisfactory in terms of retrieved ranges ofRrs(780) :Rrs(560) values and SPM
con-centrations (Fig. 7).
Only the summer period (June–September) is suitable for ocean colour satellite observations of the Mackenzie River plume due to limits imposed by solar light availability and sea-ice cover. However, this short period represents most of the variability observed in the region, such as the breaking-up of the stamukhi (natural ice barrier at the river mouth), development and offshore extension of the Mackenzie turbid waters over the continental shelf and the progressive settling of the SPM on the shelf, which depends mainly on wind, tides, sea-ice and regional circulation conditions.
Very few cloud-free images were recorded coincidently with the Malina field experiment, i.e. between June and Au-gust 2009 (Fig. 1c). SPM maps derived from MODIS-Aqua data at the end of July show high SPM concentrations (from 10 to 50 g m−3)extending 200 km offshore from the river
mouth (Fig. 7). SPM tended to be transported westwards, following the bottom morphology to the Mackenzie Canyon. One month later, at the end of August, the extension of the plume was more limited and SPM was clearly concentrated around the river mouth, resulting in the development of a maximum turbidity zone along the west side of the delta. The progressive decrease of freshwater river discharge in June (23 900 m3s−1), July (20 200 m3s−1), and then August to September (13 300 and 14 400 m3s−1, respectively, see
Fig. 7. Maps of SPM concentrations retrieved from selected MODIS-Aqua satellite data recorded in 2009 (top), 2010 (middle) and 2011 (bottom).
Fig. 1c) is consistent with the observed variation of SPM con-centrations.
On the 4 August 2010, high SPM concentrations were lo-cated at a maximum turbidity zone in the river delta, as in August 2009. Thirteen days later (17 August 2010), the river plume was extending north with SPM concentrations higher than 10 g m−3 observed 250 km offshore (Fig. 7). A simi-lar plume extension could be observed three weeks later (7 September 2010) but now with slightly lower SPM concen-trations and a plume extending 200 km offshore (instead of 250 km mid-August).
In 2011, one cloud-free image offered a view of the ex-tension of the river plume at the end of June (Figs. 1c and 7). At this time the offshore extension was the largest ob-served and corresponded to the highest surface SPM concen-trations retrieved along the continental shelf, mainly along a channel from the west river mouth to the Mackenzie Canyon. This situation most probably resulted from the recent break-ing of the stamukhi. The next available cloud-free images, measured at the end of August and beginning of September after a progressive decrease of the river outflow, showed the typical situation of a concentrated maximum turbidity zone surrounding the river mouth and only extending over the river delta.
3.5 Vertical dynamics of SPM in the Mackenzie River delta
Ocean colour satellite data proved to provide useful infor-mation about the extension and dynamics of the Mackenzie River plume, through the estimation of surface SPM concen-trations. However, remote sensing observations also present two major limits in the scope of studying SPM dynamics in a river plume. Firstly, they are limited to surface waters, i.e. the layer below the air-water interface where the solar light penetrates and is reflected towards satellite sensors. Depend-ing on water turbidity and on the wavelength considered, this layer can be of depth less than 1 m and therefore no infor-mation is obtained concerning the vertical variations of SPM within the water column. Secondly, such passive radiometric measurements are dependent on the level of cloud coverage, which may prevent observations from being collected dur-ing key periods associated with the export of particles from rivers to the ocean (e.g. the summer 2009 period over the Mackenzie continental shelf). Field observations are there-fore necessary to provide regular measurements within the whole water column, e.g. to detect bottom and intermediate nepheloid layers.
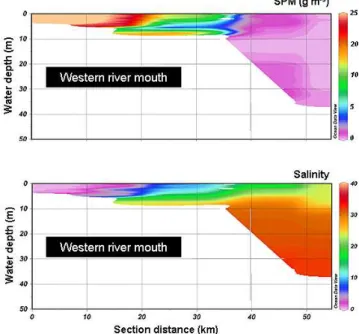
The Malina dataset was used specifically to document the vertical distribution of SPM in the Mackenzie River delta apparently associated with a permanent maximum turbidity zone. CTD and bio-optical measurements were carried out along river transects on 13 August 2009 (west side) and 16 August 2009 (east side), at a distance greater than 50 km off-shore from the river mouth (salinity of 0, water depths of 2 m (west), and 8 m (east)). For both transects, thebbp(715)
coefficient was used as a proxy for the SPM concentration. The water mass was well mixed and almost homogeneous in terms of temperature and salinity at the river mouth, while the stratification between fresh and salted waters started 5 km offshore (Figs. 8 and 9).
The most turbid waters were located in shallow regions of the western river mouth where predominantly freshwaters (salinity<10) extend up to 20 km offshore (Fig. 8). This area is characterized by almost homogeneous vertical profiles of SPM, at least along a 10 km distance. From 10 to 35 km off-shore from the mouth, fresh and saline water masses were stratified and two turbidity layers clearly formed: a 4 m thick surface layer and a thinner but more turbid bottom layer probably associated with different kinds of SPM (fine par-ticles at the surface and coarse aggregates close to the bot-tom). This assumption is confirmed by the measured vertical variations of the particulate backscattering ratio,bbp:bp, at
532 and 715 nm. In the delta zone, this ratio typically in-creases from 2 % within surface waters to 3.5 % within the bottom nepheloid layer. In deeper waters (15 to 40 m water depth), this ratio typically increases from 0.5–1.5 % within surface waters to 2 % close to the bottom. These variations reflect the presence of different types of particles along the water column: (i) mixed phytoplankton and mineral-rich
par-ticles in the surface layer and (ii) suspended sediments in the bottom layer. The maximum turbidity zone was strictly con-fined within the river delta up to the 10 m isobath. Offshore, the water mass remained slightly stratified, both in terms of salinity and SPM, with significantly lower SPM concentra-tions (<5 g m−3).
Along the east river transect (Fig. 9), the freshwater influ-ence was less pronounced (with minimum water salinity of 10) and SPM concentrations were approximately half those observed on the west side of the mouth. In terms of vertical profiles of turbidity and salinity, the water mass was rather homogeneous at the river mouth then progressively stratified to highly stratified from the river mouth to 50 km offshore (10 m isobath). With increasing distance from the mouth, the surface plume progressively declined, while the bottom layer became thicker with higher SPM concentrations, most prob-ably resulting from flocculation processes which enhanced SPM settling. This assumption is supported by the observed variation trend in the shape of the attenuation coefficient spectrum (c(λ)=Aλ−γ, withγ the spectral slope):γ typ-ically decreases from 1.5 within surface waters to 0.8 in the bottom layer (not shown). These variations are representa-tive of changes in the particle size distribution along the wa-ter column, with an increasing proportion of coarse particles occurring for decreasingγ-values (Boss et al., 2001).
The flocculation and settling of fine particles exported by the Mackenzie River onto the shelf seems to occur for water salinity varying from 0 to 4: the SPM concentration measured within surface waters was observed to decrease by a factor of 7 from the river mouth (west side) to adjacent coastal waters with salinity of 4, i.e. along a distance of 30 km (Fig. 10a). As a first approximation (R2= 0.83,N= 10), a power-law func-tion can be used to model the decrease in SPM concentrafunc-tion with increasing water salinity. These results suggest that set-tling of SPM (which is enhanced by flocculation) occurs very rapidly close to the river mouth (typically within a 10-km off-shore distance) mainly at very low salinity (0–1). Therefore, most of the SPM exported at the river mouth settle down in the shallow delta zone. Despite these intensive flocculation processes, a significant amount of SPM appears to remain in suspension and be transported offshore, as highlighted by the observed SPM concentrations which smoothly decrease from about 10 to 1 g m−3as water salinity increases from 5 to about 25 (Fig. 10a). This phenomenon is apparently inde-pendent of the river outflow as observed on both west and east river transects.
Fig. 8.Spatial variations ofbbp(715)-derived SPM concentration,
in g m−3 (see the text for details), and water salinity along the Mackenzie River mouth (west side). Measurements were carried out on the 13 August 2009.
Fig. 9.Spatial variations ofbbp(715)-derived SPM concentration, in g m−3 (see the text for details), and water salinity along the Mackenzie River mouth (east side). Measurements were carried out on the 16 August 2009.
with ratio values close to 2 % at the river mouth (salinity of 0) almost linearly increasing to values of about 10 % for wa-ter salinities of 20 (Fig. 10c). Note that this relationship is obtained when combining the Malina dataset with previous
measurements carried out in 2004 during the Canadian Arc-tic Shelf Exchange Study (B´elanger et al., 2008). Dilution seems to be the main process controlling the variations of the POC : SPM ratio from the river mouth up to a water salinity of 20 (see also Emmerton et al., 2008 for similar observa-tions). Above this salinity value, suspended particles become phytoplankton-dominated with a POC : SPM ratio rapidly in-creasing up to 25 % (Fig. 3).
Field measurements and satellite observations are qualita-tively in agreement: both locate majority of the SPM on the west part of the river mouth, with a maximum turbidity zone confined in the river delta (water depth<10 m). The verti-cal homogeneity of water turbidity results from the high river outflow, as up to 80 % of the Mackenzie freshwater discharge into the Beaufort Sea occurs through the west mouth. During the sampling period, the outflow through the east river mouth was too low to homogeneously maintain particles in suspen-sion, so that stratification of turbidity rapidly occurred. 3.6 Estimation of SPM and POC fluxes at the
river mouth
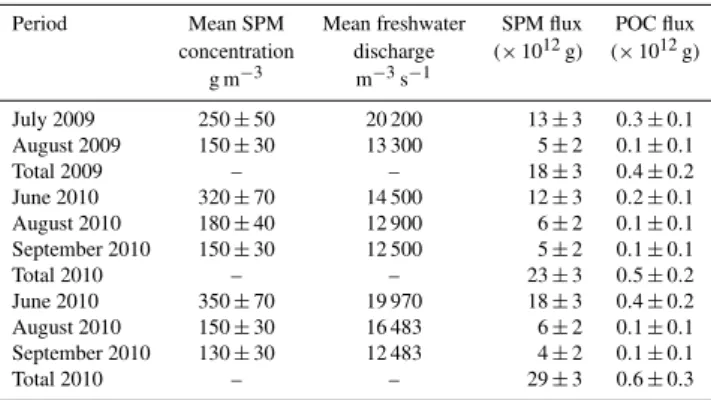
We finally attempt to estimate the fluxes of SPM and POC at the mouth of the Mackenzie River. For that we use (i) the freshwater discharge (monthly averages) measured by the Canadian Water Office, (ii) SPM concentrations retrieved from MODIS satellite data and (iii) POC : SPM ratio values documented based on field observations (river transects) dur-ing the Malina campaign. Estimations are therefore limited to the 2009, 2010 and 2011 summer periods (June to Septem-ber). Available satellite observations are averaged within each month to produce monthly averages of SPM concen-trations at the river mouth (i.e. within the pixels containing the two most upstream stations sampled along the river tran-sects). It implies that the averaged SPM concentration ob-tained is more or less representative of the monthly averages depending on the number of satellite observations available. The SPM concentration retrieved from satellite data is as-sumed to be equal to the mean SPM concentration within the water column at the river mouth where water depths are respectively 2 m (west side) and 8 m (east side). This as-sumption is supported by our field optical measurements (see Figs. 8 and 9). The POC : SPM ratio at the river mouth is set to 2 % based on our field dataset. According to previous studies in similar highly turbid estuarine waters (Doxaran et al., 2004, 2009), both bottom reflection and adjacency effects onRrsretrieved from satellite data can be assumed to be
neg-ligible at 550 and 780 nm, as a first approximation.
Fig. 10.Observed variations of the SPM concentration(a), SPM concentration (values lower than 25 g m−3) (b) and POC : SPM ratio(c) as a function of water salinity. Only stations along the two river transects where the water salinity, SPM and POC con-centrations were measured simultaneously are reported. Black and grey circles respectively represent the west and east river tran-sects. For comparison measurements of salinity and SPM concen-trations carried out along the same river transects during the Cana-dian Arctic Shelf Exchange Study (CASES) in June and July 2004 (see B´elanger et al., 2008 for exact sampling locations) (black and grey squares, respectively for the west and east river transects) are included. The power-law (a)and linear (b) regressions between SPM and salinity were obtained when considering the Malina and CASES measurements.
September 2011 (3, 3 and 2 images, respectively). The re-sulting monthly-averaged SPM concentrations were: 245 and 145 g m−3(2009), 315, 175 and 145 g m−3(2010), 345, 145
and 130 g m−3 (2011). Taking into account the uncertain-ties associated with the estimated SPM concentration within the whole water column at the river mouth (say ±25 %) (Doxaran et al., 2009), these values were multiplied by the volume (in m3)of freshwater discharged each month to ob-tain an estimation of the SPM fluxes: (i) (18±4)×1012g in July and August 2009, (ii) (23±4)×1012g in June, August
and September 2010 and (iii) (29±5)×1012g in June, Au-gust and September 2011. Assuming a constant POC : SPM ratio of 2 % at the river mouth during these periods, the corre-sponding POC fluxes are (i) (0.4±0.2)×1012g in July and August 2009; (ii) (0.5±0.2)×1012g in June, August and September 2010; and (iii) (0.6±0.3)×1012g in June, Au-gust and September 2011 (Table 1).
These monthly fluxes can be compared to previous rough estimates of SPM and POC delivered annually by the Mackenzie River to the delta: 127×1012g and 2×10¹²g, respectively (Macdonald et al., 1998 and references therein). Our estimates are in the good order of magnitude but are lower than expected considering that most of the freshwa-ter and SPM are discharged between May and September. Our SPM algorithm still requires a full validation based on match-ups with field measurements at the river mouth. Also the monthly-averaged SPM concentrations estimated from ocean colour remote sensing data depend on the number of available cloud-free satellite images; this number can signif-icantly increase by using MERIS and MODIS-Terra satellite observations in addition to MODIS-Aqua. Third, the high-est SPM concentrations at the Mackenzie River mouth are certainly found in May and June during the breaking-up of the stamukhi, periods during which few cloud-free satel-lite observations were available in 2009, 2010 and 2011. This may partly explain the rather low SPM fluxes estimated based on remote sensing data in the present study. More-over, previous estimates were based on field measurements made in the Mackenzie River, i.e. upstream the river delta, while our remote sensing observations concerned the mouth of the Mackenzie River, i.e. the exact limit between the river and adjacent coastal waters. In order to estimate SPM fluxes exported to the ocean, field measurements carried out sev-eral km upstream the river mouth tend to underestimate the trapping of SPM within the delta zone (e.g. Seitzinger et al., 2005; Doxaran et al., 2009). The advantage of remote sensing data is their capability to estimate SPM concentra-tions exactly at the river mouth.
4 Summary and conclusions
Table 1.Monthly-averaged SPM concentration (g m−3)at the river mouth, based on MODIS-Aqua satellite observations, and corre-sponding monthly-averaged freshwater discharge (m3s−1). The monthly-averaged SPM flux (×1012g) at the river mouth is esti-mated as the product between the monthly-averaged SPM concen-tration and monthly freshwater discharge; the associated monthly-averaged POC flux (×1012g) at the river mouth is estimated as-suming a constant POC : SPM ratio of 2 %.
Period Mean SPM Mean freshwater SPM flux POC flux
concentration discharge (×1012g) (×1012g)
g m−3 m−3s−1
July 2009 250±50 20 200 13±3 0.3±0.1
August 2009 150±30 13 300 5±2 0.1±0.1
Total 2009 – – 18±3 0.4±0.2
June 2010 320±70 14 500 12±3 0.2±0.1
August 2010 180±40 12 900 6±2 0.1±0.1
September 2010 150±30 12 500 5±2 0.1±0.1
Total 2010 – – 23±3 0.5±0.2
June 2010 350±70 19 970 18±3 0.4±0.2
August 2010 150±30 16 483 6±2 0.1±0.1
September 2010 130±30 12 483 4±2 0.1±0.1
Total 2010 – – 29±3 0.6±0.3
concentrations at the Mackenzie River mouth and also within the river plume.
Regional proxies were identified to estimate SPM con-centrations in the Mackenzie River delta and turbid plume from bio-optical measurements, namely based on the attenu-ation and particulate backscattering coefficients. Our results proved to be consistent with SPM-specific inherent optical properties typical of coastal waters (e.g. Babin et al., 2003b; Neukermans et al., 2012). Moreover, a robust quantification relationship was developed to estimate SPM concentrations from remote sensing reflectance (Rrs)measurements (i.e.
ei-ther from field or atmospherically-corrected ocean colour satellite data). This relationship was established using a semi-analytical approach based on the measured SPM mass-specific inherent optical properties then reproduced using a fully-empirical approach used to relateRrsand SPM
concen-tration field measurements. The results obtained are consis-tent with those previously obtained in sediment-dominated European estuaries (Doxaran et al., 2006). The regional re-lationship established in the Mackenzie River plume was proved to be robust but still potentially affected by variations in CDOM concentrations.
The application of this relationship to ocean colour satel-lite data requires the accurate retrieval of theRrs signal in
visible (around 560 nm) and near-infrared (around 780 nm) spectral bands. It was tested on a selection of cloud-free MODIS-Aqua satellite data recorded in 2009, 2010 and 2011. The near-infrared (two bands) atmospheric correction provided satisfactory results, in terms of Rrs retrieval, in
the moderately turbid waters of the Mackenzie River plume. As a result, the surface SPM concentrations retrieved from MODIS data were within the expected range and allowed analysis of the seasonal to multi-annual dynamics of SPM.
A permanent maximum turbidity zone was identified in the river delta (up to the 10 m isobath), while the offshore exten-sion of the plume (predominantly westwards or northwards) was observed to closely respond to variations in the Macken-zie freshwater discharge.
The location of the maximum turbidity zone in the river delta was confirmed by field measurements which also al-lowed detection of the presence of mineral-rich particles within surface waters of the Beaufort Sea, up to 300 km offshore. Moreover, SPM concentrations at the river mouth were observed to exhibit weak vertical variations along the water column, highlighting the potential of ocean colour re-mote sensing data to provide new estimates of SPM and POC fluxes exported by the Mackenzie River into the Beaufort Sea. The fluxes estimated in this study as part of a prelimi-nary exercise proved to be in the good range but further work (i.e. field and satellite observations) is necessary to quantify the particulate fluxes during the spring (May–June) period.
Additional field measurements are required to assess the robustness of the optical proxies identified in this study, and the validity of the SPM quantification algorithm developed for ocean colour remote sensing. In an optimal scenario, in-situ field data would be acquired coincidentally with satellite imagery (a so called match-up). The next step will be the routine application of the developed quantification algorithm to MODIS and MERIS satellite data recorded since 2002 for operational monitoring of the SPM and POC fluxes delivered by the Mackenzie and other major rivers to the Arctic Ocean.
Acknowledgements. This study was funded by ANR, the French Agence Nationale de la Recherche (Malina project, P. I. M. Babin), by the Centre National d’Etudes Spatiales (CNES-France) through the Provpanache project and by the Groupe Mission MERCATOR/CORIOLIS (France). We acknowledge the NASA GSFC for providing free access to MODIS satellite data and SeaDAS software, Environment Canada, namely the Water Office www.wateroffice.ec.gc.ca, for providing the daily water discharge of the Mackenzie River main tributaries. We finally thank two reviewers for their very useful comments and C. Neil for English review.
Edited by: W. Li
References
Antoine, D., Morel, A., Leymarie, E., Houyou, A., Gentili, B., Vic-tori, S., Buis, J.-P., Buis, N., Meunier, S., Canini, M., Crozel, D., Fougnie, B., and Henry, P.: Underwater radiance distribu-tions measured with miniaturized multispectral radiance cam-eras, J. Atmos. Oceanic Technol., doi:10.1175/JTECH-D-11-00215.1, 2012.
Babin, M., Stramski, D., Ferrari, G. M., Claustre, H., Bricaud, A., Obolensky, G., and Hoepffner, N.: Variations in the light absorp-tion coefficients of phytoplankton, non-algal particles, and dis-solved organic matter in coastal waters around Europe, J. Geo-phys. Res., 108, 3211–3230, doi:10.1029/2001JC000882, 2003a. Babin, M., Morel, A., Fournier-Sicre, V., Fell, F., and Stramski, D.: Light scattering properties of marine particles in coastal and oceanic waters as related to the particle mass concentration, Lim-nol. Oceanogr., 48, 843–859, 2003b.
Babin, M. and Stramski, D.: Variations in the mass-specific absorp-tion coefficient of mineral particles suspended in water, Limnol. Oceanogr., 49, 756–767, 2004.
B´elanger, S., Babin, M., and Larouche, P.: An empirical ocean color algorithm for estimating the contribution of chro-mophoric dissolved organic matter to total light absorption in optically complex waters, J. Geophys. Res., 113, C04027, doi:10.1029/2007JC004436, 2008.
Boss, E. and Pegau, W. S.: Relationship of light scattering at an angle in the backward direction to the backscattering coefficient, Appl. Optics, 40, 5503–5507, 2001.
Boss, E., Pegau, W. S., Gardner, W. D., Zaneveld, J. R. V., Barnard, A. H., Twardowski, M. S., Chang, G. C., and Dickey, T. D.: Spectral particulate attenuation and particulate size distribution in the boundary layer of a continental shelf, J. Geophys. Res., 106, 9509–9516, 2001.
Boss, E., Pegau, W. S., Lee, M., Twardowski, M., Shybanov, E., Ko-rotaev, G., and Baratange, F.: Particulate backscattering ratio at LEO 15 and its use to study particle composition and distribution, J. Geophys. Res., 109, C01014, doi:10.1029/2002JC001514, 2004.
Bricaud, A. and Stramski, D.: Spectral absorption coefficients of living phytoplankton and nonalgal biogenous matter: A compar-ison between the Peru upwelling area and the Sargasso Sea, Lim-nol. Oceanogr., 35, 562–582, 1990.
Carmack, E. C. and Macdonald, W. R.: Oceanography of the Cana-dian Shelf of the Beaufort Sea: A Setting for Marine Life, Arctic, 55, 29–45, 2002.
Copin-Mont´egut, G.: Mati`ere en suspension dans les eaux de mer: r´epartition, composition chimique, origine et e’volution, Labora-toire de Physique et Chimie Marines, Thesis, Universit´e Pierre et Marie Curie, p. 173, 1980.
Doxaran, D., Froidefond, J. M., Lavender, S. J., and Castaing, P.: Spectral signature of highly turbid waters. Application with SPOT data to quantify suspended particulate matter concentra-tions, Remote Sens. Environ., 81, 149–161, 2002.
Doxaran, D., Froidefond, J. M., and Castaing, P.: Remote sensing reflectance of turbid sediment- dominated waters. Reduction of sediment type variations and changing illumination conditions effects using reflectance ratios, Appl. Optics, 42, 2623–2634, 2003.
Doxaran, D., Cherukuru, R. C. N., and Lavender, S. J.: Surface re-flection effects on upwelling radiance field measurements in
tur-bid waters, J. Opt. A-Pure Appl. Op., 6, 690–697, 2004. Doxaran, D., Cherukuru, R. C. N., and Lavender, S. J.: Inherent
and apparent optical properties of turbid estuarine waters: mea-surements, modelling and application to remote sensing, Appl. Optics, 45, 2310–2324, 2006.
Doxaran, D., Froidefond, J. M., Castaing, P., and Babin, M.: Dy-namics of the turbidity maximum zone in a macrotidal estuary (the Gironde, France): Observations from field and MODIS satel-lite data, Estuar. Coast. Shelf Sc., 81, 321–332, 2009.
Emmerton, C. A., Lesack, L. F. W., and Vincent, W. F.: Nutrient and organic matter patterns across the Mackenzie River, estuary and shelf during the seasonal recession of sea-ice, J. Mar. Syst., 74, 741–755, 2008.
Estapa, M. L., Boss, E., Mayer, L. M., and Roesler, C. S.: Role of iron and organic carbon in mass-specific light absorption by particulate matter from Louisiana coastal waters, Limnol. Oceanogr., 57, 97–112, 2012.
Frey, K. E. and McClelland, J. W.: Impacts of permafrost degrada-tion on arctic river biogeochemistry, Hydrol. Proces., 23, 169– 182, 2009.
Gordon, H. R., Brown, O. B., and Jacobs, M. M.: Computed rela-tions between the inherent and apparent optical properties of a flat homogeneous ocean, Appl. Optics, 14, 417–427, 1975. Hedges, J. I., Keil, R. G., and Benner, R.: What happens to
terres-trial organic matter in the ocean?, Org. Biogeochem., 27, 195– 212, 1997.
Hooker, S. B., Morrow, J. H., and Matsuoka, A.: The 1 % and 1 cm perspective in deriving and validating AOP data products, Bio-geosciences Discuss., 9, 9487–9531, doi:10.5194/bgd-9-9487-2012, 2012.
Kishino, M., Takahashi, M., Okami, N., and Ichimura, S.: Estima-tion of the spectral absorpEstima-tion coefficients of phytoplankton in the sea, B. Mar. Sci., 37, 634–642, 1985.
Kou, L., Labrie, D., and Chylek, P.: Refractive indices of water and ice in the 0.65- to 2.5-µm spectral range, Appl. Optics, 32, 3531– 3540, 1993.
Langford, V. S., McKinley, A. J., and Quickenden, T. I.: Tempera-ture dependence of the visible-near-infrared absorption spectrum of liquid water, J. Phys. Chem. A, 105, 8916–8921, 2001. Loisel, H. and Morel, A.: Non-isotropy of the upward-radiance field
in typical coastal case 2 waters, Int. J. Remote Sens., 22, 275– 295, 2001.
Macdonald, R. W., Paton, D. W., Carmack, E. C., and Omstedt, A.: The freshwater budget and under-ice spreading of Mackenzie River water in the Canadian Beaufort Sea based on salinity and
18O /16O measurements in water and ice, J. Geophys. Res., 100,
895–919, 1995.
Macdonald, R. W., Solomon, S. M., Cranston, R. E., Welch, H. E., Yunker, M. B., and Gobeil, C.: A sediment and organic carbon budget for the Canadian Beaufort shelf, Mar. Geol., 144, 255– 273, 1998.