Hazel Denzil Dias1 Pravin Aaron1 Subin Solomen2 Mallikarjunaiah H.S3
CORRESPONDING AUTHOR
1Hazel Denzil Dias
Lily-17, Parmar Garden, Wanowrie, Pune 411040
e-mail: [email protected]
Int J Physiother. Vol 1(2), 58-65, June (2014) ISSN: 2348 - 8336
ABSTRACT
Background: Falls are a major problem in the elderly leading to increased morbidity and mortality in this population. Scores from objective clinical measures of balance have frequently been associated with falls in older adults. The Berg Balance Score (BBS) which is a frequently used scale to test balance impairments in the elderly ,takes time to perform and has been found to have scoring inconsistencies. The purpose was to determine if individual items or a group of BBS items would have better accuracy than the total BBS in classifying community dwelling elderly individuals according to fall history.
Method: 60 community dwelling elderly individuals were chosen based on a history of falls in this cross sectional study. Each BBS item was dichotomized at three points along the scoring scale of 0 – 4: between scores of 1 and 2, 2 and 3, and 3 and 4. Sensitivity (Sn), specificity (Sp), and positive (+LR) and negative (-LR) likelihood ratios were calculated for all items for each scoring dichotomy based on their accuracy in classifying subjects with a history of multiple falls. These findings were compared with the total BBS score where the cut-off score was derived from receiver operating characteristic curve analysis.
Results: On analysing a combination of BBS items, B9 and B11 were found to have the best sensitivity and specificity when considered together. However the area under the curve of these items was 0.799 which did not match that of the total score (AUC= 0.837). A, combination of 4 BBS items - B9 B11 B12 and B13 also had good Sn and Sp but the AUC was 0.815. The combination with the AUC closest to that of the total score was a combination items B11 and B13. (AUC= 0.824). hence these two items can be used as the best predictor of falls with a cut off of 6.5 The ROC curve of the Total Berg balance Scale scores revealed a cut off score of 48.5.
Conclusion: This study showed that combination of items B11 and B13 may be best predictors of falls in the elderly with a cut off of 6.5.
Key Words: Elderly, geriatric, balance, falls, Berg Balance Scale, diagnostic tests, test and measures
1Post graduate student
1Principal and Professor
2Associate Professor
3Assistant Professor
Padmashree Institute of
Physiotherapy, RGUHS Bangalore.
INTRODUCTION
In 2011 5.5% of the entire Indian population was estimated to be individuals above 65 years of age as per the Central Intelligence Agency(CIA) world factbook.1 The problems faced by this segment of the
population are numerous owing to the social and cultural changes that are taking place within the Indian society. The major area of concern is the health of the elderly with multiple medical and psychological problems.2
Falls are one of the major problems in the elderly and are o sidered o e of the Geriatri Gia ts . Recurrent falls are an important cause of morbidity and mortality in the elderly and is the second most common cause of death in India.2 One half to two
thirds of falls o ur i or arou d the patie t’s ho e.3
Falls can be defined as an event which results in a person coming to rest unintentionally at a lower level, other than as a result of dizziness, fainting, sustaining a violent blow, loss of consciousness or other overwhelming external factors4.
Balance impairments is one of the intrinsic risk factors of falls and is a complex process involving the reception and integration of sensory inputs and the planning and execution of movement to achieve a goal requiring upright posture. It plays a key role in differentiating a faller from a non-faller. Balance is defined as the ability to control the centre of gravity over the base of support in a given sensory environment.5
Many standard tests to measure key components of balance are available but perhaps the most commonly used FUNCTIONAL tool to assess balance in these populations is the Berg Balance Scale. The Berg Balance Scale (BBS) was developed by Berg and co-workers 6,7,8 and is used as an objective
measure of static and dynamic balance abilities. The BBS was originally developed for use with elderly populations with stroke in the acute rehabilitation setting. BBS has also shown to be a useful tool on predicting falls in the elderly9, 10 and evaluating
changes in patients undergoing physical therapy.11
One of the limitations of the interpretation of the total BBS score may lie in the scoring of the individual BBS items. Kornetti et al 12 performed a rating scale
analysis of BBS in the elderly and found that the score associated with success on an individual item varies
score across items that indicates success may result in differential weighting of individual BBS items in the total score and may explain some of the variability seen in total BBS scores used as fall screening measures.
Also there has been limited analysis of individual BBS items relative to fall risk in older adults. Kornetti et al12 found that a total BBS score of 45 was associated
with an increased probability of succeeding on items alternating foot on stool (B12), stand on one leg (B14), turn and look behind (B10), and stand with feet together (B7) while Chiu et al 13 through logistic
regression analysis, found picking up an object from the floor and stand on one leg contributed most to the discriminative ability of the BBS in identifying older adults with a history of single falls. They also found that the items (B9) and (B12) are useful for discriminating older adults with multiple falls. Although these individual items have been associated with fall risk, the relevance of individual scores on those items remains unclear. In other words, there may be a critical pivot score on individual items that is most closely related to risk of falls and that, if identified, would allow for simpler, dichotomized scoring of items. Additionally, if these optimal pivot scores could be identified, the clinical usefulness of the BBS as a fall screening tool may be improved. In the clinical setting, where time is at a premium and patient fatigue is a concern, the 15–20 minutes required to complete the BBS may limit its usefulness. This practical concern, in addition to the scoring system variability issues and variable accuracy in detecting fall risk, may limit the utility of the BBS as a screening tool for falls. Identifying a cluster of BBS items and understanding the association of these items to fall history may lead to a more accurate and efficient way for assessing fall risk.
The objective of this study was to determine sensitivity and specificity of each item in classifying individuals according to fall history and also to determine if individual items or a combination of BBS items would have greater overall accuracy than the total BBS, based on their sensitivity and specificity. METHODS
baseline data with no bias. Subjects with auditory / visual impairments, any major neurological or musculoskeletal disorders were excluded from the study.
Procedure: The study was approved by the Institutional ethical committee of Padmashree Institute of Physiotherapy. The study design was a cross sectional study. Subjects were chosen based on a score above 25 on the Mini mental scale and on the inclusion exclusion criteria set. Informed and written consent from each concerned patient was taken. Basic assessment includes self-reported fall history of the past 6 months and demographic data including age, gender, height, weight, body mass index, use of medication and co-morbid conditions, including the use of assistive devices were noted.
The Berg Balance Scale (14 items with a total score of 56) was then used to assess balance of each individual. The total BBS score as well as scores of each item in the BBS was recorded for each individual.
The sensitivity and specificity of each item across three different pivot points was analyzed. The positive and negative likelihood ratios and positive and negative predictive values were also analyzed. Statistical analysis was performed by SPSS (version 7 for i do s; α alue as set at . 5. Des ripti e statistics was used to analyse Mean, SD and Range of demographic variables.
Items with sensitivity above 0.9 and specificity above 0.3 were considered for further investigation. Analysis of individual BBS items was performed to identify the individual BBS items with the highest Sn and Sp relative to classifying participants by fall history (history of multiple falls vs one or no falls). We dichotomized subjects based on scoring of each BBS item using three different pivot points on the scoring scale: between the score of 1 and 2, 2 and 3, and 3 and 4. Sensitivity was analysed at each pivot point as a measure to detect the ability of each item to assess the occurrence of falls including individuals who have fallen. Similarly specificity was analyzed at each pivot point as the ability of each item to exclude individuals who did not fall.
Positive likelihood ratios was analyzed as the ratio of probability that a BBS cut off point would positive if there was a self-reported fall to the probability of cut off of BBS would be positive if there was no self-reported fall. Negative likelihood ratios were analyzed as the ratio of probability that a BBS cut off point would be negative if there was a self-reported fall to the probability of cut off of BBS would be negative if there was no self-reported fall.
ROC curve analysis on the BBS total score using fall status (falls v/s no falls) as the dichotomous outcome to determine the usefulness of the total BBS in classifying people according to fall history was performed. Similar analysis of the best combination items was also performed. Microsoft Excel was used to generate the necessary tables and graphs.
RESULTS:
The study included a total of 60 participants.
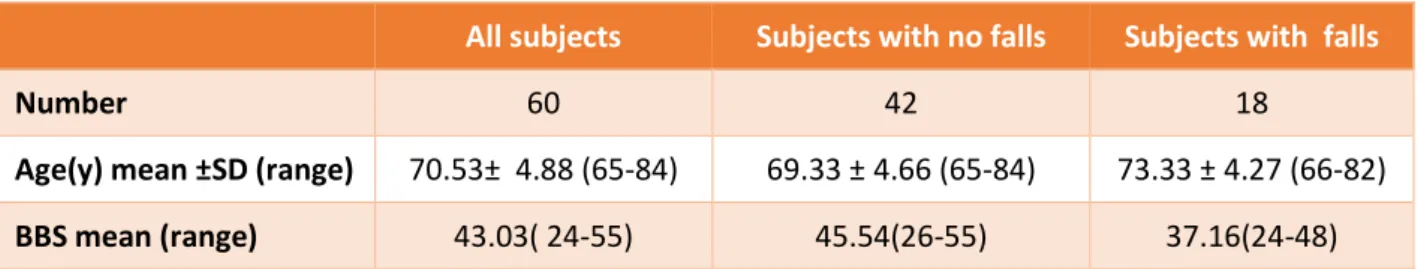
Table 1: Descriptive Statistics for demographic and background variables
All subjects Subjects with no falls Subjects with falls
Number 60 42 18
Age(y) mean ±SD (range) 70.53± 4.88 (65-84) 69.33 ± 4.66 (65-84) 73.33 ± 4.27 (66-82)
BBS mean (range) 43.03( 24-55) 45.54(26-55) 37.16(24-48)
Data are mean ±standard deviation with range in brackets. Since none of the items at pivot points 1&2 and 2&3
met the criteria set for sensitivity and specificity with
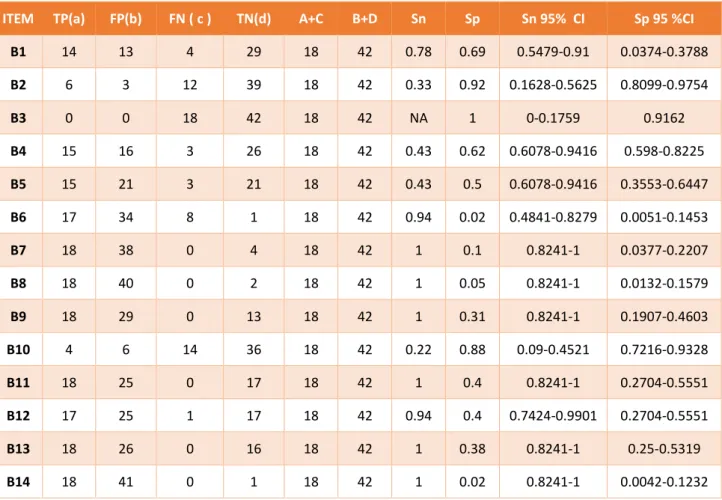
Table 2: The Sensitivity and Specificity of individual BBS items dichotomized at Pivot points 3&4
ITEM TP(a) FP(b) FN ( c ) TN(d) A+C B+D Sn Sp Sn 95% CI Sp 95 %CI
B1 14 13 4 29 18 42 0.78 0.69 0.5479-0.91 0.0374-0.3788
B2 6 3 12 39 18 42 0.33 0.92 0.1628-0.5625 0.8099-0.9754
B3 0 0 18 42 18 42 NA 1 0-0.1759 0.9162
B4 15 16 3 26 18 42 0.43 0.62 0.6078-0.9416 0.598-0.8225
B5 15 21 3 21 18 42 0.43 0.5 0.6078-0.9416 0.3553-0.6447
B6 17 34 8 1 18 42 0.94 0.02 0.4841-0.8279 0.0051-0.1453
B7 18 38 0 4 18 42 1 0.1 0.8241-1 0.0377-0.2207
B8 18 40 0 2 18 42 1 0.05 0.8241-1 0.0132-0.1579
B9 18 29 0 13 18 42 1 0.31 0.8241-1 0.1907-0.4603
B10 4 6 14 36 18 42 0.22 0.88 0.09-0.4521 0.7216-0.9328
B11 18 25 0 17 18 42 1 0.4 0.8241-1 0.2704-0.5551
B12 17 25 1 17 18 42 0.94 0.4 0.7424-0.9901 0.2704-0.5551
B13 18 26 0 16 18 42 1 0.38 0.8241-1 0.25-0.5319
B14 18 41 0 1 18 42 1 0.02 0.8241-1 0.0042-0.1232
Table 2 shows the sensitivity and specificity of individual BBS Items Dichotomized at pivot points 3&4. The items that yielded a sensitivity and
specificity above 0.9 and 0.3 respectively when seen together were, B9, B11, B12 and B13.
Table 3: The sensitivity and specificity of combination of BBS Items dichotomized at pivot points 3 & 4
ITEM TP (A) FP (B) FN (C) TN (D) (A+C) (B+D) Sn Sp Sn 95 %CI Sp 95 %CI
B11 + B9 18 20 0 22 18 42 1 0.52 0.8241-1 0.3772-0.66
B11 + B12 17 23 1 19 18 42 0.94 0.45 0.7424-0.9901 0.3122-0.60
B11+ B13 18 21 0 21 18 42 1 0.5 0.8241-1 0.3553-0.64
B9+ B11+ B12+B13 17 16 1 26 18 42 0.94 0.62 0.7424-0.9901 0.4681-0.75
Table 3 shows the sensitivity and specificity of combination of BBS Items dichotomized at pivot points 3 & 4. B11+B9 showed a sensitivity of 1 and specificity 0.52. B11+ B12 showed a sensitivity of 0.94
Table 4: The Area under the curve, standard error, level of significance and confidence interval for combination of BBS items dichotomized at pivot points 3&4.
Variable AUC SE p value Confidence interval
B9+ B11 0.799 0.056 0.001 0.689-0.909
B11+ B12 0.808 0.057 0.001 0.696-0.920
B11+B13 0.824 0.053 0.001 0.719-0.929
B9+ B11+ B12+ B13 0.815 0.55 0.001 0.707-0.923
Total score 0.837 0.51 0.001 0.736-0.938
Table 4 shows the Area under the curve, standard error, level of significance and confidence interval for combination of BBS items dichotomized at pivot points 3&4. The Area under the curve for the total score was found to be 0.837 with a standard error of 0.51 and 0.001 level of significance. The confidence
interval was found to be 0.736-0.938. The Area under the curve closest to that of the total score was found among B11+B13 combinations with a value of 0.824 and standard error 0.51. The level of significance was 0.001 with a confidence interval of 0.736-0.938.
Table 5: The likelihood ratios for 4 BBS items and their combinations at Dichotomized Pivot points 3 & 4
Item Positive LR Negative LR
B9 1.448(1.183-1.773) 0
B11 1.680(0.309-2.156) 0
B12 1.587(1.207-2.086) 0.137(0.02-0.955)
B13 1.615(1.274-2.048) 0
B11 + B9 2.1(1.529-2.884) 0
B11 + B12 1.725(1.282-2.321) 0.123(0.018-0.849)
B11+ B13 2(1.478-2.706) 0
B9+ B11+ B12+B13 2.48(1.659-3.704) 0.090(0.013-0.612) Table 5 shows the likelihood ratios for 4 BBS items
and various combinations at Dichotomized Pivot points 3 & 4. The positive likelihood ratios for the 4 items ranged from 1.448-0.680 and the negative
likelihood ratios ranged from 0- 0.137. The positive likelihood ratios for the combinations ranged from 1.725- 2.48.
Figure 1 shows the ROC curve of total Berg balance “ ale s ores ith fall status as out o e faller’s /s non fallers). The arrow indicates the optimal single cut-off score of 48.5 with a sensitivity of 1 and
specificity of 0.48 indicating that individuals with a score less than equal to 48 can be classified as fallers while individuals with a score more than equal to 49 can be classified as non-fallers.
Figure 2: The ROC curve of B11 + B13 combination with fall status as out o e faller’s /s o fallers
Figure 2 shows the ROC curve of B11 + B13 o i atio ith fall status as out o e faller’s /s non fallers). The arrow indicates the optimal single cutoff score of 6.5 with a sensitivity of 1 and
specificity of 0.48 indicating that individuals with a score less than equal to 6 can be classified as fallers while individuals with a score more than equal to 7 can be classified as non-fallers.
DISCUSSION
In the present study an attempt has been made to analyse individual items of the BBS in elderly individuals and to find the association with fall history using a dichotomized scoring system in order to eliminate some of the ambiguities of the scoring system.
30 %( 18 out of 60 individuals) of the population in the present study had a history of falls. This is in contrast to 17%13, 35% 10 and 50% 14 of fallers in other
studies of community dwelling elderly individuals. The sample was relatively low functioning with a mean BBS score of 43.03, however more than half of the population was able to ambulate independently in the community without the need for an assistive device.
Various authors have published and discussed a number of articles stating that the BBS can be used as a valid and reliable tool to predict falls in other populations1516,17,18 However in the elderly, several
studies of fall risk using the BBS based on defined cut off scores have demonstrated mixed results. Muir et al, using dichotomous scoring based on the standard cut off of 45 and other higher scores derived from
Chiu et al found B14, B9 and B12 to be the best predictors of falls19 while Kornetti found B11 B13, B10
and B6 to be closely related to fall history. In 1996 Chou et al found that the first 7 items of the BBS were sufficient to predict falls in stroke subjects. 20
However Alzayer et al, in their study proved that B11, B12, B13, B14 were the items on BBS that could predict falls in stroke patients.21
In the present study an attempt was made to find a critical pivot score on individual items that is most closely related to risk of falls and when identified would allow for simpler dichotomized scoring of items. This study in accordance with that performed by Alzayer et al found that a dichotomized scoring system using the pivot points between 3 & 4 yielded the highest sensitivity and specificity compared to other pivot points 21. This may be partly due to the
In items B11 and B12 the different between the scoring of 3 to that of 4 is a matter of performing the task faster. B9 deals with the ability to perform the task independently, while in B13 the individual has to hold a posture for a period of time. Hence the efficacy of these items at these scoring pivot points in accurately classifying participants according to fall history management may be due in part to these clear scoring definitions.
In contrast to earlier studies 22, the present study
indicates that B11 was the item with the single highest sensitivity and specificity in identifying those with a history of multiple falls. The difference for this variation may be due to the independently ambulant characteristic of majority of the subjects in the present study.
On analyzing a combination of BBS items B9 and B11 were found to have the best sensitivity and specificity when considered together. However the area under the curve of these items was 0.799 which did not match that of the total score (AUC=0.837). A combination of 4 BBS items - B9, B11, B12 and B13 also had good Sn and Sp but the AUC was 0.815. The combination with the AUC closest to that of the total score was a combination items B11 and B13. (AUC= 0.824). Hence these two items were considered as the best predictor of falls.
The ROC curve of the Total Berg balance Scale scores ith fall status as out o e faller’s /s o fallers revealed a cut off score of 48.5 to distinguish fallers from non-fallers. This is in contrast to older studies wherein cut-offs of 45 and 40 were proven to help distinguish fallers from non-fallers. A reason for the difference in these cut off may be non- uniformity in the scoring system across the 14 items. ROC curve analysis of combination of Items B11 and B13 revealed a cut off score of 6.5 out of 8 to help differentiate fallers from non-fallers. This minimization will help save time in analysis of risk fall in elderly individuals and also help overcome the hurdle experienced by the lack of consistency in the cut-off of the total score. Since the balance assessment in elderly has now been limited to 2 items (based upon best ability to predict falls) the ambiguities that arose in the total score cut off can be overcome.
LIMITATIONS AND FUTURE SCOPE OF STUDY
Some of the limitations in this study indicate that the results should be interpreted with caution. The sample size chosen was relatively small as it was a preliminary study. The Sample was assessed under varying environmental conditions which could lead to
variation in the analysis. Also the sample was relatively low functioning which could lead to a bias in interpreting the results. Since the fall history was olle ted ased o su je ts’ re all of the past six months there could be an error in data collection. It is suggested that similar studies be performed with institutionalized elderly individuals. Various subsets of the BB“ a e at hed to the group’s fu tio al level to more accurately identify fall risk and prospective studies can be performed to test the interpretation of this present study.
CONCLUSION
The objective of this study was to determine if individual items or a combination of BBS items would have greater overall accuracy than the total BBS, based on their sensitivity and specificity. Individual item analysis showed that using selected BBS items may be as useful and accurate in classifying people based on fall history as using the total BBS score which would improve efficiency. A dichotomous approach to scoring may eliminate some of the scoring variability and ambiguity and seems to hold promise as a system that could be used to measure fall risk but these exploratory results need to be investigated prospectively.
LIST OF REFERENCES
1. Indian Geriatric Demographics available from url: https://www.cia.gov/library/publications/the-world-factbook/geos/in.html
2. B Krishnaswamy, Gnanasambandam U, Falls in older people. National/regional review available from url: www.who.int/ageing/projects/ SEARO.pdf.
3. Alan Milburn. National service framework for older people available from url: http://www.doh.gov.uk/nsf/olderpeople.html 4. Tinetti ME, Speechley M, Ginter SF. Risk factors
for falls among elderly persons living in the community. N Engl J Med. 1988;319(26):1701– 1707
5. Umphred DA, Neurological rehabilitation , 5thed,
2007
6. Berg KO, Wood-Dauphinee S, Williams JI, et al. Measuring balance in the elderly: Preliminary development of an instrument. Physiother Can.1989; 41: 304 –311.
8. Berg KO, Wood-Dauphinee SL, Williams JI, et al. Measuring balance in the elderly: Validation of an instrument. Can J Public Health. 1992;83(2):S7– S11.
9. Berg K, Wood-Dauphinee S, Williams JI. The balance scale: Reliability assessment with elderly residents and patients with an acute stroke.Scand J Rehabil Med. 1995;27(1):27–36. 10. BogleThorbahn LD, Newton RA. Use of the Berg
balance test to predict falls in elderly persons. PhysTher. 1996;76(6):576 –583
11. Harada N, Chiu V, Fowler E, Lee M and Reuben DB Physical therapy to improve functioning of older people in residential care facilities. Physical Therapy. 1995; 75(9): 830-839.
12. Kornetti DL, Fritz SL, Chiu YP, et al. Rating scale analysis of the Berg balance scale. Arch Phys Med Rehabil. 2004;85(7):1128 –1135.
13. Muir SW, Berg K, Chesworth B, et al. Use of the Berg balance scale for predicting multiple falls in community-dwelling elderly people: A prospective study. Phys Ther.2008;88(4):449 – 459.
14. Shumway-Cook A, Baldwin M, Polissar NL, et al. Predicting the probability for falls in community-dwelling older adults. Phys Ther.1997;77(8):812– 819.
15. Belgen B, Beninato M, Sullivan PE, et al. The association of balance capacity and falls self-efficacy with history of falling in
community-dwelling people with chronic stroke. ArchPhys Med Rehabil.2006;87(4): 554 –561.
16. Mackintosh SF, Hill KD, Dodd KJ, et al. Balance score and a history of falls in hospital predict recurrent falls in the 6 months following stroke rehabilitation. Arch Phys Med Rehabil.2006; 87(12):1583–1589.
17. Ashburn A, Hyndman D, Pickering R, et al. Predicting people with stroke at risk of falls. Age Ageing.2008;37(3): 270 –276.
18. Hyndman D, Ashburn A. People with stroke living in the community: attention deficits, balance, ADL ability and falls. DisabilRehabil. 2003; 25(15):817– 822.
19. Chiu AY, Au-Yeung SS, Lo SK. A comparison of four functional tests in discriminating fallers from non-fallers in older people. Disabil Rehabil. 2003; 25(7):45–50.
20. Chou CY, Chien CW, Hsueh IP, et al. Developing a short form of the Berg balance scale for people with stroke. Phys Ther.2006;86(2):195–204. 21. Alzayer L, Beninato M. Accuracy of individual
Berg Balance Scale Items compared with the total berg score for classifying people with chronic stroke according to fall history. JNPT. 2009;33(3): 136–143.
22. Vellas BJ, Wayne SJ, Romero L, et al. One-leg balance is an important predictor of injurious falls in older persons. J Am Geriatr Soc.1997;45(6): 735–738.