American Journal of Engineering Research (AJER)
e-ISSN: 2320-0847 p-ISSN : 2320-0936
Volume-4, Issue-5, pp-154-162
www.ajer.org
Research Paper Open Access
Assessment of Human Exposure to Magnetic Field from
Overhead High Voltage Transmission Lines in a City in South
Western Nigeria
Ponnle Akinlolu, Adedeji Kazeem
Department of Electrical and Electronics Engineering, Federal University of Technology, Akure, Nigeria.
ABSTRACT:
The increase in electricity consumption, population, and land use has now forced high voltage transmission lines (HVTLs) either to pass or be installed around or through urban cities. This increases the level of human exposure to electromagnetic field radiation as this field produced around the HVTLs extends outwards covering some distance. This may cause a number of health hazards. It is even dangerous to a human who touch any metallic object in proximity of the HVTL, as it may have an appreciable voltage induced on it due to inductive, capacitive or resistive interference from the line. This paper evaluates the magnetic field produced at mid-span by a 132kV, and a 330kV, 50Hz adjacent HVTLs with horizontal and vertical configuration in Akure, a city in South Western Nigeria using analytical method from electromagnetic field theory. This is then compared to the recommended standard limit of public exposure to magnetic field. The results of the computation showed that currently, the general public exposure to the magnetic field along the HVTLs is safe. However, right of way (ROW) along the power lines is being violated as buildings and work places exist within the ROW.Keywords
-
health hazard, high voltage transmission lines, limit of public exposure, magnetic flux density, right of way.I.
INTRODUCTION
Power and Energy systems have enjoyed tremendous growth in many countries for the past few years. For continuous power supply to both rural and urban areas, electric energy has to be transported over a long distance (several kilometers) by a transmission line. The voltage carried by this line has to be high enough to reduce losses along the line of transmission. Due to increase in population and expansion of human activities all over the world, it has been realized that for high voltage transmission lines (HVTLs) that were initially installed far away from cities, human occupation and activities have encroached into the areas occupied by these lines. Even in some cases, houses, work places and other structures now share with these lines.
The current flowing through an energized conductor of a transmission line produces a magnetic field at
right angle to the direction of the current according to Fleming’s Right Hand rule, which extends into space as shown in Fig. 1. Since the currents flowing in the phase conductors of the transmission lines are alternating at 1200 to one another, then for a transmission line operating at a frequency of 50Hz, the magnetic field changes direction at a frequency of 50 cycles per second. The intensity of the magnetic field radiated by the HVTL also depends on strength (magnitude) of the current in the phase conductors of the transmission line [1-4].
Figure 1: Magnetic field produced by a three-phase transmission line (not to scale).
Magnetic Field due to Conductor C Magnetic Field due to Conductor B Magnetic Field due
to Conductor A
BA
BB
BC
The magnetic fields produced by HVTLs are in the extremely low frequency (ELF) range of the electromagnetic spectrum, and are therefore treated as quasi static fields [5]. The energy produced by these fields though very small, can cause serious health effects if concentrated on the human body for a long period of time [6-12]. The extremely low frequency (50-60Hz) electromagnetic field which comes under non-ionizing radiation can still cause health effects [13, 14]. Long-time exposure to this magnetic field has some biological effect on humans if it exceeds the threshold value stipulated by the European standard 2004/40/EC (EU Directive 2004/40/EC) [15]. More also, because this field induces voltage on any metallic object parallel or at an angle to the transmission line in its right of way, it can also cause shock hazard to humans touching this metallic object especially in the case of ground fault [16, 17]. Possible adverse effects of electromagnetic fields originating from high-voltage power lines have given rise to discussions in both scientific and public communities for years [7, 18]. The research work in [19] reported that extremely low electromagnetic fields are possibly carcinogenic, based on epidemiological results for childhood leukemia.
Technical specification and guidelines have been issued by organizations over the years in determining the permissible exposure limit of people to magnetic field [20-29]. The International Commission on Non-Ionizing Radiation Protection (ICNIRP) [22, 29], and the Council for European Union [15] recommended permissible limit to exposure of electric and magnetic field. This limit is shown in Table 1.
Table1: ICNIRP (1998, 2010) and Council for European Union (2004) exposure guideline
Power line operating frequency 50Hz
Electric Field (V/m) Magnetic Field (μT)
Public exposure limits 5000 100
Occupational exposure limits 10000 500
More also, the National Health and Medical Research Council (1989) issued a guideline on the occupational and general public exposure limit to electromagnetic field at 50/60 Hz frequency [20]. This was done under the following headings:
(i) Occupational Exposure Limit: Continuous exposure to general public during the working day should be limited to magnetic flux density not greater than 0.5mT (rms). Short-term occupational whole body exposure for up to two hours per workday should not exceed a magnetic flux density of 5mT [20].
(ii) General Public Limit: Members of the general public should not be exposed on a continuous basis to unperturbed magnetic flux density exceeding 0.1mT (rms). This restriction applies to areas in which members of the general public might reasonably be expected to spend a substantial part of the day. Exposures to magnetic flux densities between 0.1 and 1.0mT (rms) should be limited to a few hours per day. When necessary, exposures to magnetic flux density in excess of 1mT should be limited to a few minutes per day [20].
Different research works in [6, 12, 13, 18-20, 22, 29, 30-33] have been carried out to evaluate the effect of electromagnetic field radiation from nearby high voltage transmission lines and other sources of magnetic fields on humans. Similarly, a number of well-established effects of exposure to low-frequency EMFs on the nervous system in [22, 29] include the direct stimulation of nerve and muscle tissue, and the induction of retinal phosphenes. It was reported in [31, 32] that exposure to electromagnetic field at power frequency (50/60Hz) may increase the risk of many diseases, due to the current induced in the human tissue. Also, research works in [7-9] pointed out that magneto-hydrodynamic effect from magnetic field forces on moving charged particles at very high static field levels can alter cardiac function and blood flow, and can cause vertigo. More also, nerve and muscle excitation can be induced by magnetic fields as well as through contact currents. Furthermore, the International Agency for Research on Cancers (IARC) (2002) pointed out that 50Hz or 60Hz magnetic fields have been classified in the list of possible carcinogenic agents [25].
This is because either the land is cheap or free for usage most especially mechanic shops and saw mills. A typical example of this is shown in Fig. 2, where HVTLs pass over residential houses and work places in an area in Akure city, Nigeria.
Figure 2: Residents and various work places directly (a) under an HVTL and (b) under/in proximity of 132kV and 330kV HVTLs in Akure, Nigeria.
This situation is getting out of hand as more and more houses and workshops are being continuously built close to and share corridor with transmission lines which raise the fear of increasing public exposure to the magnetic field produced by the line current of these transmission lines. Aliyu et al (2012) performed measurement of magnetic flux densities below Jos - Gombe 330kV and 132kV lines in Central/Eastern Nigeria. They found that even though the field values were all below the standard limit values, many people did not obey the regulation of TCN, as many houses have been built to share corridor with the transmission lines [35].
In this work, we focused and evaluated the magnetic field produced by a 132kV, and a 330kV, 50Hz adjacent HVTLs with horizontal and vertical configuration in Akure, a city in South Western Nigeria, using analytical method from electromagnetic field theory and compared values obtained with the ICNIRP standard limit of public exposure to magnetic field. The two HVTLs run from Oshogbo transmission station (TS). The 132kV line terminates at Akure 132/33kV TS, while the 330kV line terminates at Benin 330/132kV TS [36-40]. The 330kV line is for the main transmission which constitutes the national grid, while the 132kV line is for sub-transmission, and are both maintained by Transmission Company of Nigeria (TCN). The field at mid-span between two towers for minimum ground clearance was evaluated.
II.
MATERIALS
AND
METHODS
The computation of the mid-span magnetic field distribution in the vertical plane with minimum ground clearance was performed for the region where the two power lines are close to each other in the city.
2.1 Power Line Configuration
Fig. 3 shows the geometrical configurations of the power lines. The phase conductors are labeled A, B, and C. ah is the separation between the phase conductors of the horizontal geometry while the vertical
separation between the phase conductors of the vertical geometry is av. Ht is the distance of the lowest conductor
from the ground at the tower. This is different from the ground clearance at mid-span between two towers. Though the towers of the two lines are staggered (not co-located) in order to reduce the combined magnetic field strength underneath the lines, but for this work, we assumed their mid-span are in the same region for worst case scenario.
Figure 3: Schematic of the configuration of the power lines.
C
A B
Ht
ah
C A
B
Ht
av av
W
2.2 Model for Computation
The calculation of the magnetic field is reduced into a simple plane problem because the situation is exactly the same on every section of the lines. Two-dimensional analysis is sufficiently accurate using Biot-Savart Law, image method and superposition principle [4, 5, 41-46]. For the computations, some assumptions and simplifications were made. All conductors constituting the lines are assumed to be straight, horizontal, and parallel to one another. The medium is assumed to be linear. The ground is assumed to be flat, free of irregularities, conductive but magnetically transparent. Typical values of relative permeability of various soils and rocks ranges from 1.00001 to 1.136 except rocks in iron-mining areas [47]. The presence of towers, utility poles, buildings, vegetation and any other object in the area is neglected. Since the power line frequency is 50Hz, the magnetic field is treated as a quasi-static field [5, 41-43].
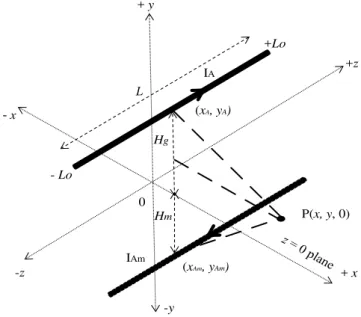
Considering a phase conductor belonging to one of the power lines carrying current IA which passes through point (xA, yA) on the z = 0 plane with ground clearance Hg as shown in Fig. 4, there is an image
conductor at a depth Hm below the ground passing through point (xAm, yAm) on the z = 0 plane. The vertical plane
is chosen to lie on (x, y, 0) i.e. z = 0 plane on which the point of observation lies. Height is represented with y-axis.
Figure 4: A current-carrying phase conductor above the earth plane.
If L is the length of the conductor, and Lo is half the conductor length, then at a point of observation P(x, y) on the z = 0 plane, the horizontal component of the magnetic flux density due to the phase conductor with current IA is:
Am Am mA A A gA Ax d y y B d y y B
B , (1)
and the vertical component of the magnetic flux density due to the phase conductor is:
Am Am mA A A gA Ay d x x B d x x B
B , (2)
where
2 2
2 A o A
o A o gA d L d L I B
, (3)
2 2
2 Am o Am
o A o mA d L d L I B
, (4)
2 2
A A
A y y x x
d , (5)
and 2 2
Am Am
Am y y x x
d (6)
In Fig. 4, yA = Hg, xA = xAm, and yAm = -(Hg+ δ) where δ is the earth’s skin depth (depth of penetration), and is
expressed as:
+z
0 + y
Hg
P(x, y, 0)
-z
-y -Lo
+Lo
+ x IA
IAm Hm
(xA, yA)
f o
(7)
ρ is the resistivity of the earth and f is the frequency of the source current. Typical values of earth resistivity
ranges from 10 to 1000 Ωm, therefore the skin depth is in hundred of meters below the ground.
Similar expressions can be derived for all the other phase conductors in the two circuits taking into consideration the distances between the conductors and the point of observation. Assuming the steady state current in the three conductors of a line varies as sinωt, with a phase angle φ to one another, then at point P on the plane, the total horizontal and total vertical component of the magnetic flux density BRx and BRy respectively
are expressed as:
t k t k B t k t k B Ry Rx cos sin cos sin 4 3 2 1 (8)
where for phase arrangement A1B1C1 - A2B2C2,
A y A y C y C y
y C y C y A y A y B y B x C x C x A x A x C x C x A x A x B x B B B B B k B B B B B B k B B B B k B B B B B B k 2 1 2 1 4 2 1 2 1 2 1 3 2 1 2 1 2 2 1 2 1 2 1 1 sin cos sin cos (9)
The magnitudes of the resultant horizontal and vertical components respectively are:
2 4 2 3 2 2 2 1 k k B k k B Ry Rx (10)
The magnitude of the resultant flux density, BR is:
2 2
Ry Rx
R B B
B (11)
In the computation, the resultant magnetic flux density distribution in the vertical plane below the power lines was obtained for a balanced system in which the current in the conductors are at a phase angle φ of 120o to one another. We considered the installed capacity at Akure TS for the 132kV line [36, 40], and power flow from Oshogbo TS to Benin TS for the 330kV line [38]. While the two lines carry different amount of current, the phase conductors in each line are assumed to carry the same amount of current. The mid-span ground clearance Hg of 8m was used to allow for maximum sag and expansion at 750C. Earth’s resistivity of 100
Ωm was used. At each point, horizontal component, vertical component, and resultant magnetic flux density were computed. MATLAB software was used for the computation and result presentation.
III.
RESULTS
AND
DISCUSSION
3.1 Field at Ground Level
Fig. 5 shows the lateral profiles of the computed unperturbed magnetic flux densities at ground level below the power lines for the vertical component, horizontal component, and the resultant flux density. It can be observed that the flux densities are higher below the 132kV line than the 330kV line. This is expected since the 330kV lines which make up the national grid, transmits power at higher voltage and lesser current. The 132kV line services Akure, Ekiti and Owo load regions, with its injection TS at Oshogbo, Nigeria. In the figure, the vertical component has higher values than the horizontal component for some regions below the lines.
Figure 5: Lateral profiles of the computed magnetic flux densities at ground level below the power lines.
-40 -30 -20 -10 0 10 20 30 40
2 4 6 8 10 12
Distance across the wires [m]
Fi el d D en si ty [u T]
Lateral Field Profiles at Ground Level (Transposed 2 & 3)
3.2 Field Horizontal Component
Fig. 6 shows the lateral flux density profile of the horizontal component of the magnetic field below the power lines at heights of 1m and 4m above the ground.
Figure 6: Lateral flux density profile of the horizontal component of the magnetic field below the power lines at two different heights from the ground.
The height of 1m is the recommended standard height of measurement of magnetic fields from AC power lines [48], in which most human activities lie within. The height of 4m is also chosen to correspond to the level of human activities that are up to one-storey building from the ground. As expected, the maximum values of the flux density at height of 4m are higher than the values at height of 1m, and the values occur directly below the
conductors. Nevertheless, from the figure, the maximum value at height of 4m does not exceed 25μT. This is
below the standard limit of public exposure.
3.3 Field Vertical Component
Fig. 7 shows the lateral flux density profile of the vertical component of the magnetic field below the power lines at heights of 1m and 4m above the ground.
Figure 7: Lateral flux density profile of the vertical component of the magnetic field below the power lines at two different heights from the ground.
In this figure also, the maximum values of the flux density at height of 4m are higher than the values at height of
1m. The maximum value at height of 4m does not exceed 23μT which is below the standard limit of public
exposure. A careful observation of Fig. 6 and Fig. 7 reveals that for some regions below the lines, at a height of 1m above the ground, the maximum values of the vertical component are higher than the maximum values of the horizontal component; while at a height of 4m above the ground, the maximum values of the vertical component are less than the maximum values of the horizontal component.
-40 -30 -20 -10 0 10 20 30 40
5 10 15 20
Distance across the wires [m]
F
ie
ld
D
e
n
si
ty
[u
T
]
Lateral Horizontal Field Profiles (Transposed 2 & 3)
h = 1m h = 4m
-40 -30 -20 -10 0 10 20 30 40
2 4 6 8 10 12 14 16 18 20 22
Distance across the wires [m]
F
ie
ld
D
e
n
si
ty
[u
T
]
Lateral Vertical Field Profiles (Transposed 2 & 3)
3.4 Resultant Field
Fig. 8 shows the lateral resultant flux density profile of the magnetic field below the power lines at heights of 1m and 4m above the ground.
Figure 8: Lateral resultant flux density profile of the magnetic field below the power lines at two different heights above the ground.
Maximum value obtained at a height of 1m is 16μT, and the maximum value obtained at a height of 4m is 27.5μT. These values are below the ICNIRP standard limit of general public exposure of 100μT. The maximum
value at height of 1m corresponds to about 16% of the standard limit of exposure, and the maximum value at height of 4m corresponds to about 28% of the standard limit of exposure. This shows that currently, there is no risk for the general public. Aliyu et al (2012) also arrived at the same conclusion from their measurement of Jos - Gombe lines [35].
However, physical inspection in this region where the magnetic fields due to the HVTLs was computed revealed that the regulation of TCN ROW for HVTLs has been violated, as there are people having their work places, directly below the power lines as well as erecting residential buildings that encroached into the ROW of the power lines.
IV.
CONCLUSION
The magnitude of the magnetic flux densities below 132kV and 330kV power lines in Akure, Nigeria have been computed and analysed for general public exposure using the ICNIRP (1998 & 2010) reference levels for general public exposure limit. The results of the computations showed that currently, the general public exposure to the magnetic field along the HVTLs is safe. The maximum computed value at a height of 1m and 4m is about 16% and 28% of the ICNIRP reference level respectively.
However, right of ways (ROWs) along the power lines are being violated as buildings exist less than 15m and 25m away from the 132kV and 330kV lines respectively; and work places for various occupations and makeshift structures exist directly below the power lines. There is need by regulatory/law enforcement agents to ensure that the ROWs along the power lines are observed by the general public because athermal effects of long term electromagnetic pollution may lead to serious health hazards.
R
EFERENCES[1] A. Geri, A. Locatelli, and G.M. Veca, “Magnetic Field generated by Power Lines”, IEEE Transactions on Magnetics, Vol. 31, No. 3, 1995, pp. 1508-1511.
[2] G. Filippopoulous, and D. Tsanakas, “Analytical Calculation of the Magnetic Field produced by Electric Power Lines”, IEEE
Transactions on Power Delivery, Vol. 20, No. 2, 2005, pp. 1474-1482.
[3] S.A. Mahmoud, M.A. Abd-allah, and K.G. Ahmed, “Magnetic Fields under Parallel Transmission Lines”, 8th Middle East Power
Systems Conference (MECON 2001), Helwan, Egypt, 2001, pp. 885-890.
[4] W.T. Kaune and L.E. Zaffanela, “Analysis of Magnetic Fields produced far from Electric Power Lines”, IEEE Transactions on Power Delivery, Vol. 7, No. 4, October 1992, pp. 2082-2091.
[5] R.G. Olsen and P.S. Wong, “Characteristics of Low Frequency Electric and Magnetic Fields in the Vicinity of Electric Power
Lines”, IEEE Transactions on Power Delivery, Vol. 7, Oct. 1992, pp. 2046-2053.
[6] G.A. Florea, A. Dinca, and A. Gal A. “An Original Approach to the Biological Impact of the Low Frequency Electromagnetic
-40 -30 -20 -10 0 10 20 30 40
5 10 15 20 25
Distance across the wires [m]
F
ie
ld
D
e
n
si
ty
[u
T
]
Lateral Resultant Field Profiles (Transposed 2 & 3)
Fields and Proofed Means of Mitigations”, IEEE Bucharest Power Tech. Conference, Romania, 2009, pp.1-8. [7] J.P. Reilly, “Applied Bioelectricity: from Electrical Stimulation to Electropathology”, Springer, New York, 1998.
[8] Subcommittee of the International Committee on Electromagnetic Safety (SCC28), “Draft Standard for Safety Levels With
Respect to Human Exposure to Electric and Magnetic Fields, 0 - 3 kHz”, Draft 5 of IEEE P1555, March 13, 2001.
[9] J. P. Reilly and K. C. Jaffa, “The IEEE Draft Electric and Magnetic Field Exposures Standards for the Public and Workers, 0 to 3
kHz”, IEEE, 2001, pp. 186-194.
[10] C.R. Paul, “Analysis of Multiconductor Transmission Lines”, Wiley and Son Inc. 1994, USA.
[11] J.B. Faria, and M.G. Neves, “Accurate Evaluation of Indoor Tripex Cable Capacitance Taking Conductor Proximity Effects into
Account”,IEEE Transaction on Power Delivery, Vol. 21, No. 3, 2006, pp. 1238-1244.
[12] R.A. Voitovich, and K.P. Kadomskay, “Influence of the Design Parameters of High Voltage Underwater Power Cables on the
Electromagnetic Field Intensity in an Aqueous Medium”, Electrical Technology, No. 2, 1997, pp. 11-21.
[13] G. Kulkami, and W.Z. Gandhare, “Proximity Effects of High Voltage Transmission Lines on Humans”, ACEEE International Journal on Electrical and Power Engineering, Vol. 03, No. 01, 2012, pp. 28-32.
[14] H. Ahmed, M. Wael, and A. Ehab, “Effects of Electromagnetic Field from Power Line on Metallic Objects and Human Bodies”. International Journal of Electromagnetics and Applications, Vol. 2, No. 6, 2012, pp. 151-158.
[15] Directive 2004/40/EC of the European Parliament and of the Council, “The Minimum Health and Safety Requirements
Regarding the Exposure of Workers to the Risks Arising from Physical Agents (Electromagnetic Fields)” Official Journal of the
European Union, L184, Vol. 30, No. 4, 2004, pp.1-9.
[16] J.P. Nelson, “Power Systems in Close Proximity to Pipelines”, IEEE Transactions on Industry Applications, Vol. 1A-22, No. 3, May/June 1986, pp. 435-441.
[17] K.B. Adedeji, A.A. Ponnle, B.T. Abe and A.A. Jimoh, “Analysis of the Induced Voltage on Buried Pipeline in the Vicinity of
High AC Voltage Overhead Transmission Lines”, Proceedings of the 23rd Southern African Universities Power Engineering
Conference (SAUPEC), Johannesburg, 2015, pp. 7-12.
[18] M. Peter, “Effects on the Human Body and Assessment Methods of Exposure to Electro-Magnetic-Fields Caused by Spot
Welding”, Proceedings of the 4th International Seminar on Advances in Resistance Welding, 15th November, 2006, Wels, pp.
1-17.
[19] E. Chlor, “Electromagnetic Fields in Chlor-Alkali Production Health Effects and Regulation”, Focus on Chlorine Science, Issue 5, 2012, pp. 1-4.
[20] National Health and Medical Research Council, “Interim Guidelines on Limits of Exposure to 50/60 Hz Electric and Magnetic
Fields” Radiation Health Series, No. 30, 1989, pp. 1-35.
[21] National Radiological Protection Board, “Restrictions on Human Exposure to Static and Time Varying Electromagnetic Fields
and Radiation: Scientific Basis and Recommendation for Implementation of the Board’s Statement”, Doc. NRPB, Vol. 4, 1993,
pp. 8–69.
[22] ICNIRP, “Guidelines for Limiting Exposure to Time-varying Electric, Magnetic, and Electromagnetic Fields (up to 300 GHz),” Health Physics, Vol. 74, 1998, pp. 494–522.
[23] J.M. Osepchuk, and R.C. Petersen, “Safety Standards for Exposure to RF Electromagnetic Fields”, IEEE, June 2001, pp. 57-69. [24] IEEE Std C95.6, “IEEE Standard for Safety Levels with Respect to Human Exposure to Electromagnetic Fields, 0 –3 kHz”,
2002, pp. 1-43.
[25] International Agency for Research on Cancers (IARC), “Static and Extremely Low-Frequency (ELF) Electric and Magnetic
Fields”, IARC Monographs on the Evaluation of Carcinographic Risks to Humans, Vol. 80, 2002, Lyon, France.
[26] Electric Power Research Institute, “IEEE Standard for Exposure to Electromagnetic Fields”, January 2003, pp. 1-7. [27] Advisory Group on Non-Ionizing Radiation (AGNIR) of the UK National Radiological Protection Board (NRPB), “Limiting
Exposure to Electromagnetic Fields (0 - 300 GHz)”, Doc. NRPB, Vol. 15, No. 2, 2004.
[28] National Radiological Protection Board, “Advice on Limiting Exposure to Electromagnetic Field (0 - 300GHz)”, Vol. 15, No. 2, 2004, pp. 1-35.
[29] ICNIRP, “Guidelines for Limiting Exposure to Time‐varying Electric and Magnetic Fields (1 Hz – 100 kHz)”,Health Physics, Vol. 99, No. 6, 2010, pp. 818‐836.
[30] H. Yu, B. Baodang, and X. Dexin, “The Electromagnetic Field Distribution in the Human Body under the Ultra-high Voltage
Transmission Line”, IEEE 2002, 2002, pp. 2243-2246.
[31] W. Van-Loock, “Elementary Effects in Humans Exposed to Electromagnetic Fields and Radiation”, Proceedings of the 5th Asian-Pacific Conference on Environmental Electromagnetics, Belgium, 2009, pp. 221-224.
[32] R.R. Neutra, V. Del-Pizzo and G.M. Lee, “An Evaluation of the Possible Risks from Electric and Magnetic Fields from Power
Lines, Internal Wiring, Electrical Occupations and Appliances”, California EMF Program, Oakland, 2002, USA.
[33] K.K.G. Jolanta, “Health Risk Assessment of Occupational Exposure to a Magnetic Field from Magnetic Resonance Imaging
Devices”, International Journal of Occupational Safety and Ergonomics, Vol. 12, No. 2, 2006, pp.155–167.
[34] O. Aliyu, I. Maina, and H. Ali, “Analysis of Electric Field Pollution due to 330kV and 132kV Transmission Lines”, Innovations in Science and Engineering, Vol. 1, No. 4, 2011, pp. 69-73.
[35] O. Aliyu, I. Maina, and H. Ali, “Analysis of Electromagnetic Pollution due to High Voltage Transmission Lines”, Journal of Energy Technologies and Policy, IISTE, Vol. 2, No. 7, 2012, pp. 1-10.
[36] R. Uhunmwagho, “Issues and Challenges in the Nigerian Electricity Industry: Case of Benin Electricity Distribution Company”, Academic Journal of Interdisciplinary Studies, Vol. 2, No. 12, 2013, pp. 153-157.
[37] S.A. Oyetunji, “Development of Substations Emulator for Akure Electric Power Distribution System in Nigeria”, Journal of Innovative Systems Design and Engineering, IISTE, Vol. 4, No. 8, 2013, pp. 21-29.
[38] I.G. Adebayo, I.A. Adejumobi, and G.A. Adepoju, “Power Flow Analysis using Load Tap-Changing Transformer (LTCT): A
Case Study of Nigerian 330kV Transmission Grid System”, International Journal of Engineering and Advanced Technology,
Vol. 2, Issue 3, 2013, pp. 230-237.
[39] O.S. Adeoye, “Estimation of Potential Load Demand of Local Government Areas of Ekiti State, Nigeria”, American Journal of Engineering Research, Vol. 3, Issue 6, 2014, pp. 101-106.
[40] T.O. Ale, A.A. Arasi, and F.O. Ugwute, “Effect(s) of Nominal-T Configuration on Transmission Line”, International Journal of Emerging Engineering Research and Technology, Vol. 3, Issue 3, 2015, pp. 62-67.
[41] A. Pramanik, “Electromagnetism: Theory and Applications” Eastern Economy Edition, Prentice Hall of India Private Ltd., New Delhi, Third Printing, 2006, Chapters 7 and 15.
Transactions on Antenna Propagation, Vol.26, May 1978, pp. 507-508.
[43] J.R. Wait and K.P. Spies, “On the Image Representation of the Quasi Static Fields of a Line Current”, Canadian Journal of Physics, Vol. 47, 1969, pp. 2731-2733.
[44] G. Lucca, “Magnetic Field Produced by Power Lines with Complex Geometry”, European Transactions on Electrical Power, Vol. 21, No 1, 2011, pp. 52-58.
[45] K. Budnik, and W. Machczynski, “Contributions to Studies on Calculation of the Magnetic Field under Power Lines”,European Transactions on Electrical Power, Vol. 16, No. 4, 2006, pp. 345-364.
[46] I.V. Lindell, J.I. Hanninen, and R. Pirjola, “Wait’s Complex Image Principle Generalized to Arbitrary Sources”, IEEE Transactions on Antenna and Propagation, Vol. 48, October 2000, pp. 1618-1624.
[47] J.H. Scott, “Electrical and Magnetic Properties of Rock and Soil”, US Geological Survey Technical Letter, Special Projects-16, 1966.