Systems/Circuits
Local Field Potentials in the Gustatory Cortex Carry Taste
Information
Rodrigo Pava˜o,
1Caitlin E. Piette,
2Vítor Lopes-dos-Santos,
1Donald B. Katz,
2and
X
Adriano B.L. Tort
11Brain Institute, Federal University of Rio Grande do Norte, RN 59056-450, Brazil and2Psychology Department and Volen Center for Complex Systems,
Brandeis University, Waltham, Massachusetts 02453
It has been recently shown that local field potentials (LFPs) from the auditory and visual cortices carry information about sensory stimuli, but whether this is a universal property of sensory cortices remains to be determined. Moreover, little is known about the temporal dynamics of sensory information contained in LFPs following stimulus onset. Here we investigated the time course of the amount of stimulus information in LFPs and spikes from the gustatory cortex of awake rats subjected to tastants and water delivery on the tongue. We found that the phase and amplitude of multiple LFP frequencies carry information about stimuli, which have specific time courses after stimulus delivery. The information carried by LFP phase and amplitude was independent within frequency bands, since the joint information exhibited neither synergy nor redundancy. Tastant information in LFPs was also independent and had a different time course from the information carried by spikes. These findings support the hypothesis that the brain uses different frequency channels to dynamically code for multiple features of a stimulus.
Introduction
It has been previously shown that rats can discriminate tastes (Scalera, 2000;Sadacca et al., 2012), and that neurons from the nucleus of the solitary tract (Lemon and Smith, 2006) and gusta-tory cortex (GC;Yamamoto et al., 1989;Katz et al., 2001; Samu-elsen et al., 2012) are modulated by taste identity. Tastants delivered on the tongue also lead to evoked potentials and changes in the oscillatory activity of GC local field potentials (LFPs;Tort et al., 2010). However, it remains to be determined whether GC LFP responses are unspecific for taste stimuli, or if they depend on tastant identity. This last possibility is plausible, since LFPs reflect an integration of synaptic inputs that may com-plement spike coding (Logothetis, 2002). In fact, it was recently shown that LFPs from visual and auditory cortices carry informa-tion about moving images and natural sounds, respectively ( Be-litski et al., 2008,2010;Montemurro et al., 2008;Kayser et al., 2009). Moreover, the information carried by different frequency bands may be independent (Belitski et al., 2008,2010), and, fur-ther, in the auditory cortex the information contained in LFP amplitude is not redundant with the information contained in LFP phase (Kayser et al., 2009). Whether these are general prop-erties of all sensory cortices remains to be shown. In addition, the
time course of the amount of information in LFPs following stim-ulus onset has not been characterized; it is currently unknown, for example, if the temporal dynamics of LFP information fol-lows that of spike responses.
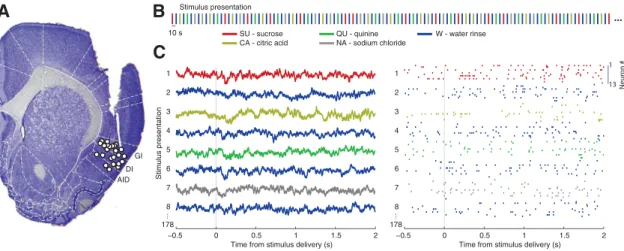
In the present work, we recorded LFPs and spiking activity from the GC of awake rats subjected to delivery of small aliquots of sucrose, sodium chloride, citric acid, or quinine (exemplars of sweet, salty, sour, and bitter, respectively), interleaved with water rinse, on the tongue (Fig. 1). Using an information theoretic approach, we measured the amount of mutual information (MI) between taste identity and the phase and amplitude of frequency components of GC LFPs using a 1 ms time resolution. This ap-proach allowed us to investigate the time course of information content, from tastant delivery and initial neuronal responses un-til signal stabilization, seconds after. We found that both the phase and amplitude of LFPs carry information about taste, which was independent from one another and also independent from the information contained in spike counts. The informa-tion carried by LFPs and spikes had different time courses follow-ing tastant delivery, and, moreover, different frequency bands exhibited different information dynamics. Our results suggest that spike counts and the amplitude and phase of field responses in GC have complementary roles in taste coding.
Materials and Methods
Subjects.We used female Long–Evans rats (n⫽21; 275–300 g at time of surgery), maintained on a 12 h light/dark cycle; all experiments were performed during the light period of the cycle. Chow and water were
availablead libitum.
Surgery.Anesthesia was induced and maintained using intraperitoneal injections of a mixture of ketamine, xylazine, and acepromazine (100, 10, and 10 mg/kg, respectively, for induction; 1/3 induction dose every 1.25 h for maintenance). Animals were placed on a stereotaxic frame, had the scalp excised, and holes were bored in the skull for ground screws,
elec-Received March 5, 2014; revised April 30, 2014; accepted May 21, 2014.
Author contributions: R.P., C.E.P., V.L.-d.S., D.B.K., and A.B.L.T. designed research; R.P. and C.E.P. performed research; V.L.-d.S. contributed unpublished reagents/analytic tools; R.P. analyzed data; R.P. and A.B.L.T. wrote the paper.
This work is supported by National Institutes of Health Grant DC006666, Conselho Nacional de Desenvolvimento Científico e Tecnolo´gico, Coordenac¸a˜o de Aperfeic¸oamento de Pessoal de Nível Superior, and Fundac¸a˜o de Apoio a` Pesquisa do Estado do Rio Grande do Norte.
The authors declare no competing financial interests.
Correspondence should be addressed to Dr. Adriano B. L. Tort, Brain Institute, Federal University of Rio Grande do Norte, Rua Nascimento de Castro, 2155, Natal, RN 59056-450, Brazil. E-mail: [email protected].
DOI:10.1523/JNEUROSCI.0908-14.2014
trode bundles, and guide cannulae. Bundles of 16 Formvar-coated, 25
m nichrome wires were inserted 0.5 mm above the GC in both
hemi-spheres [coordinates: anteroposterior (AP) 1.4 mm and mediolateral
(ML)⫾5 mm from bregma; dorsoventral (DV)⫺4.5 mm from dura;
(Fig. 1A)]. Guide cannulae were inserted into the basolateral amygdala
(AP⫺3 mm and ML⫾5.1 mm from bregma; DV⫺7.7 mm from skull)
for another set of experiments (Piette et al., 2012); no infusion was done
through the cannulae before or during the sessions analyzed in the pres-ent study. Once in position, electrode bundles were cempres-ented to the skull with dental acrylic, along with two intraoral cannulae (IOCs), which were flexible plastic tubing inserted close to the tongue through the cheek and extending upward to the top of the skull. Rats were given 7 d to recover from surgery.
Fluid delivery.After beginning a regimen of mild water restriction (45 min per day, from 7 d following surgery), rats were habituated for several days to the test chamber and IOC delivery of water. The testing session
was identical to adaptation sessions, but with 40l aliquots of the
fol-lowing (inM): 0.1 NaCl (NA), 0.1 sucrose (SU), 0.2 citric acid (CA), and
0.001 quinine-HCl (QU). Tastes were selected randomly without
re-placement, and taste deliveries were interleaved with a 40l aliquot of
water; the time between each fluid delivery was 10 s. The testing session
lasted⬃30 min, including at least 20 trials of each tastant, and 80 trials of
water (Fig. 1B).
Electrophysiology.For spiking activity, recordings were amplified, fil-tered at 300 – 8000 Hz, and digitized (Plexon). Single neurons of at least 3:1 signal-to-noise ratio were isolated on-line using an amplitude
crite-rion in cooperation with a template algorithm (Nicolelis et al., 1997);
off-line analysis confirmed and corrected on-line discriminations. Raw signals were also split off to a separate amplifier with filtering set for LFP recordings (bandpass 0.5–300 Hz) and from there to a computer, where
they were digitized at 1000 Hz. One to 18 (7.1⫾4.5) units and 2–16
(12.7⫾4.1) LFP channels per rat were included in data analysis (Fig. 1C).
Data analysis.All analyses were done using built-in and custom rou-tines written in MATLAB (MathWorks).
LFP filtering, and estimation of phase and amplitude.LFP signals were
filtered with a linear finite impulse response filter using theeegfilt
func-tion from the EEGLAB Toolbox (Delorme and Makeig, 2004; http://sccn.
ucsd.edu/eeglab/). The analytical representation of the signal based on
the Hilbert transform (hilbertfunction from the Signal Processing
Tool-box) was used to obtain the instantaneous amplitude and phase time
series (Figs. 2A,4A).
Evoked response and phase-reset index.The gustatory evoked potential response was obtained by averaging LFPs epochs triggered by stimulus delivery time. The averaging was done first over trials for each channel, and then over channels for each rat, and finally over rats. Fast
compo-nents were removed by low-pass filtering the mean signal⬍30 Hz in
Figure 5B. The phase-reset index was computed as previously described (Tort et al., 2010). For each instant of time, this metric assumes a value from 0 to 1, which corresponds to the level of phase consistency across trials; 1 means that the same phase occurred across trials for the corre-sponding time and 0 means no preferred phase across trials.
Spiking activity.Multiple isolated neurons (single units) were pooled into a single time series (pooled units). A continuous time series of firing
rate was generated by convoluting spike times with a Gaussian (⫽25
ms, so that 95% of the Gaussian of a single spike was included in spike
time⫾50 ms). The same sampling rate of the LFP (1000 Hz) was used for
the firing rate time series; the final time series was obtained by dividing by
the number of neurons in the pool (Fig. 7A).
MI.The reduction of the uncertainty about a variable (in our case,
tastant identity) due to the realization of another variable (e.g., LFP
amplitude) is called MI. The entropy (H) measures the uncertainty of a
random variableX:
H(X)⫽ ⫺冱xp(x)⫻log2(p(x)). (1)
The joint entropy of a pair of random variablesXandYis given by the
following:
H(X,Y)⫽ ⫺冱x,yp(x,y)⫻log2(p(x,y)). (2)
The MI is computed as follows:
MI(X,Y)⫽H(X)⫹H(Y)⫺H(X,Y), (3)
which is equivalent to
MI(X,Y)⫽冱x,yp(x,y)⫻log2(p(x,y)/p(x)p(y)). (4)
In our study,Xrefers to the stimuli, andYrefers to values assumed by a
neurophysiological variable (i.e., LFP amplitude, LFP phase or firing
rate), which were binned into four equipopulated bins (quartiles;Kayser
et al., 2009).
The MI estimated directly from the equations above, called naive MI, is biased due to the finite number of samples used to estimate the true
distributions (Panzeri et al., 2007). To correct for finite sampling errors,
we used a shuffling procedure associated with the Panzeri and Treves
method (Panzeri and Treves, 1996;Panzeri et al., 2007), which was
im-plemented in the toolbox described byMagri et al. (2009).Figures 2and
4show an overview of signal binning into quartile bins and MI
estima-tion as a funcestima-tion of time around stimulus delivery; the same procedure
was applied to pooled spike counts (Fig. 7). For the color-coded plots
shown inFigures 3,AandC, and5A, left, we bandpassed signals using 1
Hz windows centered at integer values (e.g., information in 5.5– 6.5 Hz is represented by the 6 Hz y-tick); for the line plots on the right, we filtered
−0.5 0 0.5 1 1.5 2
Time from stimulus delivery (s) 10 s
1
2
3
4
5
6
7
8
...
178
Stimulus presentation
−0.5 0 0.5 1 1.5 2
Time from stimulus delivery (s) Stimulus presentation
1
2
3
4
5
6
7
8
...
178
A
B
C
GI DI AID
...
Neur
on #
1
13 CA - citric acid NA - sodium chloride
QU - quinine
SU - sucrose W - water rinse
Figure 1. Experimental design.A, Sample histology showing placement of electrode tips of the 21 rats included in the analysis. AID, agranular insular cortex (dorsal); DI, dysgranular insular cortex;
GI, granular insular cortex. Adapted fromPiette et al. (2012).B, Stimulation protocol. Fluids were delivered through an IOC (session length: 30 min). Tastants (NA/SU/SA/QU) were presented
randomly and interleaved with water delivery. The time between each fluid delivery was 10 s.C, Example LFP signals (left) and spike rastergram (right) across trials. In this and other figures, time
signals as indicated on the labels. For each rat, the information was calculated for each LFP channel separately and then averaged over
channels. Except forFigure 5C, all results are
presented as mean over animals (that is,n⫽21
in all analyses).
Synergy analysis.The information between stimuli and two or more neurophysiological signals (e.g., LFP amplitude and LFP phase) allows evaluating the existence of synergy or redundancy among them. Synergy occurs when two or more variables evaluated together have higher MI than the sum of the MI associ-ated to each variable separately. The level of synergy is defined by
Syn(X;Y1,Y2)⫽MI(X;Y1,Y2)
⫺MI(X,Y1)⫺MI(X;Y2). (5)
Synergy occurs if Syn(X;Y1,Y2)⬎0; otherwise,
if Syn(X;Y1,Y2)⬍0, variables are said to be
re-dundant. It should be noted that distributions with more categories or smaller sample sizes have larger bias in MI estimation. Because the joint distribution has more bins (in our case,
4⫻4⫽16 bins) than the marginal
distribu-tions (4 bins each) for the same sample size, in these analyses we applied an additional bias correction: for each channel, the mean
pre-stimulus MI (from⫺3 to⫺1 s) was subtracted
from each of the MI estimates on the right hand side of Equation 5. Similarly to the above equa-tion, MI was obtained by the average over
channels for each rat, while results (Figs. 6B,
7E) are presented as mean over rats (n⫽21).
Finally, we performed an additional analysis of synergy/redundancy previously described bySchneidman et al. (2003). Briefly, the time series of LFP amplitude and phase were shuf-fled across trials of the same stimulus; this pro-cedure thus breaks the dependence between phase and amplitude within trials but does not change the individual amount of information (since the marginal distribution is unchanged for each stimulus). We then compared the ac-tual value of joint information in LFP phase and amplitude with the shuffled distribution of
independent phase and amplitude (n⫽200
surrogates). This analysis was performed for the time-frequency ranges associated with highest MI values.
Results
Taste information in GC LFP amplitude We first investigated whether there is any taste specificity in the amplitude of differ-ent frequency compondiffer-ents of LFP
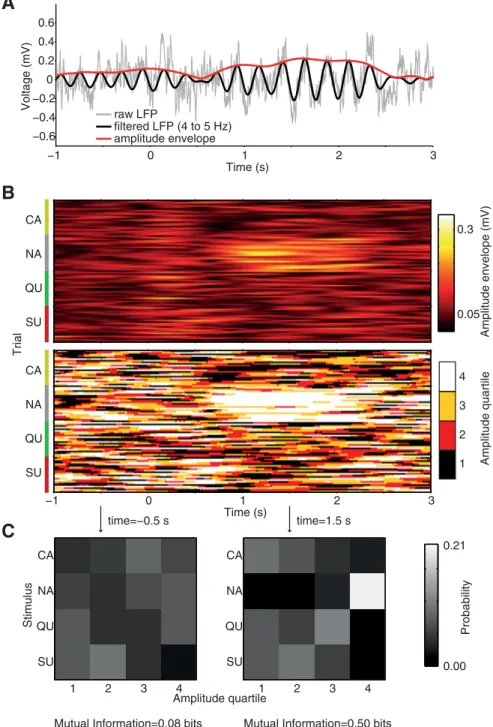
re-sponses to taste stimuli. We computed the MI between stimuli and the amplitude of filtered LFPs following the procedure described inFigure 2, which allows obtaining MI estimates at a millisecond resolution (i.e., 1000 Hz sampling rate). Briefly, the LFP is filtered into the frequency band under study and the am-plitude envelope of the filtered signal is obtained (Fig. 2A); for each time point, amplitude values across trials are binned into four quartiles (Fig. 2B); the MI is computed using the joint prob-ability distribution between binned amplitude values and taste stimuli (Fig. 2C). We estimated the amount of stimulus
informa-tion in LFP amplitude at every time step from 4 s before to 8 s after stimulus delivery (in the figures we focus on a shorter range where changes take place). In this work we evaluated two distri-butions separately: one composed by responses to the four tas-tants (CA, NA, QU, and SU), and another composed by the four tastants plus the responses to water (W).Figure 3,AandC, top, show the MI between tastants and LFP amplitude for multiple frequencies at different times around stimulus delivery. Before stimulus delivery (baseline), the sensory information contained in LFP amplitude was low for all analyzed frequencies. Interest-ingly, both the lowest (⬍10 Hz) and the highest (⬎100 Hz) part
−1 0 1 2 3
−0.6 −0.4 −0.2 0 0.2 0.4 0.6
Time (s)
Amplitude envelope (mV)
Voltage (mV)
Amplitude quartile
raw LFP
filtered LFP (4 to 5 Hz) amplitude envelope
Amplitude quartile
Stimulus
time=−0.5 s
1 2 3 4
CA
NA
QU
SU
time=1.5 s
1 2 3 4
CA
NA
QU
SU
0.05 0.3
Time (s)
−1 0 1 2 3
1 2 3 4 CA
NA
QU
SU
CA
NA
QU
SU
Trial
Mutual Information=0.08 bits Mutual Information=0.50 bits
A
B
C
Probability
0.21
0.00
Figure 2. Estimating taste information in LFP amplitude.A, Raw LFP (gray) and filtered signal (black) and its amplitude
of the LFP frequency spectrum increased information about tas-tant identity following stimulus delivery. Information content started to increase from chance levels at⬃0.5 s after stimulus deliv-ery for the amplitude of higher frequency components (Fig. 3C, top right), while it was significantly above baseline⬃0.8 s after stimulus delivery for the lower LFP frequencies (Fig. 3A, top right). Informa-tion returned to baseline levels at⬃2 s post stimulus for all frequen-cies. Considering water (W) as a stimulus did not markedly change the dynamics of information content in the amplitude of high-frequency LFP components (Fig. 3C, bottom), but generated signif-icant levels of information in the amplitude of 7–12 Hz LFP components from 0 to⬃1 s after fluid delivery (Fig. 3A, bottom).
The time-frequency ranges of high information content re-flect different taste-amplitude specificities. For example, the high tastant information observed in 4 –5 Hz from 1 to 2 s indicates that amplitude values at this frequency and time period differ among tastants. Consistent with this,Figure 3B, top, shows that LFP responses following NA delivery have higher mean ampli-tude in this time-frequency range compared with other fluids. Similarly, the high level of information in the amplitude of 7–12 Hz from 0 to 1 s present only when water is taken into account (Fig. 3A, compare top and bottom) indicates that there is no amplitude specificity for the four tastants in this time-frequency range, and that the amplitude changes at 7–12 Hz should differ following water versus tastant delivery. Indeed,Figure 3B, bottom, shows that water induces an earlier increase in the amplitude of 7–12 Hz compared with other stimuli. Finally, the high taste-amplitude information in 180 –270 Hz from 0.5 to 2 s is associated with
differ-ent mean changes in amplitude at this range following the delivery of different tastants (Fig. 3D).
In all, our results show that GC LFP amplitude contains infor-mation about stimulus quality in specific frequencies and time epochs after stimulus delivery.
Taste information in GC LFP phase
We used a similar procedure as above to investigate whether there is taste specificity in the time-frequency representation of the LFP phase (Fig. 4).Figure 5A, top, shows that the phase of very slow LFP frequency components (⬍1.5 Hz) contains tastant informa-tion, which rises following stimulus delivery, peaks at⬃800 ms afterward, and slowly decreases back to baseline levels 3 s post stimulus. In addition, the phase of 2–16 Hz LFP frequencies con-tained information about water in the first 500 ms post stimulus (Fig. 5A, bottom). The phase of higher frequency components (⬎25 Hz) exhibited no increase in information content after fluid delivery (except for the short time interval of opening and closing of fluid dispensers [not shown], which we deemed to be spurious as inFig. 3C). And, similarly to the amplitude, tastant informa-tion in LFP phase was steadily low before stimulus delivery for all frequencies.
The existence of taste specificity in the instantaneous phase of slow GC LFP components suggests that gustatory evoked poten-tials (Tort et al., 2010) might be different among stimuli. We next investigated this possibility, and found that the negative peak of the evoked potential to water had shorter latency than to tastants (Fig. 5B); this earlier deflection accounts for the information in the phase of 2–16 Hz frequencies observed when water is also considered
Frequency (Hz)
5 10 15 20
0.02 0.05
Time (s)
−1 0 1 2 3
5 10 15 20
0.01 0.04
Frequency (Hz)
50 100 150 200 250
0.02 0.05
Time (s)
−1 0 1 2 3
50 100 150 200 250
0.01 0.04
0 0.02 0.04 0.06
Information (bits)
−10 0 1 2 3
0.02 0.04 0.06
Time (s) 4 to 5 Hz 7 to 12 Hz
0 0.02 0.04 0.06
Information (bits)
−1 0 1 2 3
0 0.02 0.04 0.06
Time (s)
180 to 270 Hz
0 0.5 1 1.5 2
0.06 0.07 0.08 0.09
Amplitude envelope (mV)
4 to 5 Hz
0 0.1 0.2 0.3
0.08 0.1 0.12
Time (s) 7 to 12 Hz
0 0.6 1.2 1.8
7 7.5 8 8.5 9 9.5 10 10.5 11
x 10−3
Time (s)
Amplitude envelope (mV)
CA NA QU SU W
180 to 270 Hz Stimuli: CA, NA, QU, SU
Stimuli: CA, NA, QU, SU, W
Stimuli: CA, NA, QU, SU
Stimuli: CA, NA, QU, SU, W
A
B
C
D
Figure 3. GC LFP amplitude carries information about tastants and water.A, Top, left, MI between tastants and the amplitude of low LFP frequencies (1 Hz bins) as a function of time. Top, right, Time course
a stimulus. This was further confirmed by the analysis of filtered signals and associated phase time series (Fig. 5C). These results show that the instantaneous phase of slow LFP frequency components carries tastant information.
Independent taste information in GC LFP phase and amplitude
We next analyzed the information con-tent in the joint distribution of LFP phase and amplitude. In particular, we sought to determine whether the simultaneous eval-uation of amplitude and phase would re-veal synergistic or redundant information about tastants. Synergy occurs when the amount of information conveyed by the combined analysis of phase and ampli-tude is larger than the sum of the informa-tion conveyed by each signal evaluated individually. Redundancy is defined as the opposite of synergy, that is, when the joint distribution of phase and amplitude has less information than the sum of the in-formation carried by each signal alone. If neither synergy nor redundancy occurs, the information carried by the individual signals is said to be independent.Figure 6Ashows the time-frequency representa-tion of taste informarepresenta-tion contained in the joint distribution of phase and amplitude. Notice that the time-frequency ranges as-sociated with high values of information in the joint distribution correspond pre-cisely to those observed in the marginal distributions (compareFigs. 3A,C, 5A). In particular, there was no new “informa-tive” range of frequency and time in the combined analysis that was not present in the time-frequency representation of the information conveyed by either phase or amplitude considered alone.
We next investigated whether the in-formation in LFP amplitude and phase for a same frequency range and time in-terval is redundant, independent, or synergistic. To that end, for each rat we averaged information values from in-formative time-frequency ranges for the marginal and joint distributions, as as-sessed by the time-frequency represen-tation of information content for each case
(that is,Figs. 3A,C,5A, 6A). We then compared the amount of tastant information carried by the joint distribution of phase and amplitude with the sum of (individual) amplitude information and phase information (Fig. 6B). As shown in the two rightmost bars of
Figure 6B, we found that the information about tastants in the joint distribution is approximately the same as the amplitude information plus the phase information. Given the absence of synergy or redun-dancy, these results show that the information conveyed by LFP amplitude and phase is independent.
The results above were confirmed by a trial-shuffling pro-cedure that preserves stimulus identity (see Materials and
Methods). This analysis keeps individual information values unchanged but breaks redundancy or synergy (Schneidman et al., 2003). Under this framework, we observed that the amount of taste information carried by actual joint distributions of ampli-tude and phase was not different from the information values obtained for shuffled joint distributions in which signals are in-dependent by definition (data not shown).
Independent taste information in GC LFP and spike counts We proceeded by estimating the MI between tastants and GC spiking activity. To that end, for each animal spike times of
Voltage (mV) raw LFP
filtered LFP (3 to 6 Hz) phase
Phase quartile
1 2 3 4
time=−0.1 s time=0.2 s
Phase quartile
Mutual Information=0.06 bits Mutual Information=0.18 bits
A
B
C
Trial
CA NA QU SU
W
CA NA QU SU
W
Probability
0.55
0.00
pi
−pi
pi
−pi −0.6
−0.4 −0.2 0 0.2 0.4
Time (s)
Phase (rad)
Phase (rad)
−0.2 0 0.2 0.4 0.6
Time (s)
−0.2 0 0.2 0.4 0.6
Stimulus
1 2 3 4
CA
NA
QU
SU
W
1 2 3 4
CA
NA
QU
SU
W
Figure 4. Estimating sensory information in LFP phase.A, Raw LFP (gray) and filtered signal (black) and its phase time series
(red) for an example trial.B, Continuous and binned phase values as a function of time for the different tastants and water.C, The
MI is calculated from the joint probability distribution of stimuli and phase in each time bin; however, for clearer visualization (since water is delivered 4 times more often than tastants; seeFig. 1B), the matrix rows show marginal probability distributions of phase
isolated neurons were pooled and convoluted with a Gaussian function (⫽25 ms; see Materials and Methods), generating a continuous time series of instantaneous firing rate (Fig. 7A,B). As performed to LFPs, the instantaneous firing rate of each rat was then binned into four quartiles to quantify its MI with stimuli.Figure 7Cshows that spikes conveyed significant information about tastants, which promptly increased follow-ing fluid delivery, reached maximum value at⬃1 s, and slowly decayed back to baseline levels⬃4 s post stimulus. Interest-ingly, spike information about stimuli peaked earlier follow-ing stimulus deliver when responses to water were also taken into account. These results are explained by differences in firing rate responses to different stimuli; for example, water delivery was associated to shorter lasting spiking responses (Fig. 7D).
Since LFPs are believed to represent averaged synaptic ac-tivity in a local population of neurons (Logothetis, 2002), which is fomented by spikes, we next investigated whether the sensory information conveyed by LFP and spikes would be redundant, independent, or synergistic. We computed the amount of sensory information carried by spike counts and the amplitude and phase of multiple LFP frequency compo-nents at informative time intervals after taste delivery. We
compared the sum of the information conveyed by the isolated analysis of amplitude, phase, or firing rate with that of the joint information of firing rate and LFP amplitude or/and phase. As shown inFigure 7E, the sensory information in the combined analyses of firing rate and amplitude, firing rate and phase, and firing rate and phase and amplitude was equivalent to the sum of the information carried by the corresponding marginal distributions. These results were confirmed by the same trial-shuffling procedure as applied above (data not shown). Therefore, the information carried by LFP and spike counts is not redundant but rather independent.
Discussion
We investigated the temporal dynamics of taste information con-veyed by LFP and spiking activity in the GC of the awake rat. Our results show that LFP information increases from baseline levels following stimulus delivery and that the amount of information carried by different frequency components exhibits different time courses. We further obtained that the information carried by LFP amplitude and phase is independent from one another, as well as from spike information.
In agreement with our findings, recent studies showed that spikes and LFP in visual and auditory cortices of monkeys carry
Frequency (Hz)
Stimuli: CA, NA, QU, SU
5 10 15 20
0.01 0.04
Time (s)
Stimuli: CA, NA, QU, SU, W
−1 0 1 2 3
5 10 15 20
0 0.03
0 0.02 0.04 0.06 0.08 0.1
−1 0 1 2 3
0 0.02 0.04 0.06 0.08 0.1
Time (s)
Information (bits) 0 to 1 Hz
2 to 6 Hz
CA NA QU SU W
Voltage (mV) 2 to 6 Hz
Phase (rad)
Time (s)
A
B
C
−1 0 1 2 3
−0.08 −0.06 −0.04 −0.02 0 0.02
Time (s)
Voltage (mV)
−0.2 0 0.2
−0.5 0 0.5 1
−pi 0 pi
Figure 5. GC LFP phase carries information about tastants and water.A, Stimulus-phase MI in low LFP frequency band (1–25 Hz), depicted as inFigure 3A. Higher frequency bands show
no increase in information after fluid delivery (except for spurious results during opening and closure of fluid dispensers; data not shown). The time courses of the information carried by 0 –1 and 2– 6 Hz frequency bands are shown on the right. Note that 0 –1 Hz has information about tastants from 0.5 to 2.5 s, while 2– 6 Hz carries information about water from 0 to 0.5 s. Horizontal lines denote the upper limit of the 95% confidence interval of information values during baseline.B, Gustatory evoked potentials (mean over rats). Notice earlier LFP deflection
following water rinse compared with tastants.C, Mean 2– 6 Hz filtered signals (top) and mean phase series (bottom) for one exemplar LFP channel over trials. Darker dots shown on the
complementary sensory information (Belitski et al., 2008,2010;
Montemurro et al., 2008;Kayser et al., 2009). However, it should be noted that these studies differed from ours in the way the sensory stimuli were defined. Namely, monkeys were exposed to the repeated presentation of a continuous video (Belitski et al., 2008,2010;Montemurro et al., 2008) or sound (Kayser et al., 2009; Belitski et al., 2010) in different trials. In each trial, the whole video/sound sequence was divided into nonoverlapping time windows, and each time window was defined to be a stimu-lus. Thus, under this framework each stimulus is a complex mix-ture of naturalistic feamix-tures such as multiple video frames. In contrast, here we used a more standard set of stimuli: four pri-mary tastes and water, which were delivered in isolation and spaced by 10 s. This protocol allowed us to assess information values during a baseline period, and to study the time course of
information changes following stimulus delivery. Note that the dynamics of information content could not be investigated in the previous studies because time was used for defining the set of stimuli (Belitski et al., 2008,2010;Montemurro et al., 2008; Kay-ser et al., 2009). In addition, here we have identified stimulus-specific changes in the amplitude and phase of LFP components that account for the high information values. For example, we observed that the amplitude of high-frequency LFP components following stimulus delivery was different for the different tastes, with CA associated with the highest amplitude (Fig. 3D). Simi-larly, we observed that the phase reset of low-frequency GC LFP oscillations (Tort et al., 2010) is advanced following water deliv-ery on the tongue (Fig. 5C).
Our analysis showed that the phase of 2–15 Hz LFP compo-nents are not informative about the basic tastants (Fig. 5A), since
Frequency (Hz)
0.11
-0.01 Stimuli: CA, NA, QU, SU
Stimuli: CA, NA, QU, SU, W
Stimuli: CA, NA, QU, SU, W
A
B
5 10 15 20
5 10 15 20
Time (s)
−1 0 1 2 3
50 100 150 200 250
Mean Information (bits)
4 to 5Hz 1 to 1.5s
2 to 6Hz 0 to 0.3s
180 to 270Hz 0.6 to 1.3s
Amp Phase Amp + Phase
Amp & Phase 0
0.05 0.1
0 0.05 0.1
0 0.05 0.1
Figure 6. Gustatory information carried by LFP amplitude and phase is independent.A, MI between stimuli and the joint distribution of amplitude and phase values. Notice that amplitude-phase
all of them induce an identical pattern of oscillatory reset, as seen by band-filtered evoked potentials (Fig. 5C). Curiously, however, by considering different time bins as representing different stimuli as in previous work (Belitski et al., 2008,
2010;Montemurro et al., 2008;Kayser et al., 2009), we found that the instantaneous LFP phase becomes highly informative (data not shown). This is explained by the fact that different time bins are associated with specific phases due to the dura-tion of the evoked potential/oscillatory reset that outlasts the period of sensory stimulation (Picton and Hillyard, 1974;
Courchesne et al., 1975;Tort et al., 2010;Privman et al., 2011). Thus, while the oscillatory reset is likely related to the process-ing of the sensory stimulus, we note that under this analytical framework the information carried by LFP phase is not about the stimulus itself but about time. In this sense, given that visual and auditory stimuli may induce oscillatory resets, it would be interesting to know whether the amount of infor-mation carried by LFP phase and amplitude reported in pre-vious studies (Belitski et al., 2008,2010;Montemurro et al., 2008; Kayser et al., 2009) would change by randomizing the order of visual or auditory stimuli; for example, it may have been the case that the oscillatory reset induced by a given stimulus A would have influenced LFP phase during the sub-sequent presentation of a stimulus B that by itself would cause no LFP response. In the present work, we used large inter-stimulus intervals and randomized inter-stimulus presentation; un-der this protocol, we were able to demonstrate that GC LFPs carry sensory information.
Spiking activity exhibited high information about tastants, peaking at⬃1 s after peripheral stimulation with basic tastants, and⬃400 ms when water was taken into account (which is
read-ily explained by the shorter transient of spike responses to water;
Fig. 7D). To our knowledge, this is the first description of the dynamics of taste information in the instantaneous spike rate of a population of GC neurons. Similar analyses have been previously reported for the instantaneous firing rate of indi-vidual neurons in the geniculate ganglion, which carried taste information with comparable time courses (Lawhern et al., 2011). In the somatosensory system, it has been shown that the cumulative information–the amount of information as a func-tion of the time length from stimulus onset used for counting spikes–reaches steady values ⬎50 ms (Panzeri et al., 2001;
Petersen et al., 2001;Arabzadeh et al., 2004,2006). Consistent with this, using a similar sliding window approach as ours,
Arabzadeh et al. (2004,2006) showed that the “ongoing infor-mation” about whisker vibration in spikes from the barrel cortex and trigeminal ganglion increases immediately after simulation and decreases 150 ms afterward. Notice that the information time course about vibrissae movements in spikes substantially differs from the time course of tastant informa-tion reported here, which could last up to 4 –5 s after periph-eral stimulation (Fig. 7C). This result indicates that taste coding is complex, and likely involves palatability representa-tions that must integrate information from multiple brain regions (Katz et al., 2002;Jones et al., 2006;Piette et al., 2012). Mounting evidence suggests that high-frequency LFP compo-nents (⬎100 Hz) represent spectral leakage from extracellular spikes, and that their instantaneous amplitude would constitute a proxy for tracking multi-unit activity (Jia and Kohn, 2011, Bel-luscio et al., 2012; Ray and Maunsell, 2011; Telenczuk et al., 2011). However, it has recently been demonstrated that this is not
Stimuli: CA, NA, QU, SU
Stimuli: CA, NA, QU, SU, W
Stimuli: CA, NA, QU, SU, W 1 to 1.5 s
0 to 0.3 s
0.6 to 1.3 s
Amp Phase FR Phase + FR
Phase & FR Amp
+ FR
Amp & FR
Amp + Phase
+ FR
Amp & Phase
& FR 0
0.05 0.1 0.15 0 0.05 0.1 0.15 0 0.05 0.1 0.15 single units
pooled units
Trial
CA
NA
QU
SU
W
0 10
Hz
A
B
0 0.04
0.08
0.12
−2 0 2 4 6
−2 0 2 4 6
Time (s)
Firing rate information (bits)
CA, NA, QU, SU CA, NA, QU, SU, W
2 3 4 5 6
Firing rate (Hz/neuron)
CA NA QU SU W
C
E
D
Time (s)
Firing rate (Hz/neuron)
Mean Information (bits)
4 to 5 Hz
2 to 6 Hz
180 to 270 Hz
−2 0 2 4 6
0 5 10 15
−2 0 2 4 6
Figure 7. LFP and spike information are independent.A, Tastant information in pooled neuronal firing rate. Top, Spiking activity of nine neurons during an example trial, along with the pooled
always the case, and that whether the highest frequency range of the LFP spectrum is contaminated by spiking activity or not should be examined on an individual basis (Scheffer-Teixeira et al., 2013). In the present work, we found that both LFP compo-nents⬎100 Hz and population spike counts dynamically repre-sent taste information (Figs. 3C,7C), which indicates that these two signals might be related. However, taste information in spike counts and in LFP frequencies⬎100 Hz exhibited dif-ferent time courses, with the former being considerably lon-ger. In addition, the time course of tastant information in spike counts, but not in LFP components⬎100 Hz, depended on whether water was considered as a stimulus (compareFigs. 3C, left,7C). Furthermore, these signals showed different re-sponse magnitudes for the different tastants; for example, CA was associated with the highest LFP amplitude at 180 –270 Hz, which was not the case for spike counts (compareFigs. 3B,7D). Finally, synergy analyses showed that both signals are rather indepen-dent, since the information carried by their joint probability is not different from the sum of the information carried by each signal individually (Fig. 7E, bottom). In all, these results suggest that spike counts and high-frequency LFP components code for different features of the stimulus.
The nonredundancy between the amplitude and phase of LFPs and spiking activity observed here is generally consistent with previous findings. Namely,Montemurro et al. (2008)and
Belitski et al. (2008)reported that the information in LFP and spiking activity in the primary visual cortex of monkeys is not redundant, whileKayser et al. (2009)obtained similar results in recordings from the monkey auditory cortex. In addition,
Kayser et al. (2009)also showed that the joint information in amplitude and phase is higher than their individual informa-tion; unfortunately, specific measures of synergy/redundancy were not computed in this study. Upon visual inspection of their Figure 1C, it seems that the joint distribution may actu-ally carry more information than the sum of the information in the marginal distributions, suggesting synergy. However, it should be noted that here we have controlled for the bias introduced by the different number of bins in the individual (4 bins) in joint distributions (e.g., 4⫻4⫽16 bins) by subtract-ing information values dursubtract-ing the baseline period, which is a different procedure fromKayser et al. (2009). In addition, we obtained the same results of information independence when performing a new set of analyses that relied on computing joint distributions after shuffling trials within the same stim-ulus, thus preserving marginal distributions (Schneidman et al., 2003). Nevertheless, whether peripheral information may be independent and complementary in some sensory cortex (as the GC) while synergistic in others (as the auditory cortex) remains to be demonstrated under a similar experimental pro-tocol and analytical framework.
In summary, we have examined taste coding in GC by assess-ing the dynamics of information content in LFP signals followassess-ing sensory stimulation. We found significant increases in informa-tion values from baseline levels in the phase and amplitude of multiple LFP bands, which were nonredundant and complemen-tary to spiking activity. These results provide new insights into the time course of physical and hedonic representation of tastes (Katz et al., 2001,2002).
References
Arabzadeh E, Panzeri S, Diamond ME (2004) Whisker vibration informa-tion carried by rat barrel cortex neurons. J Neurosci 24:6011– 6020.
CrossRef Medline
Arabzadeh E, Panzeri S, Diamond ME (2006) Deciphering the spike train of a sensory neuron: counts and temporal patterns in the rat whisker
path-way. J Neurosci 26:9216 –9226.CrossRef Medline
Belitski A, Gretton A, Magri C, Murayama Y, Montemurro MA, Logothetis NK, Panzeri S (2008) Low-frequency local field potentials and spikes in primary visual cortex convey independent visual information. J Neurosci
28:5696 –5709.CrossRef Medline
Belitski A, Panzeri S, Magri C, Logothetis NK, Kayser C (2010) Sensory information in local field potentials and spikes from visual and auditory cortices: time scales and frequency bands. J Comput Neurosci 29:533– 545.CrossRef Medline
Belluscio MA, Mizuseki K, Schmidt R, Kempter R, Buzsa´ki G (2012)
Cross-frequency phase-phase coupling betweenand␥oscillations in the
hip-pocampus. J Neurosci 32:423– 435.CrossRef Medline
Courchesne E, Hillyard SA, Galambos R (1975) Stimulus novelty, task rele-vance and the visual evoked potential in man. Electroencephalogr Clin
Neurophysiol 39:131–143.CrossRef Medline
Delorme A, Makeig S (2004) EEGLAB: an open source toolbox for analysis of single-trial EEG dynamics including independent component analysis.
J Neurosci Methods 134:9 –21.CrossRef Medline
Jia X, Kohn A (2011) Gamma rhythms in the brain. PLoS Biol 9:e1001045.
CrossRef Medline
Jones LM, Fontanini A, Katz DB (2006) Gustatory processing: a dynamic
systems approach. Curr Opin Neurobiol 16:420 – 428.CrossRef Medline
Katz DB, Simon SA, Nicolelis MA (2001) Dynamic and multimodal re-sponses of gustatory cortical neurons in awake rats. J Neurosci 21:4478 –
4489.Medline
Katz DB, Nicolelis MA, Simon SA (2002) Gustatory processing is dynamic
and distributed. Curr Opin Neurobiol 12:448 – 454.CrossRef Medline
Kayser C, Montemurro MA, Logothetis NK, Panzeri S (2009) Spike-phase coding boosts and stabilizes information carried by spatial and temporal
spike patterns. Neuron 61:597– 608.CrossRef Medline
Lawhern V, Nikonov AA, Wu W, Contreras RJ (2011) Spike rate and spike timing contributions to coding taste quality information in rat periphery.
Front Integr Neurosci 5:18.CrossRef Medline
Lemon CH, Smith DV (2006) Influence of response variability on the cod-ing performance of central gustatory neurons. J Neurosci 26:7433–7443.
CrossRef Medline
Logothetis NK (2002) The neural basis of the blood-oxygen-level-dependent functional magnetic resonance imaging signal. Philos Trans R
Soc Lond B Biol Sci 357:1003–1037.CrossRef Medline
Magri C, Whittingstall K, Singh V, Logothetis NK, Panzeri S (2009) A tool-box for the fast information analysis of multiple-site LFP, EEG and spike
train recordings. BMC Neurosci 10:81.CrossRef Medline
Montemurro MA, Rasch MJ, Murayama Y, Logothetis NK, Panzeri S (2008) Phase-of-firing coding of natural visual stimuli in primary visual cortex.
Curr Biol 18:375–380.CrossRef Medline
Nicolelis MA, Ghazanfar AA, Faggin BM, Votaw S, Oliveira LM (1997) Re-constructing the engram: simultaneous, multisite, many single neuron
recordings. Neuron 18:529 –537.CrossRef Medline
Panzeri S, Treves A (1996) Analytical estimates of limited sampling biases in
different information measures. Network 7:87–107.CrossRef
Panzeri S, Petersen RS, Schultz SR, Lebedev M, Diamond ME (2001) The role of spike timing in the coding of stimulus location in rat somatosensory cortex.
Neuron 29:769 –777.CrossRef Medline
Panzeri S, Senatore R, Montemurro MA, Petersen RS (2007) Correcting for the sampling bias problem in spike train information measures. J
Neuro-physiol 98:1064 –1072.CrossRef Medline
Petersen RS, Panzeri S, Diamond ME (2001) Population coding of stimulus
location in rat somatosensory cortex. Neuron 32:503–514.CrossRef
Medline
Picton TW, Hillyard SA (1974) Human auditory evoked potentials. II: ef-fects of attention. Electroencephalogr Clin Neurophysiol 36:191–199.
CrossRef Medline
Piette CE, Baez-Santiago MA, Reid EE, Katz DB, Moran A (2012) Inactiva-tion of basolateral amygdala specifically eliminates palatability-related information in cortical sensory responses. J Neurosci 32:9981–9991.
CrossRef Medline
Privman E, Fisch L, Neufeld MY, Kramer U, Kipervasser S, Andelman F, Yeshurun Y, Fried I, Malach R (2011) Antagonistic relationship between gamma power and visual evoked potentials revealed in human visual
Ray S, Maunsell JH (2011) Different origins of gamma rhythm and
high-gamma activity in macaque visual cortex. PLoS Biol 9:e1000610.CrossRef
Medline
Sadacca BF, Rothwax JT, Katz DB (2012) Sodium concentration coding gives way to evaluative coding in cortex and amygdala. J Neurosci 32:
9999 –10011.CrossRef Medline
Samuelsen CL, Gardner MP, Fontanini A (2012) Effects of cue-triggered
expecta-tion on cortical processing of taste. Neuron 74:410–422.CrossRef Medline
Scalera G (2000) Taste preference and acceptance in thirsty and dehydrated
rats. Physiol Behav 71:457– 468.CrossRef Medline
Scheffer-Teixeira R, Belchior H, Lea˜o RN, Ribeiro S, Tort AB (2013) On
high-frequency field oscillations (⬎100 Hz) and the spectral leakage of
spiking activity. J Neurosci 33:1535–1539.CrossRef Medline
Schneidman E, Bialek W, Berry MJ 2nd (2003) Synergy, redundancy, and independence in population codes. J Neurosci 23:11539 –11553.
Medline
Telenczuk B, Baker SN, Herz AV, Curio G (2011) High-frequency EEG co-varies with spike burst patterns detected in cortical neurons. J
Neuro-physiol 105:2951–2959.CrossRef Medline
Tort AB, Fontanini A, Kramer MA, Jones-Lush LM, Kopell NJ, Katz DB (2010) Cortical networks produce three distinct 7–12 Hz rhythms during single sensory responses in the awake rat. J Neurosci 30:4315– 4324.
CrossRef Medline
Yamamoto T, Matsuo R, Kiyomitsu Y, Kitamura R (1989) Taste responses of cortical neurons in freely ingesting rats. J Neurophysiol 61:1244 –1258.