UNIVERSIDADE FEDERAL DO RIO GRANDE DO NORTE PROGRAMA DE PÓS-GRADUAÇÃO EM NEUROCIÊNCIAS
STEFANO PUPE
EX UNO PLURES: ON THE USE OF TRANSGENIC MICE AND
OPTOGENETICS TO CHARACTERIZE GENETICALLY DEFINED
SUBPOPULATIONS OF NEURONS
TESE
Catalogação da Publicação na Fonte Universidade Federal do Rio Grande do Norte – UFRN Catalogação de Publicação na Fonte. UFRN - Biblioteca Setorial do Instituto do Cérebro
P985u Pupe, Stefano.
On the use of transgenic mice and optogenetics to characterize genetically defined subpopulations of neurons / Stefano Pupe. - Natal, 2015.
163f: il.
Tese (Doutorado em Neurociências). Universidade Federal do Rio Grande do Norte. Orientador: Profº. Dr. Richardson Naves Leão.
1. Neurociências - Dissertação. 2. Optogenética. 3. Área tegmental ventral. 4. Núcleo Subtalâmico. 5.
Subpopulacões de neurônios identificadas geneticamente. I. Título
STEFANO PUPE
EX UNO PLURES: ON THE USE OF TRANSGENIC MICE AND
OPTOGENETICS TO CHARACTERIZE GENETICALLY DEFINED
SUBPOPULATIONS OF NEURONS
Tese apresentada copo reqrisito parcial à obtenção do títrlo de Dortor ep Nerrociências, do Prograpa de Pós-Gradração ep Nerrociências, da Universidade Federal do Rio Grande do Norte.
Orientador: Prof. Dr. Richardson Naves Leão
Co-orientador: Åsa Wallén-Mackenzie
Introduction ... 5
Paper I- Beyond Dopamine, GABA and Glutamate: Cre-driven optogenetics in the heterogeneous VTA ... Introduction ... 16
Conclusions... 24
Paper II - A subpopulation of cells in the VTA sends excitatory afferents to the Nucleus Accumbens Medial Shell and induces aversion ... Introduction ... 29
Figures ... 36
Supporting Information ... 50
Paper III - Limiting glutamate transmission in a Vglut2-expressing subpopulation of the subthalamic nucleus is sufficient to cause hyperlocomotion ... Introduction ... 57
Supporting Information ... 63
Paper IV - Stimulation of OLM cells induces theta oscillations and theta-gamma coupling in the ventral hippocampus ... Introduction ... 75
Figures ... 99
Supporting Information ... 110
Discussion ... Paper I ... 134
Paper II ... 136
Paper III ... 137
Paper IV ... 141
Conclusion ... 143
1 Resumo
Ex Uno Plures: Sobre o uso de camundongos transgênicos e optogenética para caracterizar populações de neurônios identificadas geneticamente
Os neurocientistas tem uma diversidade de perspectivas com as quais podem classificar diferentes partes do cérebro. Com o surgimento de técnicas baseadas na genética, como a optogenética, se torna cada vez mais importante identificar se um grupo de células, definidas através de morfologia, função ou posição anatômica possui um padrão característico de expressão de um ou mais promotores genéticos. Isso permite melhores formas de estudar essas populações de neurônios definidas geneticamente. Neste trabalho, eu apresento uma discussão teórica e três estudos experimentais nos quais essa foi a principal questão sendo abordada. O Estudo I discute as questões envolvidas em selecionar um promotor para estudar estruturas e subpopulações na área tegmental ventral. O Estudo II caracteriza uma subpopulação de células na área tegmental ventral que compartilha a expressão do promotor TRPV1, que é anatomicamente muito restrita e que induz aversão quando estimulada. O Estudo II utiliza uma estratégia similar para investigar a subpopulação no núcleo subtalâmico que expressa PITX2 e VGLUT2 que, quando inativada, causa hiperlocomoção. O Estudo IV explora o fato de que um grupo de células previamente identificadas no Hipocampo Ventral expressa CHRNA2, e indica que essa subpopulação pode ser necessária e suficiente para o estabelecimento do ritmo teta (2-8 Hz) no Hipocampo Ventral de camundongos anestesiados. Todos esses estudos foram guiados pela mesma estratégia de identificar um promotor genético capaz de permitir o controle de uma população de neurônios identificada geneticamente, e eles demonstram as diferentes formas pelas quais essa abordagem pode generar novas descobertas.
2 Abstract
Neuroscientists have a variety of perspectives with which to classify different parts of the brain. With the rise of genetic-based techniques such as optogenetics, it is increasingly important to identify whether a group of cells, defined by morphology, function or anatomical location possesses a distinct pattern of expression of one or more genetic promoters. This allows for better ways to study these genetically defined subpopulations of neurons. In this work, I present a theoretical discussion and three experimental studies in which this was the main question being addressed. Paper I discusses the issues involved in selecting a promoter to study structures and subpopulations in the ventral tegmental area. Paper II characterizes a subpopulation of cells in the ventral tegmental area that shares the expression of the TRPV1 promoter and is anatomically very restricted, and induces aversion when stimulated. Paper III utilizes a similar strategy to investigate a subpopulation in the subthalamic nucleus that expresses PITX2 and VGLUT2 which, when inactivated, causes hyperlocomotion. Paper IV exploits the fact that a previously identified group of cells in the ventral hippocampus expresses CHRNA2, and indicates that this population may be necessary and sufficient for the establishment of the theta rhythm (2-8 Hz) in the local field potential of anesthetized mice. All of these studies were guided by the same strategy of characterizing and studying the role of a genetically defined subpopulation of cells, and they demonstrate different ways in which this approach can generate new discoveries.
3 Acknowledgements
The last four years have been an amazing adventure. Setting sail to the warm beaches of Natal, I ended up in the freezing plains of Uppsala. The tortuous path that led me here was filled with big plans and small victories, predictable disappointments and unexpected fulfillment. Above all, I'm glad to say, I have found happiness, and this busy period was intensely satisfying. These four adventurous years will forever be part of me, and I would like to acknowledge some of the people who composed the tapestry of my life during that period.
Throughout this journey, Edward showed me a path amidst the storm. Richardson taught me what it means to truly enjoy the waves of uncertainty. Åsa gave me a sturdier boat. In short, thank you Edward, for giving me a reason to do science. Richardson, for giving me a chance to do it. Åsa, for giving me the support and means to make that a reality.
Uppsala is a small city with few attractions. Its secret lies in the remarkable people who choose to live in it. In the lab, my closest companions were Sanja and Julia, both short in physical stature but intellectual giants, on whose shoulders I have stood upon in many occasions. I have also learned a lot from, and am indebted to Emma, Thomas and Nadine, from Team ÅsaM, and Hermany, Markus, Ernesto and Kia, from Richardson's group. I thank each one of them for what we have experienced and accomplished together. There were also those other friends, from inside or outside work, who were the closest thing I had to a family in Uppsala. The list is large, and leaving names out is unfair, but some people deserve special recognition: Ninnie, Fabio, Pavol, Vincent, Arthur and recently Edda. Thank you all for making it worth it, you helped me more than you know.
In every journey, landmarks are crucial to keep track of the way you're going. My family and closest friends were lighthouses, showing me the way in both good and bad times. My parents, Beth and Silvio, my grandmother Ilza, my brother Gian and his fiancée Ana, "aunt" Rosa and my friends Rafael and Ricardo from Brazil, you were the points of reference that every journey needs. I cherished every fleeting moment that I had with you in the past years, and I always had you in my mind. Obrigado.
4 "(...) objects are distinguished and known by classifying them methodically and giving them appropriate names.
Therefore, classification and name-giving will be the foundation of our science.” - Carl Linnaeus (1707, Räshult-1778, Uppsala)
5 Introduction
As with many other scientific fields, the history of Neuroscience can be understood from the perspective of its techniques. The early pioneers had little more than a microscope and a few staining methods at their disposal, and yet they identified a myriad of brain regions and cell types, distinguishable by their appearance. Their ingenuity, however, was limited by what was achievable with those tools. The challenge of our time, as it was in theirs, is to push the techniques currently available to their limit, and to work to invent innovative perspectives that can stretch the frontiers of our field even further.
Our work is made easier because we stand on discoveries that were firmly established by our predecessors. We now understand that the cell types illustrated by Ramon y Cajal and Golgi carry incredible complexity within them. A neuron can be characterized today not only by its location and morphology, but by its receptors, neurotransmitters, neuropeptides, electrophysiological profile, projections, presynaptic connections and also by what role it plays into a larger outcome, such as behavior.
Underlying all this diversity is DNA, the fundamental building block of biology. Every single one of the characteristics described above must ultimately be regulated by genes. The remarkable similarity among brains of the same species is a testament to the powerful influence of the genetic code in shaping the anatomical structures that our predecessors have recognized. Our brains are a result of the interaction that exists between the immutable letters of our genes, and the changing vocabulary of the environment.
6 Since any cellular action must inevitably be mediated by DNA directly or indirectly, and given that any classification of neurons will rely upon one of its characteristics, it follows that genetics may also be used as a tool for distinguishing among different groups of neurons. While every cell in the brain contains the same genetic information, only part of it is expressed in each one of them, and genetic expression itself is the action that will define a neuron's characteristics.
A genetically defined neuronal subpopulation, in the meaning that will be utilized in this work, can be defined as a group of neurons that expresses the same gene or set of genes. This seems straightforward at first. For example, in order to produce a neurotransmitter such as dopamine, a cell will need to express genes that allow it to do so. Therefore, we could categorize all cells that produce the “dopamine gene” as a genetically defined subpopulation. The first complication to arise is that there is no “dopamine gene”; the dopamine molecule is built in several steps. L-Phenylalanine is processed into L-Tyrosine, which then becomes L-Dopa, which can be converted into dopamine with the addition of another amino acid. During this process, the expression of many genes was required, and could be potential targets. However, if we choose one of those at random, we risk being unspecific, and picking a gene that is also expressed in cells that don't produce dopamine.
As is often the case, a compromise is the best solution. All dopaminergic cells contain the enzyme Tyrosine Hydroxylase (TH), which converts L-Tyrosine to L-Dopa. While not entirely unique, because TH and dopamine itself are also found in adrenergic cells, it is very specifically confined to a well-defined group of neurons within the ventral midbrain. So, the expression of TH, or more specifically the activation of the promoter sequence upstream of the gene that encodes for the production of tyrosine hydroxylase – or, in short, the TH promoter, as these instances will be addressed from here on forward -, can be used as a marker for the dopaminergic population.
7 parvalbumin promoter is used to identify a subpopulation of fast-spiking interneurons, composed of a few different cell types (Somogyi & Klausberger, 2005). The role of parvalbumin in these cells is not known, but its restricted pattern of expression is still useful as a way to group them.
At this point, we might feel inclined to ask: why, then, categorize with genetics? Is it not enough to categorize neurons by their characteristics, such as the neurotransmitters being released? The first aspect to consider is that genetics allows for more refined categories. There is a considerable diversity within the population of dopaminergic neurons, for instance. It has been established that different groups of cells project to the medial prefrontal cortex and the nucleus accumbens (Lammel et al., 2008). Some display a hyperpolarization-activated current which, for some time, has been considered a hallmark of all dopaminergic neurons, but we now know that this is not the case (Margolis et al., 2006). Most of the neurons that release dopamine in the ventral tegmental area (VTA) are more active when a rewarding stimulus – or, after learning, a stimulus that predicts a reward - is presented (Schultz, 2007), but a few of them do the opposite, showing inactivity during rewards and more activity during aversive stimuli (Brischoux et al., 2009; Cohen et al., 2012). In this case, it would seem that classifying a neuron as dopaminergic might be imprecise, given their variability. As mentioned before, genetics must play a role in establishing these differences, so there might be a way to target each type of dopaminergic neuron by choosing different genes, resulting in a more refined classification.
A second answer to the question of why we should use categorization based on genetics is that we now have tools that can give us very precise and refined ways to manipulate groups of neurons. These techniques, which will be introduced in detail below, can distinguish subpopulations by their genetic expression, being enabled only in subsets of cells that activate a targeted promoter. Identifying useful ways to categorize neurons according to patterns of genetic expression, then, becomes not only an exercise in neuronal taxonomy and genetics, but also a practical way to study them. As these techniques rely heavily on the use of transgenic animals, the first step is to understand how they are created and used.
8 The world’s first genetic mammal was generated in 1974, by Rudolf Jaenisch and Beatrice Mintz (Jaenisch & Mintz, 1974). As a proof-of-concept, they exposed mouse blastocysts to viruses, and found that they could read parts of the viral DNA sequence from the adult animals’ genome sequences. This basic strategy of introducing a mutation into an embryo is still a fundamental part of how transgenic animals are generated, but now other methods are used to perform that.
Transgenic animals used in research can be divided into four groups: knockouts, knockins, reporter and recombinant lines. The first two are aimed at eliminating or increasing the expression of a gene, respectively. Reporter lines append the sequence of a protein, sometimes fluorescent, at the end of a promoter sequence, so that every cell that expresses that promoter can be more easily identified. Finally, recombinant lines are those in which conditional manipulations can be performed, and these are slightly more complex.
The idea behind recombinant lines is to use two or more lines that can interact with each other, accomplishing different results in each scenario. To achieve that, "key" and "lock" combinations of lines are used, the most popular being the Cre-lox recombinase system (Nagy, 2000). The Cre enzyme interacts with lox sequences according to their location and orientation, being able to cut or flip parts of the genome that are situated in between (floxed by) lox sequences. Recombinant lines that use this system include a Cre sequence appended to a promoter, while the lox sites are introduced in the sides of a sequence that will be flipped or excised in the presence of Cre.
Separate mouse lines are used for Cre and lox. Attaching a a Cre sequence to the TH promoter, for instance, will theoretically cause Cre to be produced only in cells that also express TH. This TH-Cre line then can interact with multiple lox lines, to achieve different results. If lox sequences are introduced beside a gene that is crucial for a cell's survival, crossing this lox line with the TH-Cre line will cause the death of all cells that express TH. This logic is the basis of how Lox lines can be used to mediate the expression of reporters and to produce conditional knockins and knockouts.
9 dopamine transporter (DAT) gene was disrupted (Giros, Jaber, Jones, & Mark, 1996). As we now know, the protein produced by this gene recaptures dopamine from the synaptic cleft, and it is a target of drugs of abuse such as cocaine and amphetamine. The DAT-KO offered additional evidence for that, given that the knockout mice did not respond to these drugs, and were naturally hyperactive.
Several different knockout lines have been produced, and continue to be used in our field today. Their major limitation is that not all genes can be knocked out without causing major developmental problems, or death. When the vesicular glutamatergic transporter type 2 (VGLUT2) gene is knocked out, for instance, mice cannot produce normal respiratory patterns, and die shortly after birth (Wallén-Mackenzie et al., 2006). To get around that limitation, researchers have introduced the use of knockouts that are inducible at a later stage in development, or that are confined to only one type of neuron.
This latter case is of particular interest to the discussion of genetically defined neuronal subpopulations, because the way in which these conditional knockouts are produced requires the choice of a promoter. While a widespread knockout of VGLUT2 in all cells is lethal, the deletion of this gene in some subpopulations may be studied with a conditional knockout. By inserting lox sequences that flank one of the exons of the VGLUT2 sequence, its expression will only be affected in cells that contain Cre. This, in turn, is defined by which transgenic line is chosen to cross with these VGLUT2-lox animals. One application of this has been to study the phenomenon of co-release in the VTA, where some cells that release dopamine also release glutamate. The conditional knockout of VGLUT2 within the DAT-Cre-expressing population of the ventral midbrain caused significant reductions in the release levels of both glutamate and dopamine and induced altered psychostimulant-induced behavioural activation as well as increased self-administration of cocaine and sugar (Birgner et al., 2010; Stuber, Hnasko, Britt, Edwards, & Bonci, 2010a; Hnasko et al., 2010; Alsiö et al., 2011; Fortin et al., 2012)
10 was devised when scientists working on algae uncovered a family of opsins that acted as membrane channels in these simple organisms. Characterizing some of these opsins, they found that, when exposed to light of certain wavelengths, they would change conformation and allow ions to flow through them (Nagel et al., 2002). Realizing the enormous potential in being able to control the flow of ions in neurons, they also transfected these opsins into cultured cells (Nagel et al., 2003). Subsequently, another group applied this technique in mammals with the use of a virus (Boyden, Zhang, Bamberg, Nagel, & Deisseroth, 2005), and since then a myriad of other experiments have beautifully illustrated its potential, which is still being expanded. This set of techniques is now known as optogenetics.
Optogenetics
A detailed description of the fundamental mechanism of optogenetics can be found elsewhere (Fenno, Yizhar, & Deisseroth, 2011). However, a brief introduction of its main concepts is necessary to contextualize readers unfamiliar with the technique, and to make its advantages understandable. In essence, optogenetics is based on the artificial expression of light-sensitive selective ionic channels in neuronal tissue. This, in turn, allows researchers to change the ionic concentration inside the cells – and thus its electrical potential, and probability to fire an action potential – by flashing light onto it.
In the most famous example, a protein called Channelrhodopsin-2 (ChR2), found in the algae Chlamydomonas reinhardtii, is introduced in mammalian neurons by infecting them with a virus. After a few days, this protein can be found in the cell membrane. When light of around 420-510 nm is detected in one of the compartments of the protein, it changes its conformation, allowing free transit of Na+ and other positive ions. Neurons in a resting state have a much lower internal concentration of Na+ ions than the extracellular medium, so when ChR2 is activated, these positive ions quickly enter the cells and depolarize them.
11 Neuronal excitation and inhibition were possible before, and routinely used in Neuroscience. Pharmacological interventions, such as the introduction of agonists and antagonists of neurotransmitters allowed a moderate degree of specificity, particularly when these drugs were introduced directly into the brain, via cannulas. Likewise, electrical stimulation was and still is widely used to stimulate a spatially restricted number of cells, with great temporal resolution. Knockout animals were produced to understand the importance of certain genes by inactivating them. The testament to the power of these techniques is that the first few papers using optogenetics that involved behavior were essentially replications of mechanisms uncovered by these earlier techniques, achieving similar results (Tsai, Zhang, Adamantidis, Stuber, Bonci, de Lecea, et al., 2009; Adamantidis et al., 2011)
However, these techniques also have drawbacks. Even the best, most specific drugs may inevitably bind to receptors they were not initially intended to bind with. Most importantly, the temporal resolution is very poor, with effects lasting for minutes to hours. Therefore, any mechanism or behavior that requires precise timing can only be evaluated through pharmacology with caution. Electrical stimulation offers a way to have sub-millisecond control of action potentials, but lacks the molecular, cell-type specificity afforded by drugs. When a block of tissue is given an electrical shock, all kinds of cells and projections that receive a powerful enough pulse will fire, with specificity limited mainly by distance (Tehovnik, 1996). In heterogeneous structures such as the VTA, which contains neurons that release γ-aminobutyric acid (GABA), glutamate or dopamine located closely together, electrical stimulation will activate them all. Besides, while knockout animals are very good at isolating the contribution of individual genes, their effect is usually chronic, non-reversible and widespread, meaning that when the animal has its gene for producing a certain protein inactivated, it will have that effect throughout its whole brain and body, permanently.
12 virus will be infected, but only those that naturally produce this promoter will have also produced ChR2.
Since adeno-associated viruses, a safe and commonly used class of viruses, have a limited size of base pairs that they can carry, this promoter-based strategy is commonly used in combination with the Cre-Lox recombination system. This works in a very similar way to the one described above, except that the promoter of choice is conjugated with the Cre sequence instead of the opsin itself. As introduced above, an animal that is part of the TH-Cre line will produce the Cre protein in every cell that naturally produces the Tyrosine Hydroxylase enzyme, which is found in most dopaminergic neurons. This contiguity is then exploited by infecting cells with a virus that has the sequence of choice, like ChR2, flipped and flanked by two Lox sequences. The virus will again infect every cell that comes in contact with it, but will only express ChR2 in cells that also expressed Cre, because this enzyme will interact with the Lox sites and flip the ChR2 sequence to the normal orientation. Still using the TH-Cre mouse as an example, if this animal then has a virus injected in a dopaminergic region such as the substantia nigra pars compacta, only the neurons that naturally produce TH and were infected with the virus will respond to light stimulation.
13 This method of light delivery also allows for one more exclusive advantage of optogenetics: its possible use as a tool to investigate axonal or dendritic projections. If a virus is injected in the hippocampus, it will infect cell bodies in this area and also its axonal projections, such as in the septal nuclei for instance. If a cannula is then implanted into this target area, it can be used to stimulate this projection exclusively. Combined with genetic specificity, this is a very useful characteristic that has been used in a variety of studies (Britt et al., 2012; Tritsch, Ding, & Sabatini, 2012; Stamatakis et al., 2013). Another technique consists in the use of retrograde viruses such as pseudorabies, which have the ability to jump across synapses once its separate components are expressed by the same cell (Watabe-Uchida et al., 2012).
The use of optogenetics has now become widespread, and new ways to exploit it are constantly being introduced. Its greatest strength, its ability to selectively target a group of neurons, directly relies on the choice of sequences that serve as promoters for the expression of opsins. Therefore, optogenetics is a technique that stands at the intersection of genetics and neuroscience; it relies on what we know about which genes are active in which kinds of neurons, and at which point. Just as the pioneers of our field were bound to what their stains and microscopes could distinguish, we now search ways to classify cells according to their genetic expression, for in this lies our chance of achieving more and more specificity.
Objective
The objective of this thesis is to contribute to the deepening integration between genetics and neuroscience by exploring the use of new promoters to facilitate the classification of subpopulations of neurons. These genetically defined subpopulations are quickly becoming key components in our ability to understand the brain and further refine its component parts. The recent prominence of techniques such as optogenetics, which allow for precise and reversible control of these genetically defined subpopulations, underscore the importance of identifying them.
15 Paper 1: Cre-Driven Optogenetics in the Heterogeneous Genetic Panorama of the VTA Authors:Stéfano Pupe, Åsa Wallén-Mackenzie
28 Paper 2: A subpopulation of cells in the VTA sends excitatory afferents to the Nucleus Accumbens Medial Shell and induces aversion
Authors:Stéfano Pupe *, Julia Pedersen *, Thomas Viereckel, Malin Lagerström, Richardson N Leão, Åsa Wallén-Mackenzie (*Equal contribution)
29 A subpopulation of cells in the VTA sends excitatory afferents to the Nucleus
Accumbens Medial Shell and induces aversion
Stéfano Pupe1,2 *, Julia Pedersen1,*, Thomas Viereckel1, Malin Lagerström1, Richardson N Leão1,2, Åsa Wallén-Mackenzie1,#
1. Unit of Developmental Genetics, Department of Neuroscience, Uppsala University, Sweden.
2. Brain Institute, Federal University of Rio Grande do Norte, Natal-RN, Brazil. *Equal contribution, #Corresponding author
We have identified a promoter, associated with the TRPV1 gene, that is exclusively
expressed in the VTA within the midbrain. Optogenetic stimulation of the cell bodies of
this subpopulation produces aversion in a place preference task, an effect that is even
stronger when stimulation is directed towards fibers located in the Nucleus Accumbens
Medial Shell (mAcbSh). By using electrophysiology and immunohistochemistry, we were
able to verify that the activation of these fibers has an overall excitatory effect. Unlike
previously believed, VTA-mAcbSh projections can mediate not only reward but also
aversion.
30 prediction2 has been confirmed and extended with recent findings afforded by optogenetics and
Cre-lox transgenics. Selective activation of dopaminergic cells induces self-stimulation and place preference3, and some of the areas that project to the VTA, such as the laterodorsal
tegmentum4 and dorsal raphe5, can mediate this effect by interacting with the dopaminergic neurons, producing similar behavioral results.
Interestingly, the VTA can also be directly responsible for the opposite effect, which has been broadly denominated as aversion. The gabaergic population of the VTA causes a decrease in the firing of neighboring dopaminergic neurons, induces place aversion6 and disrupts reward
consumption7 when selectively stimulated with optogenetics. It has also been shown that glutamatergic neurons of the VTA that project to the lateral habenula can induce aversion as well8.
This intricate circuitry becomes even more complex when one considers the subpopulations of neurons that have already been identified within the VTA, which are not characterized simply by one neurotransmitter. Dopaminergic neurons, previously believed to be homogeneously defined by the presence of an inward-rectifying current (Ih), have heterogeneous electrophysiological responses9. Furthermore, the VTA contains at least three
subpopulations of neurons that co-transmit Dopamine-Glutamate 10, Dopamine-GABA 11, or GABA-Glutamate 12 , on top of neurons that only release one of these neurotransmitters. This
complexity, combined with the limitation that many of the aforementioned optogenetic studies rely on the use of broadly expressed promoters such as TH, GAD or VGLUT2, which are present in structures contiguous to the VTA, suggests that more precision is still desirable when defining what group of neurons is being observed or manipulated.
31 characterization of subpopulations of neurons within this area. We addressed this by performing a microarray analysis at postnatal day (PND) 3. The VTA and SNc areas of DAT-Cre/Tom mice were independently dissected (Fig 1A). One of the genes identified as a possible candidate for an exclusive marker for the VTA was the Transient Receptor Potential Cation Channel member 1 (TRPV1) (Fig 1B). This exclusivity was confirmed via an in situ hybridization, where TRPV1 was found to be selectively expressed in a subgroup of neurons
within the medial area of the VTA, but excluded from the lateral VTA and the SNc (Fig 1C). TRPV1 was also present in the midbrain during development (E 14)(Fig S1). The expression of Cre in a previously available TRPV1-Cre mouse line13 preserves this pattern of specificity (Fig 1D). We quantified the extent of co-localization between Cre expression in this TRPV1-Cre line expression with that of TH, VGLUT2 and GAD at two different rostro-caudal levels of the VTA in an adult animal. The results show that cells that expressed Cre mRNA (identified by crossing TRPV1-Cre with a TOMATO reporter line) express markers for all three neurotransmitters of the VTA - TH, GAD and VGLUT2 -, with a predominance for VGLUT2 (Fig 2). Therefore. most neurons that express Cre are glutamatergic.
32 suggesting this population represented a much smaller percentage of cells of the VTA than the one associated with the DAT promoter.
To determine the possible behavioral role of this subpopulation and this particular projection, we implanted fiber cannulas unilaterally above the VTA and mAcbSh at the same coordinates in TRPV1-Cre and DAT-Cre mice. While DAT-Cre animals learned to perform a self-stimulation task in which each nose-poke induced a brief (1s, 20 Hz, 5 ms) optical stimulation in the VTA, the TRPV1-Cre did not do so, and behaved in the same way as the controls injected with an inert virus (Fig 3C). We then decided to test the opposite, and see if they would learn to nose-poke for turning off the optical stimulation instead; they did so (Fig 3D), suggesting that the stimulation of the TRPV1 population in the VTA was aversive. This conclusion was strengthened by a real-time place-preference task, in which the mice received stimulation when they stepped into certain quadrants of the rectangular apparatus (Fig 3E). TRPV1-Cre animals, however, did the opposite, preferring to stay in the nonstimulated side for the majority of time (Fig 3F). This avoidance behavior was observed through a period of 4 consecutive days, in the middle of which the stimulated quadrants were switched around, suggesting that the results are not simply due to an invariant preference for a particular spatial location.
We tested the stimulation of the mAcbSh projections with ChR2 (Fig 4A). The behavioral results we observed when directly stimulating the VTA of the TRPV1-Cre were even stronger when stimulation was directed at the mAcbSh. The TRPV1-Cre developed a strong and consistent aversion to the stimulation of the mAcbSh, unlike the controls, which showed no place preference (Figs 4B).
33 performed experiments to determine which neurotransmitter was involved in this behavioral effect. Immunohistochemical detection of the immediate early gene c-fos in animals that had received optical stimulation in the mAcbSh 90 minutes before sacrifice showed an increase in the number of activated cells in the stimulated side, but not in the opposite one (Fig 4C). Next, through whole-cell patch clamp electrophysiology in mAcbSh slices of TRPV1-Cre/ChR2 animals, we identified that for almost half of medium spiny neurons, an EPSP could be evoked by optical stimulation (Fig 4D). This EPSP was unaltered when an NMDA receptor antagonist (AP-5, 50 µM) was added to the bath, but completely disrupted when an AMPA antagonist (NBQX, 10 µM) was further included (data not shown). These results establish that glutamate is being released by optogenetic stimulation in the mAcbSh, which could be involved in the aversive behavior.
We have also attempted to determine what would happen if these cells were inhibited, instead of stimulated. A group of TRPV1-Cre mice was injected with an AAV2-EF1a-DIO-eArch3.0-EYFP virus, and received cannulas above the VTA and the mAcbSh. The inhibition produced by green light in either of these areas did not induce any place preference or aversion (Figs S4, S5). We designed another experiment to test whether the stimulation of TRPV1+ cells was producing aversion through hunger, given the contiguity of feeding-related areas to the VTA, and previous reports linking the mAcbSh to food consumption17. After an acute period of
food restriction, light stimulation did not affect the amount of food consumed by the animals (Fig S6).
34 knowledge to this literature by pointing out the role of glutamatergic projections from VTA to mAcbSh, which had been previously identified 15 but not functionally characterized.
We believe that the subpopulation characterized here can serve as a tool for further studies, given its unique ability to be utilized with conditional knockouts or other genetic manipulations that would otherwise affect a much larger and indiscriminate population when combined with the promoters mentioned above. Moreover, the contribution of the TRPV1 receptor to the effects we observed remains to be determined.
References
1. Olds, J. Self-stimulation of the brain its use to study local effects of hunger, sex, and drugs. Science 127, 315–324 (1958).
2. Schultz, W., Dayan, P. & Montague, P. R. A neural substrate of prediction and reward. Science 275, 1593–1599 (1997).
3. Tsai, H.-C. et al. Phasic Firing in Dopaminergic Neurons Is Sufficient for Behavioral Conditioning. Science 324, 1080–1084 (2009).
4. Lammel, S. et al. Input-specific control of reward and aversion in the ventral tegmental area. Nature 491, 212–217 (2012).
5. Liu, Z. et al. Dorsal Raphe Neurons Signal Reward through 5-HT and Glutamate. Neuron 81, 1360–1374 (2014).
6. Tan, K. R. et al. GABA neurons of the VTA drive conditioned place aversion. Neuron 73, 1173–1183 (2012).
7. Van Zessen, R., Phillips, J. L., Budygin, E. A. & Stuber, G. D. Activation of VTA GABA Neurons Disrupts Reward Consumption. Neuron 73, 1184–1194 (2012). 8. Root, D. H., Mejias-Aponte, C. A., Qi, J. & Morales, M. Role of Glutamatergic
Projections from Ventral Tegmental Area to Lateral Habenula in Aversive Conditioning. J. Neurosci. 34, 13906–13910 (2014).
9. Margolis, E. B., Lock, H., Hjelmstad, G. O. & Fields, H. L. The ventral tegmental area revisited: is there an electrophysiological marker for dopaminergic neurons? J.
Physiol. 577, 907–924 (2006).
10. Yamaguchi, T., Wang, H.-L., Li, X., Ng, T. H. & Morales, M. Mesocorticolimbic glutamatergic pathway. J. Neurosci. 31, 8476–8490 (2011).
11. Tritsch, N. X., Ding, J. B. & Sabatini, B. L. Dopaminergic neurons inhibit striatal output through non-canonical release of GABA. Nature 490, 262–266 (2012). 12. Root, D. H. et al. Single rodent mesohabenular axons release glutamate and GABA.
35 13. Lagerström, M. C. et al. VGLUT2-dependent sensory neurons in the TRPV1
population regulate pain and itch. Neuron 68, 529–542 (2010).
14. Ikemoto, S. Dopamine reward circuitry: two projection systems from the ventral midbrain to the nucleus accumbens–olfactory tubercle complex. Brain Res. Rev. 56, 27–78 (2007).
15. Stuber, G. D., Hnasko, T. S., Britt, J. P., Edwards, R. H. & Bonci, A. Dopaminergic Terminals in the Nucleus Accumbens But Not the Dorsal Striatum Corelease Glutamate. J. Neurosci. 30, 8229–8233 (2010).
16. Britt, J. P. et al. Synaptic and Behavioral Profile of Multiple Glutamatergic Inputs to the Nucleus Accumbens. Neuron 76, 790–803 (2012).
17. Reynolds, S. M. & Berridge, K. C. Glutamate motivational ensembles in nucleus accumbens: rostrocaudal shell gradients of fear and feeding. Eur. J. Neurosci. 17, 2187–2200 (2003).
36 Figure 1: Expression of TRPV1 is anatomically restricted to the VTA. (A) The VTA and
37 Figure 2: The subpopulation of cells expressing Cre in a TRPV1-Cre mouse line is
39 Figure 3: Activation of the TRPV1+ population in the VTA is aversive. (A)
41 Figure 4: TRPV1+ cells send excitatory projections to the mAcbSh, and activation of these
42 Supplementary Information - A subpopulation of cells in the VTA sends excitatory
afferents to the Nucleus Accumbens Medial Shell and induces aversion
Materials and Methods
Three different mouse lines were used in this study: TRPV1-Cre, from Dr. Malin Lagerström (Lagerström et al., 2010), DAT-Cre (Bäckman et al., 2006) and TOMATO-lox (Madisen et al., 2010) (B6;129S6-Gt(ROSA)26Sortm9(CAG-tdTomato)Hze/J, stock number 007905 from Jax Mice). For the identification of the SNc and VTA, heterozygous DAT-Cre mice were crossed with homozygous TOMATO animals, generating DAT-TOMATO-Cre offspring. For performing recordings of juvenile TRPV1-Cre mice, this line was crossed with a TOMATO line as well. Heterozygous TRPV1-Cre and DAT-Cre animals were used for all other experiments. All mice used in the study were housed in accordance with the Swedish regulation guidelines and European Union legislation. Ethical approval was obtained from the Uppsala Animal Ethical Committee for all studies.
Tissue preparation
Newborn TRPV1-Cre mice (Postnatal Day 3) were cryoanesthetized and their brains subsequently obtained and placed directly into ice-cold artificial CSF (ACSF) (125mM NaCl, 25mM NaHCO3, 2.5mM KCl, 1.25mM NaH2PO4, 2mM CaCl2, 2mM MgCl2, and 23mM
glucose) saturated in 95% O2 / 5% CO2. Horizontal brain slices (200M thick) were sectioned
43 equipped with an Alexa-594 filter. Dissected tissue sections were transferred to 1.5mL eppendorf tubes and snap frozen on dry ice.
RNA extraction
Individual tissue samples were lysed and homogenized in RLT buffer supplemented with beta-mercaptoethanol by vigorously pipetting up and down. Total RNA was then extracted using the Qiagen RNeasy Mini Kit according to the manufacturer’s instructions (Qiagen, Sweden). For Q-PCR analysis an additional on column DNase treatment step was included, followed by the RNA quality being confirmed by agarose gel electrophoresis and the concentration determined using a Nanodrop ND-1000 Spectrophotometer (NanoDrop Technologies, Wilmington, DE).
Microarray expression analysis
44 Santa Clara, CA) the arrays were then washed and stained using the Fluidics Station 450 and finally scanned using the GeneChip® Scanner 3000 7G.
Microarray statistical analysis
The raw data was normalized in the free software Expression Console provided by Affymetrix using the robust multi-array average (RMA) method first suggested by Li and Wong (Li & Wong, 2001; Irizarry et al., 2003). Subsequent analysis of the gene expression data was carried out in the freely available statistical computing language R (http://www.r-project.org) using packages available from the Bioconductor project (www.bioconductor.org). In order to search for the differentially expressed genes between the SN and the VTA groups, an empirical Bayes moderated paired t-test was then applied (Smyth, 2004), using the ‘limma’ package (Smyth, 2005). To address the problem with multiple testing, the p-values were adjusted using the method of Benjamini and Hochberg (Benjamini & Hochberg, 1995).
45 Immunohistochemistry
Standard immunohistochemical procedures were used: primary antibodies were dilluted in PBS and the tissues were incubated for 24h, after which they were washed and incubated with a secondary antibody for 1h. The concentration of primary antibodies was the following: VGLUT2 (anti-guinea pig, Millipore art nr AB2251) at 1:5000, TH (anti-mouse, Millipore art nr MAB318) at 1:1000, GFP rabbit, Abcam, art nr ab6556) at 1:1000 and c-fos (anti-goat, Santa Cruz, art nr sc52G) at 1:400. Mouse coronal cryosections (20 μm-thick) were used.
In situ hybridization
This technique was performed as previously described (Wallén-Mackenzie et al., 2006) using antisense oligonucleotide probes for detection of Vglut2 (two independent probes, one composed of a mix of 3 oligonucleotides (NM_080853.3: bases 13-47 (exon1); bases 872-908 (exon 1,2); bases 3220-3254 (exon 12)) and a second probe specific for exon 5 (bases: 1432-1464)) mRNA, respectively, TH (mix of 3 oligonucleotides NM_009377.1: bases 272-305; 774-807; 1621-1655), GAD (NM_008077.4: 629-663; 1936-1970; 2308-2342) and TRPV1 (NM_OO1001445.1, bases 1-2518). Overlaid images (Fujifilm BioImaging Analyzer BAS-5000) corresponding to adjacent sections hybridized with the probes were displayed.
Surgeries
46 the tip ending at the first coordinate listed above. In case the animals also received stimulation in the mAcbSh, another fiber was placed at +1.34 AP, -0.6 ML and -3.8 DV. Fibers were held in place with dental cement.
Slice electrophysiology
TRPV1-Cre mice (postnatal days 10–21 for TRPV1-TOMATO recordings, postnatal days 75-100 for TRPV1-Cre injected with ChR2) were decapitated and the brains placed in ice-cold artificial corticospinal fluid (ACSF) and 250μm-thick coronal slices containing the ventral midbrain or the nucleus accumbens. Slices were kept in a submerged holding chamber containing ACSF (92 mM NMDG, 2.5 mM KCl, 1.25 mM NaH2PO4, 30 mM NaHCO3, 20
mM HEPES, 25 mM glucose, 2 mM thiourea, 5 mM Na-ascorbate, 3 mM Na-pyruvate, 0.5 mM CaCl2·4H2O and 10 mM MgSO4·7H2O, at a pH of 7.3-7.4) (Ting, Daigle, Chen, & Feng,
2014) , constantly bubbled with 95% O2 and 5% CO2, incubated at 35°C for 1h, and then allowed to cool to room temperature. Recording pipettes (3 to 5MΩ) were filled with a K-gluconate-based internal solution (130 mmol/l K-gluconate, 7 mmol/l NaCl, 0.1 mmol/l EGTA, 10 mmol/l HEPES, 0.3 mmol/l Mg2Cl, 2 mmol/l MgATP, 0.5 mmol/l Na2GTP, pH
47 averaged for baseline, and after each drug). For recordings in the VTA, 20 ms pulses at 10, 20 or 40 Hz, lasting for 3 seconds, were utilized.
Behavioral testing
Self-stimulation (turning on the light): after a week of handling and two days of being exposed to the apparatus, mice were introduced to the self-stimulation task. Two levers were available throughout the 30 minutes of testing. By pressing one of them, the animals received 1 second of 473-nm laser (CNI laser) stimulation of 30 mW, measured with a light power meter (PM100D, Thorlabs). The stimulation consisted of 5ms pulses, delivered at 20Hz. Each active lever press also turned on a small light above the active lever, which remained on during the period of stimulation. No consequence followed the pressing of the other lever. The results presented are from the last (8th) day of consecutive testing.
Self-stimulation (turning off the light): a separate group of animals went through similar handling and habituation procedures, in the same apparatus. Here, instead, light was continuously delivered (pulses of 5ms, 20Hz, 15mW) throughout the whole 30 minutes session. When the mouse pressed the active lever, the stimulation was turned off for 20 seconds, and a light and sound stimulus were turned on for the first three seconds after nose-poking. Results are from last (7th) day of consecutive testing.
48 when it detected its presence in one of the designated quadrants for stimulation. In the third day of testing, these quadrants were switched (Fig 2E), to test if the animal would change its behavior according to light stimulation, or if it simply preferred one of the sides. Results are presented as a preference ratio, derived from the following formula: (time spent in quadrants with light stimulation - time spent in quadrant without light stim)/total time.
Food consumption: After a week of habituation in the behavior apparatus, animals injected with ChR2 or an inert virus were weighed and food restricted for 24 hours. At the end of this period, they were individually put into the apparatus with free access to food and water. There, they received 45 minutes of continuous stimulation in either the VTA or mAcbSh. The weight of the remaining food was measured and compared between groups.
Supplementary References
Bäckman, C. M., Malik, N., Zhang, Y., Shan, L., Grinberg, A., Hoffer, B. J., … Tomac, A. C. (2006). Characterization of a mouse strain expressing Cre recombinase from the 3′ untranslated region of the dopamine transporter locus. Genesis, 44(8), 383–390. Benjamini, Y., & Hochberg, Y. (1995). Controlling the false discovery rate: a practical and
powerful approach to multiple testing. Journal of the Royal Statistical Society. Series B (Methodological), 289–300.
Irizarry, R. A., Hobbs, B., Collin, F., Beazer-Barclay, Y. D., Antonellis, K. J., Scherf, U., & Speed, T. P. (2003). Exploration, normalization, and summaries of high density oligonucleotide array probe level data. Biostatistics, 4(2), 249–264.
Lagerström, M. C., Rogoz, K., Abrahamsen, B., Persson, E., Reinius, B., Nordenankar, K., … others. (2010). VGLUT2-dependent sensory neurons in the TRPV1 population
regulate pain and itch. Neuron, 68(3), 529–542.
Li, C., & Wong, W. H. (2001). Model-based analysis of oligonucleotide arrays: expression index computation and outlier detection. Proceedings of the National Academy of Sciences, 98(1), 31–36.
Madisen, L., Zwingman, T. A., Sunkin, S. M., Oh, S. W., Zariwala, H. A., Gu, H., … Zeng, H. (2010). A robust and high-throughput Cre reporting and characterization system for the whole mouse brain. Nature Neuroscience, 13(1), 133–140. doi:10.1038/nn.2467 Smyth, G. K. (2004). Linear models and empirical bayes methods for assessing differential
49 Smyth, G. K. (2005). Limma: linear models for microarray data. In Bioinformatics and
computational biology solutions using R and Bioconductor (pp. 397–420). Springer. Retrieved from http://link.springer.com/chapter/10.1007/0-387-29362-0_23
Ting, J. T., Daigle, T. L., Chen, Q., & Feng, G. (2014). Acute brain slice methods for adult and aging animals: application of targeted patch clamp analysis and optogenetics. In Patch-Clamp Methods and Protocols (pp. 221–242). Springer. Retrieved from http://link.springer.com/protocol/10.1007/978-1-4939-1096-0_14
50 Supplementary Figure 1: TRPV1 has a limited expression in the ventral midbrain during
51 Supplementary Figure 2: Injection of ChR2-EYFP in the VTA of DAT-Cre and TRPV1-Cre
52 Supplementary Figure 3: Injection of ChR2-EYFP in the VTA of DAT-Cre and TRPV1-Cre
53 Supplementary Figure 4: Inhibition of cells in the VTA does not induce place preference or
54 Supplementary Figure 5: Inhibition of fibers in the mAcbSh does not induce place
55 Supplementary Figure 6: Stimulation of cells in the VTA did not affect food consumption
56 Paper 3: Limiting glutamate transmission in a Vglut2-expressing subpopulation of the subthalamic nucleus is sufficient to cause hyperlocomotion
Authors:Nadine Schweizer *, Stéfano Pupe *, Emma Arvidsson, Karin Nordenankar, Casey JA Smith-Antilla, Souha Mahmoudi, Anna Andrén, Sylvie Dumas, Aparna Rajagopalan, Daniel Lévesque, Richardson N Leão, Åsa Wallén-Mackenzie (*Equal contribution)
74 Paper 4: OLM cells generate theta oscillations and theta-gamma coupling
Authors:Sanja Mikulovic, Stéfano Pupe, Helton P Maia, Rafael Franzon Bens, Katarina E Leão, Klas Kullander, Adriano BL Tort, Richardson N Leão
75 Stimulation of OLM cells induces theta oscillations and theta-gamma coupling in the
ventral hippocampus
Sanja Mikulovic1, Stefano Pupe1,2 , Helton Peixoto Maia2, Rafael Franzon Bens2, Katarina E
Leão1,2, Klas Kullander1, Adriano B L Tort2 & Richardson N Leão1,2,*
3. Unit of Developmental Genetics, Department of Neuroscience, Uppsala University, Sweden.
4. Brain Institute, Federal University of Rio Grande do Norte, Natal-RN, Brazil.
76 Introduction
Theta oscillations are one of the largest and most regular rhythms of the brain. These 4-12 Hz oscillations are predominant in the hippocampus and have been classically associated with movement and exploratory behavior (Hartley, Lever, Burgess, & O’Keefe, 2014). Nevertheless, recent studies have also demonstrated a critical role of theta in the communication between limbic structures and in the control of emotional states (Adhikari, Topiwala, & Gordon, 2010). In fact, theta at different hippocampal segments may serve distinct functions. For example, theta in the dorsal hippocampus (dHipp) peaks during locomotion and may spread to the ventral hippocampus (vHipp) (Hinman, Penley, Long, Escabí, & Chrobak, 2011; Royer, Sirota, Patel, & Buzsáki, 2010). However, theta can also be generated in the vHipp itself in anxiety, stress and fear-related behaviors (Adhikari et al., 2010). Additionally, vHipp theta synchronizes the hippocampus with medial prefrontal cortex and amygdala (Likhtik, Stujenske, Topiwala, Harris, & Gordon, 2014).
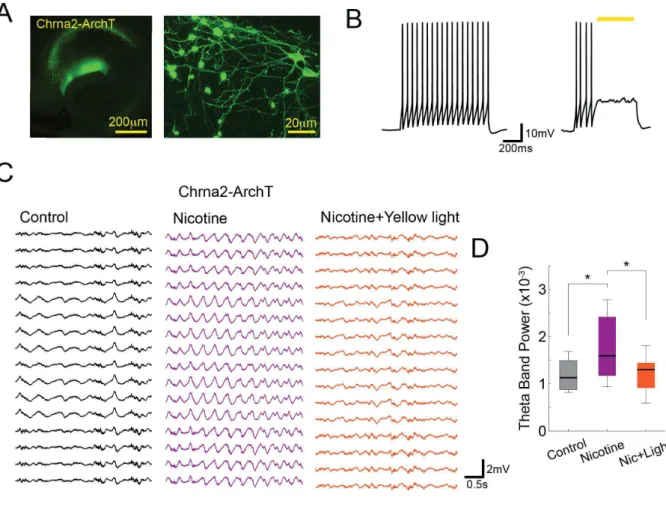
77 Here, we exploited the recent discovery of the selective expression of nicotinic acetylcholine receptor α2 subunit (Chrna2) in CA1 oriens lacunosum-moleculare (OLM) cells of the vHipp (Leão, Mikulovic, et al., 2012a), which contains most of hippocampal Chrna2+ cell bodies (Fig. 1A; Fig. S1A,B and S2B), to investigate the role of this interneuron subtype in generating LFP oscillations. We show that optogenetic activation of OLM cells is sufficient to induce theta rhythmic activity in ketamine-anesthetized mice. Moreover, optogenetic inhibition of OLM cells decreases theta oscillations induced by nicotine, suggesting that this cell population might not only be sufficient, but also necessary for network activity in the theta range. Finally, we show that activation of OLM cells increases theta-gamma cross-frequency coupling (CFC), a phenomenon in which the amplitude of gamma is modulated by the phase of theta (Jensen & Colgin, 2007).
Results
OLM cells fire particularly locked to theta oscillations when compared to other interneuron subtypes (Klausberger et al., 2003a). We have assessed the role of OLM cells in vHipp oscillations by transducing OLM cells with a Cre dependent adeno-associated viral vector carrying channelrhodopsin (Chrna2/ChR2) (Cardin et al., 2010). Chrna2+ cells were mostly found in vHipp (Fig. S1). 16-channel silicon probes were used to record LFPs in strata pyramidale (SP) and radiatum (SR) in ketamine-anesthetized animals. An optical fiber
78 100 mW/mm2 led to no major heat damage in post hoc histological analysis of the
hippocampus (Fig. S2B).
Following a previous study that used light stimulation at gamma frequency to study the role of PV interneurons in neocortical gamma oscillations (Cardin et al., 2009), we first light-stimulated OLM cells at 4 Hz, that is, a frequency within the theta range. Similarly to this previous study, we found a prominent peak at the exact stimulation frequency in the power spectrum of vHipp LFPs from Chrna2/ChR2 mice; however, the same result was found in control mice not transduced with the opsin (Fig. S3). Hence, light stimulation itself produced large photovoltaic artifacts, precluding the isolation of genuine theta oscillations when light-stimulating at the theta frequency. Of note, several approaches to avoid the photovoltaic artifacts have been unsuccessfully tried, including angling the optical fiber (10-45 degrees) in relation to the electrode as suggested in (Cardin et al., 2010), as well as using light power as low as 20 mW/mm2. Although small core fibers (≤ 50 µm) resulting in light
power in µW range would preclude artifacts as recently suggested in (Roux, Stark, Sjulson, & Buzsáki, 2014a), this approach was not suitable for our research question in which a large illumination area was needed. Additionally, electrodes with lower impedance were comparatively less prone to optoelectric artifacts than high impedance electrodes (Fig. S4A), in agreement with results reported in (Khurram & Seymour, 2013). For that reason, we have opted for silicon-substrate electrodes with larger recording area (413 µm2) that still allow the detection of units. Importantly, modulating light intensity with square pulses led to the detection of spurious spikes at the time points corresponding to the edges of the square (Fig. S4). On the other hand, sinusoidal modulation of light intensity avoided the detection of spurious spikes (Fig. S4), while producing robust firing in cells expressing ChR2 (Fig. S5).
79 that 16-Hz light stimulation of CA1 OLM cells transfected with ChR2 increased theta power (n=11 mice; p =0.0076, repeated measures ANOVA; Fig. 1B,C). When using a multishank probe with 16 recording sites horizontally positioned to detect electrical activity across hippocampal strata (Fig. 1D), we obtained the typical profile of hippocampal theta activity in current source density analysis, with maximum sink/source pairs at stratum lacunosum-moleculare (SLM) and SP (Brankack, Stewart, & Fox, 1993). Importantly, in control animals 16-Hz light stimulation led to a spurious power peak at 16 Hz but to no change in power in the theta range (n = 9, p = 0.99, repeated measures ANOVA; Fig. S6). We then performed the same experiments in PV-Cre animals injected with ChR2 (PV/ChR2). In contrast to OLM cells stimulation, 16-Hz light stimulation of hippocampal PV/ChR2 neurons decreased theta power (n=7 mice, p =0.003, repeated measures ANOVA; Fig S7). Of note, higher frequency (32 and 40 Hz) light stimulation of Chrna2/ChR2 cells also increased theta band power (Fig. S8A), while stimulating PV/ChR2 cells at these frequencies suppressed theta (Fig. S8B).
Next, we analyzed the locking of regular spiking cells (RS) and fast spiking interneurons (IN) to theta phase. The proportion of RS significantly coupled to theta phase (p<0.05, Rayleigh test) increased from 6.9% to 44.8% during light stimulation of Chrna2/ChR2 mice (n=29 units/5 mice, p=0.002, χ2 test; Fig. 2), while the proportion of IN
showing firing coupled to theta was not significantly different (n=11 units/5 mice, p=0.79, χ2
80 coupling. Thus, our data suggest that OLM cells orchestrate the activity of RS into theta oscillations without a significant impact on firing rate.
There is not a great deal of literature on the chemical generation of theta in the vHipp. Here we found that nicotine (1 mg/kg IP) induces a slow form of theta (~4.5 Hz) in the vHipp of ketamine-anesthetized mice (Fig. 3). We then investigated whether OLM cells are necessary for the maintenance of nicotine-induced theta. We applied nicotine IP to evoke theta activity in ketamine-anesthetized Chrna2-Cre mice expressing the inhibitory proton pump ArchT3.0 (Fig. 3A). The efficacy of ArchT3.0 in inhibiting spiking of Chrna2+ cells was confirmed by current-clamp in vitro (Fig. 3B). Nicotine significantly increased LFP theta power (n=5 mice, p=0.0063, repeated measures ANOVA), which was suppressed by inhibition of Chrna2/ArchT3.0 cells by constant yellow light (n=5 mice, p=0.0078, repeated measures ANOVA; Fig. 3C,D). Together, these results indicate that, besides organizing vHipp circuits to produce theta oscillations, OLM cell activity is necessary for maintenance of nicotine-induced theta.
81 (Hilscher, Leão, & Leão, 2013). Mean theta power for Chrna2- and Chrna2+ cells was equal to 0.0013±0.00004 a.u. and 0.0017±0.00007 a.u., respectively (n=23, p=0.0009, t test; Fig. 5A). Additionally, while blue light did not induce rhythmicity in OLM cells under control conditions, light stimulation during carbachol led to rhythmical firing at theta (Fig. 5B,C). Finally, bulk voltage imaging using Di-8-ANEPPQ in slices treated with carbachol showed theta activity in SLM but not in SR. Mean theta power in SR and SLM was equal to 1.17±0.40×10⁻⁵ (F/F
0)2/Hz and 3.25±1.05×10⁻⁵ (F/F0)2/Hz, respectively (n=14 slices/4
mice, p=0.01, t test; Fig. 5D), indicating that distal principal cell (PC) dendrites receive theta oscillatory inputs from OLM cells. These results suggest that OLM cells can work independently from gamma-generating circuits within a reduced hippocampal preparation. Discussion
The aim of this study was to investigate whether the activation of a single interneuron population can produce hippocampal oscillations. Previous modeling (Rotstein et al., 2005; Tort et al., 2007) and in vitro studies (Dugladze et al., 2007; Gillies et al., 2002; Gloveli, Dugladze, Rotstein, et al., 2005; Gloveli, Dugladze, Saha, et al., 2005) have suggested that OLM cells are involved in theta rhythmogenesis. Consistent with these results, we found that in vivo stimulation of OLM cells induces LFP oscillations at the theta band, causes RS cells to
82 To isolate a single interneuron population, we have used a mouse line that expresses the Cre enzyme predominantly in OLM cells of the ventral part of the hippocampus (Chrna2-Cre mouse (Leão, Mikulovic, et al., 2012a)). Our Chrna2-(Chrna2-Cre line targets OLM cells with greater specificity than the commonly used somatostatin-Cre line, which has been shown to mark a vast majority of bistratified interneurons besides OLM cells (Leão, Mikulovic, et al., 2012a; Taniguchi et al., 2011). Importantly, a recent study demonstrated that these two cell populations have differential involvement in oscillatory activity occurring in sleep and awake behaviors (Katona et al., 2014), which, along with their different pattern of PC innervation, suggests caution when interpreting results from optogenetic manipulation of somatostatin+ neurons. It should be noted, however, that Cre is not expressed in every Chrna2+ neuron in our Chrna2-Cre line. In situ hybridization indicates that chrna2 is weakly expressed in dHipp and in vHipp CA3, but moderately expressed in the dentate gyrus (DG) and CA1 of vHipp (http://mouse.brain-map.org/). However, in our mouse line there is virtually no Cre expression in DG and CA3 of vHipp, and little expression in dHipp (Fig. S1); most chrna2 expression occurs in vHipp CA1 and subiculum, where ~90% of Cre+ neurons are morphologically and electrophysiologically characterized as OLM cells (Leão, Mikulovic, et al., 2012a). This allowed us to isolate for the first time the role of a single, morphologically defined interneuron population in hippocampal oscillations.
83 non-anesthetized in vivo studies (Katona et al., 2014; Lapray et al., 2012), which consistently show preferential firing of specific interneuron populations in different phases of ongoing oscillatory activity. However, it should be noted that phase-locking of firing activity to theta does not constitute a proof of causation; for instance, some cells could be modulated by theta without contributing to theta field activity. To date, there has been no direct demonstration that the stimulation of a specific cell population is capable of generating LFP oscillations. Although PV+ interneurons have been reported to generate gamma oscillations in neocortex when stimulated with optogenetic tools (Cardin et al., 2009), it should be noted that PV shows little specificity in defining interneuron subclasses both in neocortex (Xu et al., 2003) and hippocampus (Klausberger et al., 2005); for instance, in the hippocampus, PV is found in basket, bistratified, axo-axonic, and OLM cells (Klausberger et al., 2005). It should also be noted that physiological gamma oscillations have a broad peak in the power spectrum (Bragin et al., 1995; Scheffzük et al., 2011), while optogenetic stimulation of PV+ neurons at 40 Hz led to a very sharp power peak centered at 40 Hz (9). In our hands, we found that the sharp power peaks centered at the stimulation frequency were due to photovoltaic artefacts (Fig. S3 and S6).
We found that OLM cell stimulation causes RS cells - which in its majority are PCs (Martina, Schultz, Ehmke, Monyer, & Jonas, 1998) - to phase-lock to theta without changing firing frequency. It is important to note that OLM cell mediated inhibition decreases the excitatory drive to PCs, but disinhibits proximal PC dendrites (Leão, Mikulovic, et al., 2012a), which could explain the lack of change in PC spiking frequency during OLM stimulation. In addition, hyperpolarization-activated inward currents (Ih) in distal dendrites (Magee, 1999) could promote rebound depolarizations after IPSPs (Leao, Leao, & Walmsley, 2011).
84 suggested by modeling studies (Neymotin et al., 2011; Tort et al., 2007). The large electrotonic distance between the apical PC dendrites in SLM and the AP initiation site indicates that low frequency inputs in these regions are more likely to contribute to AP generation (Vaidya & Johnston, 2013). OLM cells would weakly entrain PC firing by rhythmically modulating distal dendrites of a large number of PCs with low frequency IPSCs. This effect contrasts with the strong and deterministic inhibitory drive provided by interneurons that target perisomatic PC compartments or axon initial segments (Cardin et al., 2009; Hilscher et al., 2013). Hence, it is plausible that local gamma generating circuits involve PCs and perisomatic inhibiting interneurons while larger circuits driving distal PC dendrites synchronize these local circuits in theta (Tort et al., 2007). This hypothesis is supported by previous (Dugladze et al., 2007; Gloveli, Dugladze, Rotstein, et al., 2005) and our own in vitro experiments that indicate the existence of independent theta and gamma generating circuits in the hippocampus.
85 excitability would facilitate the effect of PC connections to OLM cells.
In summary, we have shown that OLM cells are key elements in the generation of theta oscillations in vHipp. Future studies should aim at investigating how OLM cells are involved in the functional roles of theta oscillations. Since vHipp theta is related to emotional behavior (Adhikari et al., 2010), manipulating OLM cells in this region may help understanding mood and anxiety disorders.
Material and methods
All experiments were performed in adult (2-4 month old) Chrna2-Cre, B6;129P2-Pvalbtm1(Cre)Arbr/J (Jax stock 008069; PV-Cre), Gt(ROSA)26Sortm14(CAG−tdTomato)Hze/J (R26tom,