Determined by Light and Nitrogen Availabilities
Daisuke Sugiura*, Masaki Tateno
Nikko Botanical Garden, Graduate School of Science, University of Tokyo, Nikko, Tochigi, Japan
Abstract
Plants exhibit higher leaf-to-root ratios (L/R) and lower leaf nitrogen content (Narea) in low-light than in high-light environments, but an ecological significance of this trait has not been explained from a whole-plant perspective. This study aimed to theoretically and experimentally demonstrate whether these observed L/R andNareaare explained as optimal biomass allocation that maximize whole-plant relative growth rate (RGR). We developed a model which predicts optimal L/R andNareain response to nitrogen and light availability. In the model, net assimilation rate (NAR) was determined by light-photosynthesis curve, light availability measured during experiments, and leaf temperature affecting the light-photosynthesis and leaf dark respiration rate in high and low-light environments. Two pioneer trees, Morus bombycis and Acer buergerianum, were grown in various light and nitrogen availabilities in an experimental garden and used for parameterizing and testing the model predictions. They were grouped into four treatment groups (relative photosynthetic photon flux density, RPPFD 100% or 10%6nitrogen-rich or nitrogen-poor conditions) and grown in an experimental garden
for 60 to 100 days. The model predicted that optimal L/R is higher and Narea is lower in low-light than high-light environments when compared in the same soil nitrogen availability. Observed L/R andNareaof the two pioneer trees were close to the predicted optimums. From the model predictions and pot experiments, we conclude that the pioneer trees,M. bombycisandA. buergerianum, regulated L/R andNareato maximize RGR in response to nitrogen and light availability.
Citation:Sugiura D, Tateno M (2011) Optimal Leaf-to-Root Ratio and Leaf Nitrogen Content Determined by Light and Nitrogen Availabilities. PLoS ONE 6(7): e22236. doi:10.1371/journal.pone.0022236
Editor:Randall Niedz, United States Department of Agriculture, United States of America
ReceivedMarch 25, 2011;AcceptedJune 17, 2011;PublishedJuly 12, 2011
Copyright:ß2011 Sugiura, Tateno. This is an open-access article distributed under the terms of the Creative Commons Attribution License, which permits unrestricted use, distribution, and reproduction in any medium, provided the original author and source are credited.
Funding:This work was supported by Global COE Program (Integrative Life Science Based on the Study of Biosignaling Mechanisms), MEXT, Japan. The funders had no role in study design, data collection and analysis, decision to publish, or preparation of the manuscript.
Competing Interests:The authors have declared that no competing interests exist. * E-mail: [email protected]
Introduction
Plants have the ability to alter their phenotype to maximize fitness according to the external environment. For example, they often change leaf properties and biomass allocation pattern in accordance with light and nutrients conditions [1,2]. Criteria for determining leaf to root ratio (L/R) have been investigated by many researchers because it could be a major factor dictating plant growth rate and fitness [3]. Thus, elucidating the L/R will be helpful for understanding plant growth strategies in natural ecosystems.
Until now, many researchers have worked with the subject, and proposed the balanced growth hypothesis where plants allocate more biomass to the organ capturing the most limiting resources, such as light and nutrients [4–6]. According to this hypothesis, for example, producing more leaves at the sacrifice of root growth is favoured in low-light environments to capture more light to enhance growth rate. However, this hypothesis is only an intuitive explanation and can’t propose a quantitative estimation of L/R. Since leaf and root functions are closely interrelated, producing excessive leaves may decrease growth rate due to decreased root functions, such as nitrogen uptake capacity. This lead to an idea that there will be an equilibrium between leaves and roots for optimal biomass allocation that maximizes whole-plant growth rate [1,7].
Theoretical analyses and experimental confirmation of the hypothesis have been performed for plants in high-light
environ-ments. Such studies revealed that the L/R and leaf nitrogen content were mainly optimized to maximize RGR with soil nitrogen availability [7,8]. In contrast, plants growing in low-light environments generally have higher L/R than those growing in high-light environment regardless of functional groups [1,9–13]. In these studies, however, the high L/R were only explained from the balanced growth hypothesis as mentioned above, and theoretical studies accounting for this biomass allocation pattern are still lacking. Thus, it has not been quantitatively determined whether the high L/R in low-light environments is as a result of maximization of relative growth rate (RGR) to maximize.
We noticed that plants growing in low-light environments have lower leaf nitrogen content per leaf area (Narea) and associated
lower maximum photosynthetic and dark respiration rate [1,9,14]. Nitrogen is almost thoroughly absorbed by root and considered to be a primary mineral which dictate amount of photosynthate and growth [15] through the balance between photosynthetic and respiration rate and light availability. For example, higherNarea
realize higher maximum photosynthetic rate, but if light availability is low, the amount of photosynthate rather decreases because dark respiration rate is also higher. Therefore, it is hypothesized that the higher L/R might be due to lower nitrogen demand for maximizing growth rate than in high-light environ-ments, not due to capturing more light by increasing leaf area at the sacrifice of root growth in low-light environments. SinceNarea
which maximize whole plant growth rate by considering above-mentioned plant traits. In this study we developed a biomass allocation model based on that of Osone and Tateno (2003) to demonstrate whether the L/R and Nareain a low-light
environ-ment are optimized to maximize relative growth rate (RGR). Leaf (leaf mass per area and photosynthesis) and root (nitrogen absorption) properties were incorporated into the model. We also estimated the leaf net assimilation rate (NAR; g m22d21) in various light environments to clarify relationship between light availability and nitrogen demand. There,Nareaand photosynthetic
parameters were associated with actual meteorological data measured throughout the growth period. Using theNarea- NAR
relationship, we could predict the optimal L/R and Narea in
various light environments. Two pioneer trees,Morus bombycisand
Acer buergerianum, were used for testing the model predictions. Finally, we discuss the biomass allocation strategy in a low-light environment from a whole-plant perspective.
Materials and Methods
Plant materials and experimental design
Experiments were conducted at the Nikko Botanical Gardens of the University of Tokyo (139u3609E, 36u4509N, 650 m a.s.l.). The mean air temperature was 12uC, and the annual precipitation was 2100 mm.
We used 1-year-old seedlings of mulberry tree (Morus bombycis
Koidz.) and Trident maple tree (Acer buergerianumMiq.). These are typical pioneer deciduous trees in East Asia, which change their morphological and physiological traits largely. Seedlings grow fast because leaves flush sequentially and root growth continues throughout the growing season.
Morus bombycisseeds were collected from a wildM. bombycistree in Nikko city in 2007. The seedlings were grown in plastic pots in an open field in 2007 and used for experiments from April to August 2008. One-year-old A. buergerianumseedlings which were grown in natural open environments were purchased from a nursery (Kairyoen, Saitama, Japan). They used for experiments from July to September 2009. Initial pot size was about 3 liter and seedlings were further transplanted carefully to 10 liter pots according to root size. Until just before the experimental period, those seedlings were placed in shade houses which were made of greenhouse frames and shade cloths. Relative photosynthetic flux density (RPPFD) in the shade houses was about 10% (measured by two quantum sensors, LI-1000, Li-Cor, Lincoln, NE, USA).
At the beginning of the experimental period, the main stem of each seedling was cut, and only one shoot was allowed to grow. Then, half of the seedlings were placed in the open field and the rest were in the shade houses, respectively. Pots were placed separately to avoid mutual shading. They were also grouped into two nutrient conditions with different nitrogen concentrations. Other than N, these solutions contained the following: 3 mM K2HPO4, 1 mM MgSO4?7H2O, 3 mM CaCl2, 25mM H3BO3,
2mM MnSO4?5H2O, 2mM ZnSO4?7H2O, 0.5mM
Cu-SO4?5H2O, 0.5mM Na2MoO4?2H2O, and 20mm Fe-EDTA
[16]. NH4NO3was added to this solution and adjusted to 20 or
2 mM. Pot seedlings were grouped into four treatments: high-light condition and nitrogen-rich (HR) or nitrogen-poor (HP), and shade condition and nitrogen-rich (SR) or nitrogen-poor (SP). The nutrient solutions were applied to the seedlings every second day, and the seedlings were watered every day during the experiments.
Measurements and parameters
During the experimental period, PPFD (mmol m22s21) and air
temperature (Ta,uC) were measured at the experimental site every
minute in both 2008 (Item No. 3668 for PPFD, Item No. 3667 for air temperature, Spectrum Technology, Ft. Worth, TX, USA) and 2009 (S-LIA-M003 for PPFD, S-THA-M006, for air temperature, Onset Computer, Pocasset, MA, USA).
In August 2009 we also measured the leaf temperature (TL,uC)
of pot-grown maple leaves using thermocouples (TC6-T, Onset) because leaf temperature affects the dark respiration rate temperature dependency. We constructed an estimation equation forTLusing multi-regression analysis and the PPFD andTavalues.
Leaf photosynthesis was measured to determine the relationship between leaf nitrogen content per area (Narea) and the parameters
of the light-photosynthesis curve using a portable photosynthesis measurement system (CIRAS1, PP Systems, Hitchin, Herts, UK). Pot seedlings from all four treatments were used for the measurements. The measurement conditions were as follows: CO2concentration, 400mmol mol21; leaf temperature, 25uC; and
relative humidity, 50%. The maximum photosynthetic rate was measured at 1000mmol m22s21 for the sun-exposed leaves (100%RPPFD) and at 200mmol m22s21for the shade leaves, so as not to cause photoinhibition. We also measured temperature dependency of photosynthetic rate by changing leaf temperature and irradiance variously. After the measurements, total nitrogen content of the leaves were measured for evaluating Narea by a
carbon-nitrogen (CN) analyzer (Vario EL, Elementar Analyzen-systeme GmbH, Hanau, Germany).
Sampling
Morus bombyciswere harvested in mid-April and mid-August of 2008, andA. buergerianum were harvested in early July and early September. Final biomass of the seedlings became much larger than initial biomass. Seedlings seemed not to be self-shaded because they had only one shoot per individual. At each harvest, four to ten seedlings per treatment group were sampled and divided into leaves, stems, and roots. After measuring the leaf area, each part of the seedlings was oven-dried at 80uC for more than 4 days. The samples were then weighed, and nitrogen content was measured with the CN analyzer.
Calculation
Nitrogen absorption rates per unit root dry mass (SAR; gN g21d21) were calculated considering the difference in total nitrogen content and root dry mass between the two harvests following Osone & Tateno (2003). Changes in root dry mass were assumed to be exponential between harvests. The leaf mass per area (LMA; g m22), L/R, and leaf mass per shoot mass (PLeaf;
g g21) were also determined for each treatment group and applied for model prediction.
The models
First, we developed an optimal growth model that predicts the optimal biomass allocation ratio and leaf nitrogen content under various irradiance levels. The structure of the model was fundamen-tally based on that described by Osone and Tateno (2003).
In our model, theNarea–NAR relationship was used as the plant
growth indicator. NAR was estimated using an actual PPFD and photosynthetic light-response curve in which the temperature dependency of the photosynthesis and dark respiration rate were considered.
Net photosynthetic rate at certain PPFD (I) and leaf temper-ature (TL),An(I,TL), was expressed as follows:
where Ag(I,TL) is the gross photosynthetic rate at Iand TL and
Rd(TL) is the leaf dark respiration rate at TL (uC). Ag(I,25) is
measured and expressed as the photosynthetic light-response curve which is a non-rectangular hyperbola:
Ag(I,25)~
QIzAmax{ ðQIzAmaxÞ2{4hQIAmax
n o12
2h ð2Þ
whereAmaxis the light-saturated rate of gross photosynthesis,Qis
the initial slope of the light-response curve,his the convexity of the light-response curve.AmaxandRd(25) are expressed as a function
ofNarea, andQandhare assumed to be constant.
The temperature dependency of gross photosynthetic rate was incorporated as a function of TL. Ag(I,TL) was expressed as an quadric approximation formula whereAg(I,25) was relativized to 1 as a standard value:
Ag(I,TL)~Ag(I,25):(a1:TL2za2:TLza3) ð3Þ
wherea1,a2anda3were constant values and obtained from the photosynthesis measurements for each species.
The temperature dependency ofRd(TL) is described as [17]:
Rd(TL)~Rd(25):exp
DHa:ðTL{25Þ
298R:(TLz273)
ð4Þ
whereRd(TL) and Rd(25) are values of Rd atTL (uC) and 25uC,
respectively.Ris the gas constant (0.0083 J K21mol21) andDHa
is the activation energy of Rd (66.405 kJ mol21) [18]. We also
considered the Kok effect by which the dark respiration rate decreases when leaves are exposed to sunlight [19,20]:
Rd(TL)~0:4Rd(TL) (whenIw0mmol m-2s-1) ð5Þ
Rd(TL)~Rd(TL) (whenI~0mmol m-2s-1) ð6Þ
where eqn. 5 and eqn. 6 represent the dark respiration rate during the day and night, respectively.
The leaf photosynthesis parameters (Amax,Rd,h, andQ) at 25uC
were described following Hikosaka et al. (1999). Relationship betweenAmax–Narearelationship andRd–Narearelationship were
expressed as:
Amax~b1
Narea{b2
Narea{b2zb3
ð6Þ
Rd~b4Nareazb5 ð7Þ
whereb1,b2, andb3were maximum rate ofAmax, x-intercept of the
curve, and a constant that determines initial slope of the Amax– Narearelationship, respectively, andb4andb5were the slope and
y-intercept of the Rd –Narearelationship. These parameters were
obtained from the photosynthesis measurements for each species. For a givenNarea, NAR was calculated by substituting the light
dataset into above equations (eqn. 1 to 6), integrating A(I), converting CO2 to carbohydrate (1/6C6H12 O6), multiplying a
transform coefficient of assimilated carbohydrate to the structural carbohydrate, and dividing the integrated A(I) by the growth period (day). The transform coefficient was found to be about 0.4,
in which both construction and maintenance costs of leaves, stems, and roots were considered [21–23]. We also estimated NAR in low-light environments using datasets with PPFD reduced to 10% and repeated the above processes.
We determined optimal plant property values using theNarea–
NAR relationship and an optimal biomass allocation model based on that of Osone and Tateno (2003).The model plant consisted of three parts: the leaf, stem, and root. The whole plant biomass (W) is expressed as:
W~WLzWSzWR ðM1Þ
where WL, WS, and WR are the leaf, stem, and root biomass,
respectively. Leaf area (LA) is expressed as:
LA~ WL
LMA ðM2Þ
where LMA is the leaf mass per area (g m22), a constant determined in each light environment.
Leaf nitrogen content per biomass (NL) is different from stem
and root nitrogen content per biomass (NSandNR) and they are
highly correlated. Because these relationships affect the prediction of optimal biomass allocation (Osone & Tateno 2003), we defined
NSandNRas functions ofNLas follows:
NS~c1NLzc2 ðM3Þ
NR~c3NLzc4 ðM4Þ
wherec1,c2,c3, andc4are constant values. By introducing these
relationships, absorbed nitrogen is partitioned into leaf, stem, and root correctly.
Leaf nitrogen content per leaf area (Narea) is expressed as:
Narea~NL
LA ðM5Þ
Plant biomass production per day is a product of net assimilation rate (NAR) andLA:
dW
dt ~NAR:LA ðM6Þ
Newly produced biomass was first divided between shoot and root following Hilbert (1990) using the allocation coefficient PShoot,
which is shoot biomass per total biomass. Then, newly shoot biomass is further partitioned into the leaf and stem according to
PLeaf, which is leaf biomass per shoot biomass, following Osone &
Tateno (2003). Because there was almost no variation in PLeaf
during the growth period for each species growing in each light environment, we only have to estimate the effect ofPShootin the
model simulation. Thus, the new biomass increment for each organ is expressed as:
dWL
dt ~PShoot:PLeaf: dW
dt ðM7Þ
dWS
dt ~PShoot: 1{PLeaf
:
dW
dWR
dt ~ð1{PShootÞ: dW
dt ðM9Þ
where 0,PShoot,1 and 0,PLeaf,1.
Nitrogen uptake rate is proportional to the root biomass:
dN
dt ~SAR:WR ðM10Þ
where N is total nitrogen content and SAR is the specific absorption rate, which represents both the plant nitrogen uptake capacity of the roots and soil nitrogen availability [24]. Then, the RGR is calculated as:
RGR~dW
dt :
1
W ðM11Þ
For the given plant growth parameters (Narea– NAR relationship, PShoot, PLeaf, and SAR), steady-state L/R, Narea, and RGR are
obtained by repeating the model processes numerically by Euler’s method. By changing PShoot, the optimal biomass allocation rate and Narea, which maximizes RGR for various RPPFD and
nitrogen availabilities, can be calculated.
As the Narea –NAR relationship differed in each light
environment, we obtained the optimal L/R and Narea under
different light and nutrient conditions.
Results
Model parameters
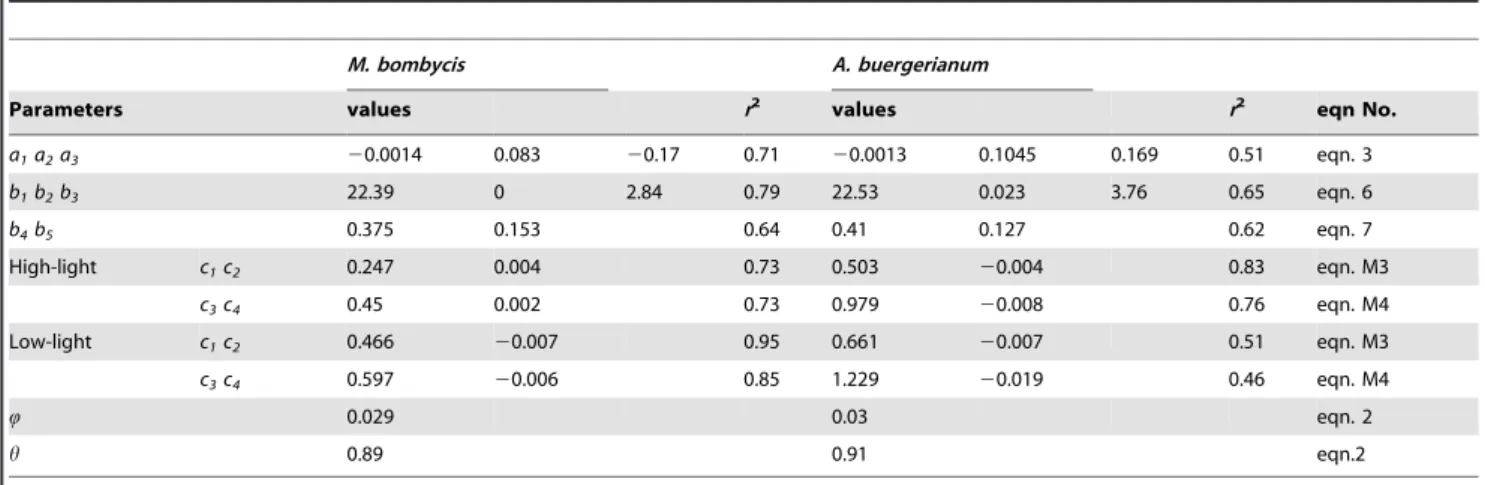
Parameter values obtained from the measurements, determina-tion coefficients, and corresponding equadetermina-tions were listed in Table 1, which showed good correlation. Only the relationships between nitrogen content of each organ were determined for each light environment (eqn. M3, M4) usingc1,c2,c3, andc4.
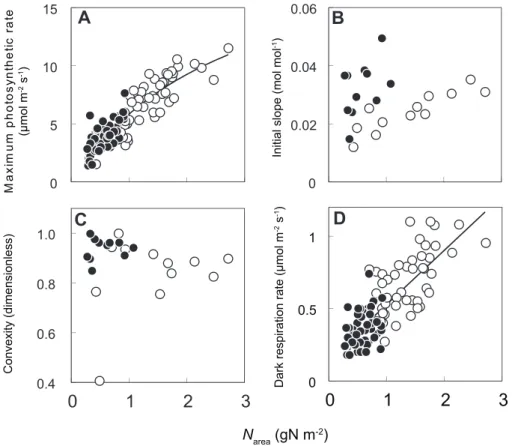
As for the leaf photosynthesis parameters (Amax,Rd,h, andQ) at
25uC, parameters of M. bombycis were shown in Fig. 1(A–D) as representative. Amax and Rd were highly correlated with Narea
(Fig. 1A, D). Averaged values were used for Q and h for both species because these values were almost constant irrespective of theNareaand light environments (Fig. 1B, C).
During the growth periods in 2008 and 2009, mean diurnal air temperatures were 20.5 and 23.uC, mean night air temperatures
were 15.8 and 19.2uC, and the average daily PPFDs were 22.5 and 22.1 (mol m22d21), respectively. ATL estimating equation was
developed by multi-regression analysis using the recorded PPFD and Ta values measured in August 2009. For PPFD, the
accumulated value of the last 3 minutes,P3 min (mol m22), was
used for the multi-regression analysis because it showed the highest correlation. The equation is expressed as:
TL~0:875Taz9:61|10
{4P
3 minz2:94 (r 2~0
:96)
TLat night was set to nightTabecause these values were nearly
the same.
NAR was calculated by substituting the observed environmental data into theNarea–photosynthesis relationship and expressed as a
function ofNareafor both species and light environments (Fig. 2).
NAR increased withNareafor 100% RPPFD, whereas it reached a
maximum value at lowNareafor 10% RPPFD for both species.
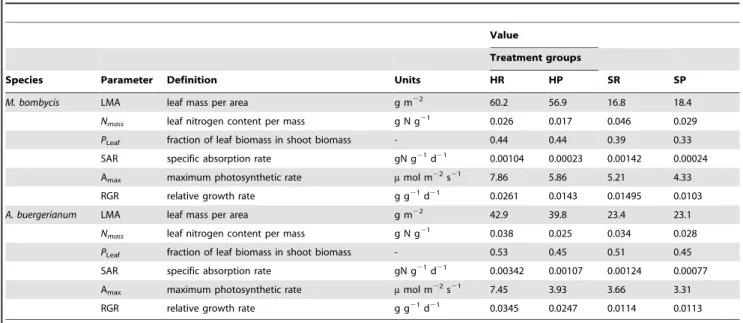
Table 2 also shows values determined from the pot experiments, which represented typical morphological and physiological traits in response to light and nitrogen availabilities. Values of LMA,
PLeaf, SAR and the the Narea- NAR relationship were used for
following model predictions.
Model predictions
We simulated general trends of the effects of light availability and soil N availability on optimal L/R andNareausing the model.
We used parameter values of M. bombycis (Table 1, 2) for the simulation because it becomes the basically same result even if the parameters of either species were used. SAR was changed within a realistic range, from 0.0005 to 0.005 gN g21d21. As described in the model description, we can simulate L/R and corresponding
Narea and RGR uniquely by changing PShoot for the given
parameters. Figure 3 shows the relationship betweenNarea and
relative growth rate (RGR: g g21d21). For a given SAR, the optimalNareathat maximized RGR was obtained for both
high-(Fig. 3A) and low- high-(Fig. 3B) light environments. OptimalNareaand
the associated maximum RGR was higher for 100% RPPFD than 10% RPPFD when compared with the same nitrogen availability, SAR.
The relationships between L/R, RGR andNareaare shown in
Figure 4. Smaller L/R (larger root fraction) increasedNarea, but
too highNareawhich was due to lower amount of photosynthetic
organs (leaves) lead a decrease in NAR (Fig. 2) because increase in
Table 1.Parameters on photosynthesis, respiration, and tissue nitrogen content.
M. bombycis A. buergerianum
Parameters values r2
values r2
eqn No.
a1a2a3 20.0014 0.083 20.17 0.71 20.0013 0.1045 0.169 0.51 eqn. 3
b1b2b3 22.39 0 2.84 0.79 22.53 0.023 3.76 0.65 eqn. 6
b4b5 0.375 0.153 0.64 0.41 0.127 0.62 eqn. 7
High-light c1c2 0.247 0.004 0.73 0.503 20.004 0.83 eqn. M3
c3c4 0.45 0.002 0.73 0.979 20.008 0.76 eqn. M4
Low-light c1c2 0.466 20.007 0.95 0.661 20.007 0.51 eqn. M3
c3c4 0.597 20.006 0.85 1.229 20.019 0.46 eqn. M4
Q 0.029 0.03 eqn. 2
h 0.89 0.91 eqn.2
AmaxwithNareais saturated, whereas increase in respiration rate
(Rd) with Narea is linear (Fig. 1A,B). Consequently RGR also
reduces whenNareais too high. However, a larger L/R (smaller
root fraction) also decreased RGR by decreasingNareaand NAR
(Fig. 2). Thus, optimal L/R and associatedNareaare determined
by these balances, which change depending on light and nitrogen availability.
The effects of SAR on optimal L/R andNareadiffered between
high- and low-light environments (Fig. 4 A,B). In a low-light environment, optimal L/R was higher and optimal Narea was
lower than those in the high-light environment, which can be interpreted as follows. Under a high-light environment, more biomass allocated to the roots increased nitrogen absorption resulting in highNarea, NAR, and RGR. In contrast, in a low-light
environment, due to saturation of NAR at lowNarea, the plant
favoured a smaller fraction of root biomass, a large L/R, and a low
Nareato achieve maximum RGR.
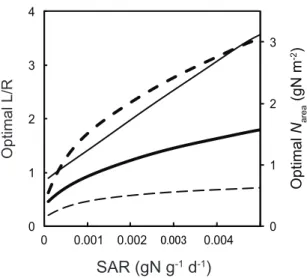
Figure 5 shows the effects of changing SAR on optimal L/R and
Nareawhich give maximum RGR. Optimal L/R was always higher
and optimalNareawas always lower for 10% RPPFD for all ranges
of SAR (Fig. 5). Optimal Nareaincreased sharply with SAR for
100% RPPFD, whereas it was almost saturated at a low value for 10% RPPFD indicating difference in nitrogen demand between high- and low-light environments.
Comparison of actual biomass allocation with model predictions
The above predictions were tested using two deciduous pioneer tree species.
Figure 1. Relationship between leaf nitrogen content per area (Narea) and light-photosynthesis curve parameters.Each point was
obtained from sun leaves (white circles) and shade leaves (black circles) ofMorus bombycis. Maximum photosynthetic rate (A), initial slope of the curve (B), convexity of the curve (C), and dark respiration rate at 25uC (D). See text for the expressions for (A) and (B) and the constants for (C) and (D). doi:10.1371/journal.pone.0022236.g001
Figure 2. Estimated net assimilation rate (NAR) as a function of leaf nitrogen content per area (Narea).Solid lines and dashed lines
represent NAR in 100% photosynthetic photon flux density (RPPFD) and 10% RPPFD, respectively. The thick lines and the thin lines represent
Morus bombycis,Acer buergerianum, respectively.
The pot experiment parameters showed morphological and physiological plasticity corresponding to the light environment and nitrogen availability (Table 2). LMA was higher for HR and HP (100%RPPFD) than for SR and SP (10%RPPFD), and SAR was higher for HR and SR rich) than for HP and SP (nitrogen-poor) for both species. Constants for stem and root N concentration (eqn. M3, M4) differed between species and light environments, but each set of constants (c1andc2,c3andc4) showed high determination
coefficients, as reported by Osone and Tateno (2003). The SAR ofA. buergerianumwas higher than that ofM. bombycis, indicating different intrinsic capacities for nitrogen uptake [25,26].
Using these parameter values observed for each species (Table 1, 2) and the optimal biomass allocation model, we calculated optimal L/R andNareaand compared these results with actual L/
R andNareafor each species. We set ranges of values for L/R and
Nareawhich cover 98% of the maximum RGR because the RGR
curves against L/R andNareawere gradual and maintained high
RGR around optimums, as shown in Figs. 3 and 4.
Measured L/R were higher andNareawere lower in low-light than
high-light environments, and all measured L/R andNareaalmost fell
within the estimated ranges which cover 98% of the maximum RGR for both species (Fig. 6). The Narea values for SR and SP were
particularly close to the optimums for both species (Fig. 6 B, D). Thus, L/R andNareaalmost satisfied the model-predicted optimums for
these pioneer trees growing both in high- and low-light environments.
Discussion
From the model predictions and pot experiments (Fig. 6), we could demonstrate that L/R and leaf Narea of the pioneer tree Table 2.Morphological and physiological parameters for material species.
Value
Treatment groups
Species Parameter Definition Units HR HP SR SP
M. bombycis LMA leaf mass per area g m22 60.2 56.9 16.8 18.4
Nmass leaf nitrogen content per mass g N g21 0.026 0.017 0.046 0.029
PLeaf fraction of leaf biomass in shoot biomass - 0.44 0.44 0.39 0.33
SAR specific absorption rate gN g21d21 0.00104 0.00023 0.00142 0.00024
Amax maximum photosynthetic rate mmol m22s21 7.86 5.86 5.21 4.33
RGR relative growth rate g g21d21 0.0261 0.0143 0.01495 0.0103
A. buergerianum LMA leaf mass per area g m22 42.9 39.8 23.4 23.1
Nmass leaf nitrogen content per mass g N g21 0.038 0.025 0.034 0.028
PLeaf fraction of leaf biomass in shoot biomass - 0.53 0.45 0.51 0.45
SAR specific absorption rate gN g21d21 0.00342 0.00107 0.00124 0.00077
Amax maximum photosynthetic rate mmol m22s21 7.45 3.93 3.66 3.31
RGR relative growth rate g g21d21 0.0345 0.0247 0.0114 0.0113
Values of LMA,PLeaf, and SAR, were used for the model simulations. Values are shown for each species and treatment group. doi:10.1371/journal.pone.0022236.t002
Figure 3. Changes in the relative growth rate (RGR) with increasing leaf nitrogen content (Narea) when SAR was changed.(A) 100%
photosynthetic photon flux density (100%RPPFD). (B) 10%RPPFD. Each line is labelled with a number denoting nitrogen absorption rates per unit root mass (SAR). Values obtained fromMorus bombyciswere used (Table 2).
species,M. bombycisandA. buergerianum, were explained as optimal biomass allocation to maximize RGR in both high and low-light environments. Thus, we conclude that the balance between leaves and roots are regulated by nitrogen demand and nitrogen availability, each of which was dependent on light and soil nitrogen availability respectively. This is interpreted as follows: Plants need less nitrogen and fewer roots which absorb nitrogen to maximize growth rate when light availability was lower, because too high Narea rather decrease NAR (Fig. 2) and consequently
RGR (Fig. 3B, 4B). Conversely, plants need more nitrogen and more roots when light availability is high, because NAR plateau at higher Narea (Fig. 3A, 4A). In addition to nitrogen demand,
nitrogen availability expressed as SAR also plays an important role to determine optimal L/R andNarea(Fig. 5) as demonstrated in
classical studies [7,27]. It is especially notable that light availability determines the biomass allocation pattern through the change in nitrogen demand (Fig. 5).
The results obtained in the high-light environment were consistent with previous research [7,27], whereas this is the first study to theoretically and experimentally explain optimal biomass allocation of plants in high and low-light environments systemat-ically (Figs. 5 and 6). Higher L/R and lower Narea were also
observed in many previous studies both in experimental fields
[9,12] and natural conditions [27,28]. Thus, these observations would be also understood as the optimal biomass allocation to maximize RGR.
In our model, we used morphological and physiological properties such as LMA, PLeaf, Narea - NAR relationship, and
SAR which were actually observed in response to light and nitrogen availabilities in the present study. This enables more quantitative predictions of optimal biomass allocation compared with the previous models [29–31]. Furthermore, our model can predict the optimal L/R and leaf Narea in various light
environments. This is mainly because we used light intensity measured throughout the growth period and incorporated the temperature dependency of photosynthetic rate and the dark respiration rate to estimate leaf productivity (Fig. 2). These characteristics of our model must improve the accuracy of the predictions compared with previous studies where leaf or canopy productivity was estimated by simpler models (e.g. [31–34]). In these simple models, leaf or canopy productivity was estimated by simplifying light availability as a sine square curve and leaf temperature was not also considered. However, actual light availability varies depending on weather conditions, forest structure, and seasonality [35]. Climate condition also affects leaf temperature expressed as functions of PPFD and air temperature, which mainly affects dark respiration rate exponentially (eqn. 4). In fact, NAR estimated by the simple model using the sine square curve was rather higher than that of the present study in which actual climate condition is considered. In addition, NAR without the temperature dependency of photosynthetic rate and dark respiration rate was also rather lower than that of the present study (figure not shown). Consequently, optimal values predicted by using these NAR were deviated from those predicted by NAR of the present study especially in low-light environments. Therefore, these parameters should be considered to estimate accurate long-term leaf productivity [20] and to predict the optimal L/R and
Nareain our study.
Another important finding was that the extent of nitrogen limitation was smaller in the low-light environment than the high-light environment. Specifically, differences in L/R, Narea, and
RGR between SR and SP were smaller than those between HR
Figure 4. Effects of the leaf-to-root ratio (L/R) on relative growth rate (RGR) and leaf nitrogen content (Narea).(A) 100%
photosynthetic photon flux density (100%RPPFD). (B) 10%RPPFD. Solid lines represent RGR and dashed lines representNarea, respectively. Thick lines represent nitrogen absorption rates per unit root mass (SAR) = 0.005 and thin lines represent SAR = 0.0005. Black circles represent the maximum relative growth rate (RGR) and white circles represent the associatedNarea. Parameter values obtained fromMorus
Bombyciswere used (Table 2).
doi:10.1371/journal.pone.0022236.g004
Figure 5. Optimal leaf-to-root ratio (L/R) and optimal leaf nitrogen content (Narea).Thick lines represent 100% photosynthetic
photon flux density (100%RPPFD) and thin lines represent 10%RPPFD. Solid lines represent optimal L/R and dashed lines represent optimal
Narea, respectively.
and HP (Fig. 6, Table 2). This was probably due to less nitrogen demand of the plants to achieve maximum NAR and RGR in the low-light environment (Figs. 2, 3, and 5). Although the present study only focused on the pioneer trees, other shade-tolerant tree species also have low leaf Narea with lower L/R [9,10,36–38].
Thus, the extent of growth limitation caused by low nitrogen availability would be smaller in understory vegetation than in gap sites for any plants because of the difference in nitrogen demand. Furthermore, these facts indicate that not only pioneer trees with indeterminate growth but also shade-tolerant trees with determi-nate growth might achieve the optimal L/R. Our present model is not suitable for evaluating those shade-tolerant trees because these species tend to produce leaves once a year and tougher stems and roots throughout a year. These organs live longer and reserve more carbohydrate and nitrogen for next year in contrast to pioneer species, and these traits are considered to be related to their survival [9,39]. Thus, elucidating optimality of shade-tolerant species is remaining as an interesting topic future research.
To understand plant biomass allocation strategy from more realistic and versatile perspective, two major remaining subjects should be investigated. One is water absorption capacity of root, which contributes to growth through transpiration during photosynthesis and to survival by preventing from drying. Thus, there must be minimum requirements of root mass to leaves or whole-plant biomass, and it will change according to light environments because transpiration rate generally change in response to light intensity. From this viewpoint, it is predicted
that plants with too high L/R would suffer from water stress and accordingly their RGR would rather decrease. Consequently, the ranges covering 98% of maximum RGR (Fig. 4) would be confined to narrower regions.
The other is stem mechanical constraint which causes increase in stem mass fraction. Especially in a low-light environment, many researchers have reported that the stem mass ratio of pioneer trees increases due to stem elongation and increase in specific stem length [2,37,40,41]. Although we could not find clear differences in PLeaf between treatment groups in either species in the pot
experiments, this would partly due to the shorter growth period (about 60 to 100 days) than in previous studies. In the year following this study,PLeafwas lower in the low-light than high-light
environment forM. bombycis(data not shown). Since the amount of biomass allocation to the stem should increases to maintain mechanical stability as plants grow higher [42,43], stem elongation would become more and more costly especially for pioneer tree species in a shaded condition due to lower leaf productivity (Fig. 2). Developing a model considering above-mentioned constraints combined with our present biomass allocation model would be helpful for further understanding of the plant biomass allocation strategy in various light environments.
Acknowledgments
We greatly thank T. Tani, R. Ichihashi, this journal’s editors and anonymous reviewers for valuable comments on this study. We also thank T. Hachiya, K. Noguchi, and I. Terashima for their assistance of nitrogen
Figure 6. Optimal and observed leaf to root ratio (L/R) and leaf nitrogen content (Narea) for each light and nitrogen availabilities.
analyses, K. Sawakami for help with photosynthesis measurements, and
staff of Nikko Botanical Gardens for assistance in the experiments. Author Contributions
Conceived and designed the experiments: DS MT. Performed the experiments: DS MT. Analyzed the data: DS MT. Contributed reagents/materials/analysis tools: DS MT. Wrote the paper: DS.
References
1. Givnish TJ (1988) Adaptation to sun and shade: a whole-plant perspective. Australian Journal of Plant Physiology 15: 63–92.
2. Poorter H, Nagel O, Anderson JM, van Bel AJE, Knoblauch M, et al. (2000) The role of biomass allocation in the growth response of plants to different levels of light, CO. Aust. J Plant Physiol 27: 595–607.
3. Iwasa Y, Roughgarden J (1984) Shoot/root balance of plants: Optimal growth of a system with many vegetative organs. Theoretical Population Biology 25: 78–105.
4. Garnier E (1991) Resource capture, biomass allocation and growth in herbaceous plants. Trends in Ecology & Evolution 6: 126–131.
5. McCarthy MC, Enquist BJ (2007) Consistency between an allometric approach and optimal partitioning theory in global patterns of plant biomass allocation. Ecology 21: 713–720.
6. Shipley B, Meziane D (2002) The balanced-growth hypothesis and the allometry of leaf and root biomass allocation. Functional Ecology 16: 326–331. 7. Osone Y, Tateno M (2003) Effects of stem fraction on the optimization of
biomass allocation and maximum photosynthetic capacity. Functional Ecology 17: 627–636.
8. Hilbert DW (1990) Optimization of plant root: shoot ratios and internal nitrogen concentration. Annals of Botany 66: 91–99.
9. Kitajima K (1994) Relative importance of photosynthetic traits and allocation patterns as correlates of seedling shade tolerance of 13 tropical trees. Oecologia 98: 419–428.
10. Walters MB, Kruger EL, Reich PB (1993b) Growth, biomass distribution and CO 2 exchange of northern hardwood seedlings in high and low light: relationships with successional status and shade tolerance. Oecologia 94: 7–16. 11. Walters MB, Reich PB (2000) Seed size, nitrogen supply, and growth rate affect
tree seedling survival in deep shade. Ecology 81: 1887–1901.
12. Valladares F, Wright SJ, Lasso E, Kitajima K, Pearcy RW (2000) Plastic phenotypic response to light of 16 congeneric shrubs from a Panamanian rainforest. Ecology 81: 1925–1936.
13. Sack L, Grubb PJ (2002) The combined impacts of deep shade and drought on the growth and biomass allocation of shade-tolerant woody seedlings. Oecologia 131: 175–185.
14. Walters MB, Kruger EL, Reich PB (1993a) Relative growth rate in relation to physiological and morphological traits for northern hardwood tree seedlings: species, light environment and ontogenetic considerations. Oecologia 96: 219–231.
15. Field C, Mooney HA (1986) The photosynthesis-nitrogen relationship in wild plants. In: Givnish TJ, ed. On the economy of plant form and function. Harvard Forest: Cambridge University Press. pp 28–49.
16. Hirose T, Kitajima K (1986) Nitrogen uptake and plant growth I. Effect of nitrogen removal on growth of Polygonum cuspidatum. Annals of Botany 58: 479–486.
17. Hikosaka K, Ishikawa K, Borjigidai A, Muller O, Onoda Y (2006) Temperature acclimation of photosynthesis: mechanisms involved in the changes in temperature dependence of photosynthetic rate. Journal of experimental botany 57: 291–302.
18. Farquhar GD, Caemmerer S, Berry JA (1980) A biochemical model of photosynthetic CO 2 assimilation in leaves of C 3 species. Planta 149: 78–90. 19. Atkin OK, Evans JR, Ball MC, Lambers H, Pons TL (2000) Leaf respiration of
snow gum in the light and dark. Interactions between temperature and irradiance. Plant Physiology 122: 915–924.
20. Oguchi R, Hikosaka K, Hiura T, Hirose T (2008) Costs and benefits of photosynthetic light acclimation by tree seedlings in response to gap formation. Oecologia 155: 665–675.
21. Satoh M, Ohyama K (1976) Studies on photosynthesis and translocation of photosynthate in mulberry tree, 5: Utilization of reserve substance in the process of regrowth after shoot pruning in a growing season. Proceedings of the Crop Science Society of Japan 45: 51–56.
22. Murakami T (1983) Studies on the reserve substrate and photosynthesis related to the early growth in cutting proganation of mulberry plant. Bulletin Sericultural Experiment Station Ministry of Agriculture, Forestry and Fisheries 29: 1–164.
23. Tsutsumi T (1989) Forest ecology. Asakura Syoten: Tokyo. 68 p.
24. Chapin III FS (1980) The mineral nutrition of wild plants. Annual review of ecology and systematics 11: 233–260.
25. Reich PB, Walters MB, Tjoelker MG, Vanderklein D, Buschena C (1998b) Photosynthesis and respiration rates depend on leaf and root morphology and nitrogen concentration in nine boreal tree species differing in relative growth rate. Functional Ecology 12: 395–405.
26. Osone Y, Tateno M (2005) Nitrogen absorption by roots as a cause of interspecific variations in leaf nitrogen concentration and photosynthetic capacity. Functional Ecology 19: 460–470.
27. Schreeg LA, Kobe RK, Walters MB (2005) Tree seedling growth, survival, and morphology in response to landscape-level variation in soil resource availability in northern Michigan. Canadian Journal of Forest Research 35: 263–273. 28. Seiwa K (2007) Trade-offs between seedling growth and survival in deciduous
broadleaved trees in a temperate forest. Annals of Botany 99: 537–544. 29. A˚ gren GI, Ingestad T (1987) Root: shoot ratio as a balance between nitrogen
productivity and photosynthesis. Plant Cell Environment 10: 579–586. 30. Gleeson SK (1993) Optimization of tissue nitrogen and root-shoot allocation.
Annals of Botany 71: 23–31.
31. Hilbert DW, Reynolds JF (1991) A model allocating growth among leaf proteins, shoot structure, and root biomass to produce balanced activity. Annals of Botany 68: 417–425.
32. Hirose T, Werger MJA (1987) Maximizing daily canopy photosynthesis with respect to the leaf nitrogen allocation pattern in the canopy. Oecologia 72: 520–526.
33. Hikosaka K, Terashima I (1995) A model of the acclimation of photosynthesis in the leaves of C,3 plants to sun and shade with respect to nitrogen use. Plant
Cell and Environment 18: 605–605.
34. Hikosaka K, Sudoh S, Hirose T (1999) Light acquisition and use by individuals competing in a dense stand of an annual herb, Xanthium canadense. Oecologia 118: 388–396.
35. Ida TY, Kudo G (2008) Timing of Canopy Closure Influences Carbon Translocation and Seed Production of an Understorey Herb, Trillium apetalon (Trilliaceae). Annals of Botany 101: 435–446.
36. Ellsworth DS, Reich PB (1992) Leaf mass per area, nitrogen content and photosynthetic carbon gain in Acer saccharum seedlings in contrasting forest light environments. Functional Ecology 6: 423–435.
37. Walters MB, Reich PB (1996) Are shade tolerance, survival, and growth linked? Low light and nitrogen effects on hardwood seedlings. Ecology 77: 841–853. 38. Niinemets U (1997) Role of foliar nitrogen in light harvesting and shade
tolerance of four temperate deciduous woody species. Journal of Ecology 11: 518–531.
39. Myers JA, Kitajima K (2007) Carbohydrate storage enhances seedling shade and stress tolerance in a neotropical forest. Ecology 95: 383–395.
40. Poorter L (1999) Growth responses of 15 rain-forest tree species to a light gradient: the relative importance of morphological and physiological traits. Functional Ecology 13: 396–410.
41. Reich PB, Tjoelker MG, Walters MB, Vanderklein DW, Buschena C (1998a) Close association of RGR, leaf and root morphology, seed mass and shade tolerance in seedlings of nine boreal tree species grown in high and low light. Functional Ecology 12: 327–338.
42. Givnish TJ (1982) On the adaptive significance of leaf height in forest herbs. American Naturalist 120: 353–381.