AMTD
1, 481–507, 2008CE-DOAS
U. Platt et al.
Title Page
Abstract Introduction
Conclusions References
Tables Figures
◭ ◮
◭ ◮
Back Close
Full Screen / Esc
Printer-friendly Version
Interactive Discussion
Atmos. Meas. Tech. Discuss., 1, 481–507, 2008 www.atmos-meas-tech-discuss.net/1/481/2008/ © Author(s) 2008. This work is distributed under the Creative Commons Attribution 3.0 License.
Atmospheric Measurement Techniques Discussions
Atmospheric Measurement Techniques Discussionsis the access reviewed discussion forum ofAtmospheric Measurement Techniques
Broadband Cavity Enhanced Di
ff
erential
Optical Absorption Spectroscopy
(CE-DOAS) – applicability and corrections
U. Platt1, J. Meinen1,2, D. P ¨ohler1, and T. Leisner1,2 1
Institute for Environmental Physics (IUP), Ruprecht-Karls-University, Heidelberg, Germany
2
Institute for Meteorology and Climate Research, Aerosols and Heterogeneous Chemistry in the Atmosphere (IMK-AAF), Forschungszentrum Karlsruhe GmbH, Germany
Received: 26 November 2008 – Accepted: 3 December 2008 – Published: 23 December 2008 Correspondence to: U. Platt ([email protected])
Published by Copernicus Publications on behalf of the European Geosciences Union.
AMTD
1, 481–507, 2008CE-DOAS
U. Platt et al.
Title Page
Abstract Introduction
Conclusions References
Tables Figures
◭ ◮
◭ ◮
Back Close
Full Screen / Esc
Printer-friendly Version
Interactive Discussion
Abstract
Atmospheric trace gas measurements by cavity assisted long-path absorption spec-troscopy are an emerging technology. An interesting approach is the combination of CEAS with broad band light sources, the broad-band CEAS (BB-CEAS). BB-CEAS lends itself to the application of the DOAS technique to analyse the derived absorption
5
spectra. While the DOAS approach has enormous advantages in terms of sensitivity and specificity of the measurement, an important implication is the reduction of the light path by the trace gas absorption, since cavity losses due to absorption by gases reduce the quality (Q) of the cavity. In fact, at wavelength, where the quality of the BB-CEAS cavity is dominated by the trace gas absorption (esp. at very high mirror reflectivity),
10
the light path will vary inversely with the trace gas concentration and the strength of the band will become nearly independent of the trace gas concentrationcin the cavity, rendering the CEAS Method useless for trace gas measurements. Only in the limiting case where the mirror reflectivity determines Q at all wavelength, the strength of the band as seen by the BB-CEAS instrument becomes proportional to the concentration
15
c. We investigate these relationships in detail and present methods to correct for the cases between the two above extremes, which are of course the important ones in practice.
1 Introduction
Technologies for gas measurements by cavity assisted long-path absorption
spec-20
troscopy are rapidly evolving (e.g. Zalicki and Zare, 1995; Busch and Busch, 1999; Brown, 2003; Ball et al., 2003), a particular application is the analysis of atmospheric trace gases. Initial applications of cavity assisted spectroscopy made use of the anal-ysis of the ring-down time of a passive optical resonator at a wavelength at the peak of an absorption line of the trace gas under investigation. Consequently this technique
25
has become known as Cavity Ring-Down Spectroscopy (CRDS). CRDS instruments
AMTD
1, 481–507, 2008CE-DOAS
U. Platt et al.
Title Page
Abstract Introduction
Conclusions References
Tables Figures
◭ ◮
◭ ◮
Back Close
Full Screen / Esc
Printer-friendly Version
Interactive Discussion
usually use a narrow-band laser as light source (e.g. Brown 2003).
Alternatively, passive resonators can be used to provide long light paths for absorp-tion spectroscopy analysing the transmission of continuous light. This technique has become known as Cavity Enhanced Absorption Spectroscopy (CEAS) (e.g. Engeln et al., 1998; Wheeler et al., 1998; Peeters et al., 2000; Englund, 2000; Fawcett et al.,
5
2002; Brown, 2003; Simpson, 2003; Ball et al., 2004; Fiedler, 2005; Venables et al., 2006; Thompson et al., 2006; Langridge et al., 2006, 2008; Triki et al., 2008; Gherman et al., 2008). An interesting approach is the combination of CEAS with broad band light sources like Xe-arc lamps, LED’s, or broad-band lasers leading to broad-band CEAS (BB-CEAS) (Engeln et al., 1988; Bitter et al., 2005; Meinen et al., 2008). BB-CEAS
10
lends itself to the application of the well known DOAS technique (e.g. Platt et al., 1979; Platt, 1994; Platt and Stutz, 2008) for the analysis of the derived absorption spectra. In fact, combining the advantages of the compact arrangement of long light-paths with the sensitivity and selectivity of DOAS may well prove to become a breakthrough in trace gas measurement technology.
15
Several authors applied BB-CEAS DOAS (or CE-DOAS) for the analysis of BB-CEAS – derived wavelength dependent absorption coefficients (Ball et al., 2004; Bitter et al., 2005; Fiedler et al., 2007; Meinen et al., 2008) and compared results of BB-CEAS measurements to long-path DOAS data. However, to our knowledge there was no systematic study of the implications of applying the DOAS approach to BB-CEAS
mea-20
surements. Especially the above mentioned reduction of the light path by the trace gas absorption (or aerosol extinction), has not been investigated thoroughly. In the following we investigate these relationships in detail and derive a method to correct for the light path reduction due to trace gas absorption i.e. for the cases between the two above extremes, which are of course the important ones in practice.
25
AMTD
1, 481–507, 2008CE-DOAS
U. Platt et al.
Title Page
Abstract Introduction
Conclusions References
Tables Figures
◭ ◮
◭ ◮
Back Close
Full Screen / Esc
Printer-friendly Version
Interactive Discussion
2 Broad-Band – Cavity Enhanced Absorption Spectroscopy (BB-CEAS)
principles
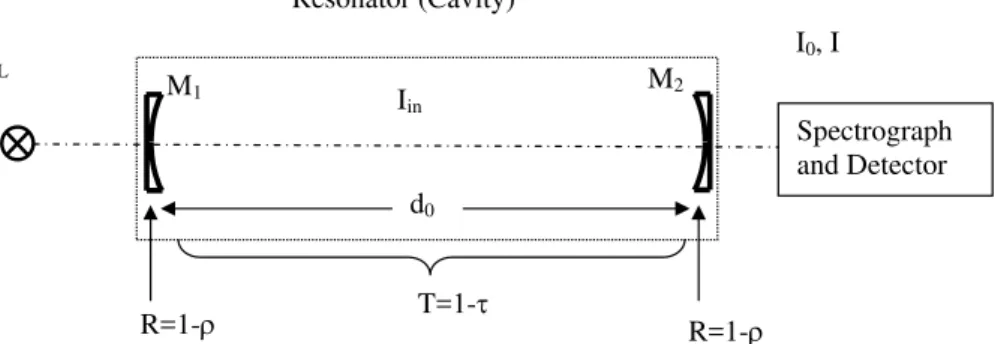
The basic idea of BB-CEAS is to introduce incoherent broadband light (intensityIL) into
an optical resonator (see Fig. 1) consisting of two mirrors with reflectivity R. Initially only the fractionρ=1−R of the radiation emitted by the light source,I
L, will enter the
5
resonator, however, once in the resonator the radiation will be reflected 1/(1−R) times (neglecting other losses) on average (see Appendix A). Finally, in the absence of any extinction in the cavity, half the radiation will leave the resonator through mirror 1, the other half through mirror 2, each fraction will have the intensityI0:
I0=IL·
(1−R) 2 =IL·
ρ
2 (1)
10
The corresponding light path length (i.e. in an evacuated resonator) is:
¯
Lvac=
d0
ρ (2)
Since usually “empty cavity” measurements are made with a purified air filled cavity it is convenient to include the Rayleigh extinctionεR of pure air in an effective mirror reflectivity
15
R0=R−εRd0orρ0=1−R0=1−R+εRd0=ρ+εRd0. (3)
Thus we have:
¯
L0=
d0
ρ0
(4)
If additional (broad band) extinction is assumed, the average length of the absorption path ¯Lwill be approximately:
20
¯
L= d0 ρ0+εBd0
(5)
AMTD
1, 481–507, 2008CE-DOAS
U. Platt et al.
Title Page
Abstract Introduction
Conclusions References
Tables Figures
◭ ◮
◭ ◮
Back Close
Full Screen / Esc
Printer-friendly Version
Interactive Discussion
whereεB denotes all broadband extinctions except Rayleigh scattering, (e.g. due to Mie scattering and broad band trace gas absorption) andd0 is the length of the
res-onator (see Fig. 1).
A detailed discussion of the relationship between reflectance, extinction, and diff er-ential absorption is given by Fiedler (2005) and Fiedler et al. (2005, 2007).
5
From the change of one traverse of the radiation we derive for the derivative of the intensity inside the cavityIin:
−d Iin
d n =Iin·(1−T R) (6)
With:
T =Transmissivity of the cavity (see Fig. 1),
10
R =Reflectivity of the mirror (see Fig. 1, assumed to be equal forM1andM2),
n=number of light traverses through the cavity.
Although in practice n can only assume positive integer values the above equa-tion is derived for any positive value ofn, it is in particular correct for integer values. Equation (6) can be integrated with the boundary condition that the initial light intensity
15
before the first traverse through the cavity isIin(n=0)=Iin(0):
ln I
in(0)
Ii n(n)
=n·(1−T R) (7)
or:
Iin(n)=Iin(0)·exp [n·(T R−1)] (8)
Where Iin(n) denotes the intensity inside the cavity after n reflections (or traverses
20
through the cavity). Re-writing T=1−τ,R=1−ρ with τ,ρ≪1 (note: here we use the symbolτ=1-Transmission, not to be confused with the ring-down time or optical den-sity) we obtain:
T R=(1−τ) (1−ρ)=1−τ−ρ+ τρ |{z}
≈0
≈1−τ−ρ (9)
AMTD
1, 481–507, 2008CE-DOAS
U. Platt et al.
Title Page
Abstract Introduction
Conclusions References
Tables Figures
◭ ◮
◭ ◮
Back Close
Full Screen / Esc
Printer-friendly Version
Interactive Discussion
IntroducingTR from above in the expression for ln[Iin(0)/Iin(n)], Eq. (7), and replacing
ρbyρ0(i.e. considering an air-filled cavity, see Eq. 3):
ln I
in(0)
Iin(n)
=n·(1−T R)≈n·(1−(1−τ−ρ0))=n·(τ+ρ0) (10)
Note that according to Lambert-Beer’s lawτcan be written as:
τ=σ·c¯·d0 (11)
5
With:
σ=Absorption cross section of the trace gas, ¯
c=Average trace gas concentration in the cavity,
d0=Length of the cavity (resonator).
The average number of passes through the cavity ¯n, which the photons travel and
10
the average light path ¯L, results in the decay of the initial intensity inside the cavityIin(0) to the remaining intensityIin( ¯n)=1/e·Iin(0). The proof for this relationship is provided
in Appendix A. Thus, we have from Eq. (10):
ln I
in(0)
Iin( ¯n)
=lne=1≈n¯·(τ+ρ0) (12)
With the average number of traverses of the photons through the cavity and associated
15
average length of the light path we finally derive for the length of the light path ¯L:
¯
n= 1 τ+ρ0
and L¯ =d0·n¯ =
d0
τ+ρ0
= d0 σ·c¯·d
0+ρ0
(13)
Note thatτ includes all extinction processes in the cavity, i.e. aerosol absorption and Mie scattering as well as absorption by trace gases, except those by pure air due to absorption and Rayleigh scattering (which are taken into account by usingρ0 instead
20
ofρ, see above).
AMTD
1, 481–507, 2008CE-DOAS
U. Platt et al.
Title Page
Abstract Introduction
Conclusions References
Tables Figures
◭ ◮
◭ ◮
Back Close
Full Screen / Esc
Printer-friendly Version
Interactive Discussion
In reality the length of the light path ( ¯L0) can be determined by different techniques
e.g. by measuring the ring-down time of the cavity only filled with filtered air (Meinen et al., 2008).
The following examples illustrate the consequences of the above considerations:
1. In a cavity (d0=0.5 m,R0=0.99995 and thusρ=5×10
−5
) without trace gas (τ=0)
5
according to Eq. (13) one would obtain a light path of ¯L0(τ=0)=10 4
m or 10 km (neglecting the contribution from Rayleigh scattering, which would amount to
εRd0≈2.55×10⁻⁶at 622 nm (Penndorf, 1957), i.e. for simplicity takingρ=ρ
0here).
2. Now adding an absorber withτ=5×10⁻⁵to the same cavity we obtain a light path of ¯Lτ=5×10−5
=5×10³m or 5 km.
10
Note that in a high finesse resonator (i.e. one with high mirror reflectivity) a rather weak absorber withτ=d0·ε=5×10
−5
orε=10−4
m−1
is already sufficient to significantly reduce the effective light path. Moreover, if τ=τ(λmax) in the above example denotes
the absorption in the centre of an absorption line, then the light path length may be quite different at any other point of the spectrum (this effect is discussed in more detail
15
in Sect. 4).
Considering an absorption band as sketched in Fig. 2 we have after ntraverses of the cavity (for the moment neglecting any broad band absorption, i.e.Iin0(n)=I
′
in0(n)):
Iin(n)=Iin0(n)·e
−σ·c¯·d0·n
=Iin0(n)·e
−σ·c¯·L
(14)
WhereIin0(n) denotes the intensity in the absence of the absorption band. According
20
to DOAS principles (Platt, 1994; Platt and Stutz, 2008)Iin0(n) can be thought to be
interpolated from the intensity outside the absorption band as illustrated in Fig. 2. The optical density according to the trace gas to be measured thus becomes:
D= +ln I
in0(n)
Iin(n)
=σ·c¯·d0·n=σ·c¯·L (15)
AMTD
1, 481–507, 2008CE-DOAS
U. Platt et al.
Title Page Abstract Introduction Conclusions References Tables Figures ◭ ◮ ◭ ◮ Back Close
Full Screen / Esc
Printer-friendly Version
Interactive Discussion
From Eq. (15) the trace gas concentration inside the cavity ¯ccan be calculated once the absorption cross sectionσ is known (usually from laboratory measurements) and
L(or n) is known. Outside the cavity, i.e. at the detector all intensities are lower by a factor 1−R0=ρ0:
ρ0·I
in(n)=ρ0·Iin0(n)·e
−σ·c¯·L
(16)
5
leading to the same equation forDas given in Eq. (15).
Further consequences of effect of a reduced light path due to absorbers in the cavity are illustrated in the following. The optical density seen by the detector through the second mirror of the cavity,DCE, afterntraverses is given by (here, again we treatnas
a continuous variable, which in reality can only assume discrete values. A derivation
10
with discretenvalues, analogue to Appendix A, is also possible):
DCE=ln
R∞
0 Iin0(n)d n
R∞
0 Iin(n)d n
!
=ln
R∞
0 Iin(0)·e
−ρ0n d n
R∞
0 Iin(0)·e−(ρ0+τ)nd n
!
=ln
R∞
0 e
−ρ0n d n
R∞
0 e
−(ρ0+τ)nd n
!
(17)
The initial intensityIin(0) is a (non-zero) constant and can be taken out of the integral
in the numerator and denominator. Then evaluating the integral yields:
DCE =ln
R∞
0 e
−ρ0n d n
R∞
0 e
−(ρ0+τ)nd n
! =ln −1
ρ0e −ρ0n
∞
0
− 1
ρ0+τe
−(ρ0+τ)n
∞
0
=ln
ρ
0+τ
ρ0
(18)
15
This is the trace gas optical density (or simply the DOAS signal) for a light path ¯L. We like to evaluate this equation for two extreme (but realistic) cases:
1. Forsmall valuesofρ0≪τ(or effective mirror reflectivitiesR=1−ρ0close to unity,
i.e. very good mirrors) we obtain for the optical density due to extinction in the cavity:
20
DCE =ln
τ
+ρ0
ρ0
≈2
τ+ρ0 ρ0
−1
τ+ρ0 ρ0 +1
= 2τ
2ρ0+τ
(19)
AMTD
1, 481–507, 2008CE-DOAS
U. Platt et al.
Title Page
Abstract Introduction
Conclusions References
Tables Figures
◭ ◮
◭ ◮
Back Close
Full Screen / Esc
Printer-friendly Version
Interactive Discussion
Forρ0≪τthe above equation yieldsDCE≈2=constant. In other words, the trace
gas optical density DCE will nearly be independent of the extinction (e.g. due to trace gases) in the cavityτ.
2. For large values of ρ0≫τ (i.e. relatively poor mirror reflectivities and/or high
Rayleigh extinctionsR0=1−ρ0or small trace gas absorption) we have:
5
DCE =ln
ρ0+τ
ρ0
| {z }
≈1
≈ ρ0+τ
ρ0
−1= τ
ρ0
∝τ (20)
Sinceρ0is constant for a given set-upDCE will be proportional toτ=σ·c¯·d0. Only
in the latter case (i.e. poor mirror reflectivities or small trace gas absorption) the measured optical density DCE will indeed be proportional to the trace gas absorp-tionτand thus the trace gas concentration ¯c.
10
An obvious consequence of this finding is that a too high mirror reflectivity (compared to the extinction losses in the cavity) can cause problems and should be avoided. On the other hand, however, a high mirror reflectivity is a prerequisite for long light paths and thus high sensitivity. Therefore, the reflectivityR0cannot usually be made so small
(orρ0so large) that approximation 2 (see above) becomes valid. An optimum strategy
15
therefore, would involve a combination of high reflectivity cavity and correction of the observed optical densities for the effect of light path reduction. In the following, we investigate the implications of this strategy.
In DOAS applications, usually not the total optical density is used to determine trace gas concentrations, but rather the differential absorption i.e. its part rapidly varying with
20
wavelength, therefore the optical densityDCE is split in two portions, which are “slowly”
and a ‘rapidly’ varying with wavelength (Platt, 1994; Platt and Stutz, 2008). For a single trace gas, we have:
DCE =DCE B(λ)+D ′
CE(λ)=L¯ ·c¯
σB(λ)+σ ′
(λ) (21)
AMTD
1, 481–507, 2008CE-DOAS
U. Platt et al.
Title Page
Abstract Introduction
Conclusions References
Tables Figures
◭ ◮
◭ ◮
Back Close
Full Screen / Esc
Printer-friendly Version
Interactive Discussion
where σB(λ) and σ′
(λ) denotes the broad band and “differential” parts of the cross section, respectively. Likewise, the cavity extinction per unit length is written as:
τ=σB(λ)+σ′
(λ)·c¯+ε
B (22)
whereεBdenotes any other broad band extinction except the Rayleigh extinction mea-sured in the “empty” cavity. The corresponding intensities are illustrated in Fig. 2.
5
3 Correction for light path reduction due to extinction in the cavity
In the following we present solutions for the problem of determining the average length of the light path ¯Lin the presence of absorbers in the cavity.
In principle, there are several possibilities:
1. Determine the light path ¯L0with an empty, i.e. air filled, cavity (where replacing
10
R by R0 accounts for the known Rayleigh extinction of air as explained above)
and use the corrected light path length ¯Linstead of L0 for the calculation of the
average trace gas concentration ¯cfrom the measuredD′ CE.
2. Alternatively one may use the “empty cavity” L0 to calculate a concentration c0
fromDCE and then apply a correction factor on the concentration.
15
3. Another possibility is to convert the trace gas absorption cross section σ to a corrected value σeff, which is then used in conjunction with L0 to calculate the concentration ¯cfromDCE.
4. Finally, the measured optical densityDCE may be corrected to obtain a corrected optical densityDeff.
20
All four correction factors will depend on the mirror reflectivityR0 and the extinction in
the cavity including the extinction due to the trace gas optical density. Since the true
AMTD
1, 481–507, 2008CE-DOAS
U. Platt et al.
Title Page
Abstract Introduction
Conclusions References
Tables Figures
◭ ◮
◭ ◮
Back Close
Full Screen / Esc
Printer-friendly Version
Interactive Discussion
trace gas optical density is a priori unknown, usually an iterative procedure has to be applied.
a) We have for the trace gas optical densityDCE (see Fig. 2):
DCE =σ·c¯·L¯ (23)
From the measuredDCE:
5
DCE =σ·c¯·L¯ ⇒L¯ = DCE
σ·c¯ (24)
Combining Eqs. (13) and (24):
¯
L= d0 σ·c¯·d0+ρ0 =
DCE σ·c¯
or: σ·c¯·d0=D
CE·(σ·c¯·d0+ρ0)
¯
c(σ·d−D
CE·σ·d)=DCE·ρ0
(25)
We finally obtain for ¯c:
¯
c= DCE ·ρ0 σ·d0−D
CE·σ·d0
=DCE σ ·
ρ0
d0−DCE·d0
= DCE σ ·
ρ0
d0(1−DCE)
(26)
10
Comparing the above expression with the equations for ¯c, ¯L0 as commonly used in
DOAS applications:
¯
c= DCE σ·L¯
¯
L0=
d0
ρ0
(=path-length in pure air)
We derive the corrected light path length ¯Lwith absorbers:
15
¯
L= ρd0
0
(1−DCE)=L¯0·(1−DCE) (27)
AMTD
1, 481–507, 2008CE-DOAS
U. Platt et al.
Title Page
Abstract Introduction
Conclusions References
Tables Figures
◭ ◮
◭ ◮
Back Close
Full Screen / Esc
Printer-friendly Version
Interactive Discussion
b) Alternatively we obtain the desired correction for the measured concentration:
¯
c=c¯0·
1 1−D
CE
with ¯c0=
DCE σ·L¯0
(28)
As an example, we consider typical values for the differential absorption due to NO3, as measured in the 2007 NO3 and N2O5 intercomparison Campaign at the
SAPHIR atmosphere simulation chamber of the Forschungszentrum J ¨ulich (Dorn et
5
al., 2008; Meinen et al., 2008) with σ′
∼2.2×10⁻¹⁷cm2 (at 662.0 nm, Yokelson et al., 1994), cNO3=2.4×10
9
cm−3 (100 ppt), ¯L0=10 6
cm (10 km), measured D′
CE,0≈0.048.
With these values ¯L becomes (1−0.048)·L¯≈0.95 ¯L0 and the true concentration: ¯
c=c¯01−1DCE≈1.05·c¯0.
Clearly, for higher trace gas concentrations (and hence absorptions) the correction
10
would be even higher.
c) A further alternative is to obtain a corrected absorption cross section:
¯
c= DCE σeff·L¯
0
σeff=σ(1−DCE) (29)
d) Finally, we consider correcting the observed optical density:
Deff =
DCE
1−DCE (30)
15
UsingDeff we can calculate the trace gas concentration according to the usual equa-tion:
¯
c= Deff σ·L¯0
. (31)
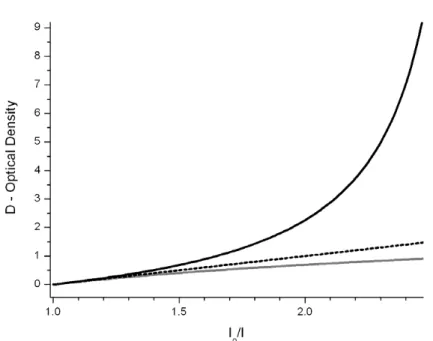
The effect of this correction is illustrated in Fig. 3. Using the example of correcting the optical density as given under point d) above, the figure shows a comparison of the
ef-20
fect of different correction schemes as a function of the absorption (I0/I): No correction,
AMTD
1, 481–507, 2008CE-DOAS
U. Platt et al.
Title Page
Abstract Introduction
Conclusions References
Tables Figures
◭ ◮
◭ ◮
Back Close
Full Screen / Esc
Printer-friendly Version
Interactive Discussion
i.e. the optical density is justDclassic=ln(I0/I), correction commonly used in IBB-CEAS
studies (see e.g. Fiedler, 2005), correction described in this study (Eq. 30). While all expressions agree at low absorptions (I0/Inear unity) there are large deviations at high
absorptions.
Note that IBB-CEAS measurements have been reported where trace gas
concentra-5
tions were underestimated at higher concentration levels in a way compatible with the figures derived above (e.g. Langridge et al., 2006).
4 Distortion of absorption bands due to wavelength-dependent extinction
From Eq. (18) it follows that the (differential) optical density varies as:
DCE =ln
ρ
0+τ
ρ0
(32)
10
ThusDCE(λ) is not a linear function of the (differential) absorption cross section σ(λ),
while in conventional DOAS (or any conventional absorption spectroscopy) we have direct proportionality between the optical densityD(λ) andσ(λ) as shown in Eq. (15).
In the case ofρ0≪τ and thusρ0/τ≪1 (and neglecting the wavelength dependence
ofρ0) Eq. (32) can be linearised to approximately yield proportionality betweenD(λ)
15
andσ(λ). However, as shown above this condition is frequently not fulfilled. Therefore, if notρ≪τ, there will be a distortion of DCE(λ) in the sense thatDCE(λ) is somewhat smaller at larger optical densities than given by the linear relationship (Eq. 15) i.e. in the centre of an absorption band. An example of this behaviour is shown in Fig. 4.
This leads to a change in the shape of the measured absorption spectrum. Using
20
the linear relationship of Eq. (15) to analyse the detected absorption will lead to errors in the retrieved optical density of trace gases as illustrated in Fig. 4. Thus, not only the derived concentration will be incorrect, but also the measurement error increases. This can become a particular problem if the features of several absorbers overlap. Instead of correcting the light path for the centre of the absorption line, we can modify the
25
AMTD
1, 481–507, 2008CE-DOAS
U. Platt et al.
Title Page
Abstract Introduction
Conclusions References
Tables Figures
◭ ◮
◭ ◮
Back Close
Full Screen / Esc
Printer-friendly Version
Interactive Discussion
absorption cross section, which will be used for the analysis (see Sect. 3). We can rewrite the equation for the optical density measured with the cavity:
DCE(λ)=σeff(λ)·c¯·L¯0=σ(λ)
1−D
CE(λ)
·c¯·L¯0 (33)
Instead of using the original absorption cross sectionσ(λ) with the corrected light path, the original determined light path is used with a modified (corrected) absorption cross
5
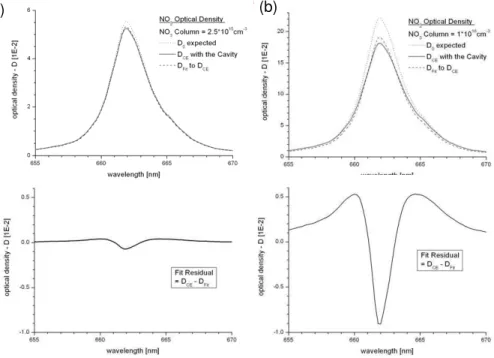
sectionσeff(λ) as described in Sect. 3 under point c). So the modified absorption cross section is changing in the same way with wavelength as the light path length does. One approach is to modify the absorption cross section spectrumσ(λ) before performing the DOAS fit. In the following, we give an example based on recent measurements of ni-trate radicals by CE-DOAS (Meinen et al., 2008). We consider the changing absorption
10
structure of NO3around 662 nm at two different NO3column densities:
1. High NO3 Column: 1×10 16
cm−2 (corresponding to a concentration:
c=1×1010cm−3 or about 400 ppt at room temperature and standard pres-sure at ¯L0=10
6
cm (10 km)).
2. Moderate NO3 Column: 2.5×10 15
cm−2 (corresponding to c=2.5×109cm−3
15
(100 ppt) at the same conditions as above).
The results are shown in Fig. 4. It can be seen that at high optical densities the distorted shape of the absorption structure, leads to considerable errors in the DOAS-fit of the NO3absorption cross section (Fig. 4b, upper panel).
This phenomenon is – in principle – not unknown in DOAS applications where
non-20
linear variation of the optical density with wavelength can occur for different reasons (Platt et al., 1997; Platt and Stutz, 2008). Several techniques were developed to com-pensate for these effects. For instance, there is the effect of insufficient spectral res-olution (e.g. Volkamer et al., 1998; Maurellis et al., 2000 (or the effect of wavelength dependent airmass factors (Marquard et al., 2000) in the case of strong absorbers.
25
In the former case, high-resolution modelling of Lambert-Beer’s law (Volkamer, 2001)
AMTD
1, 481–507, 2008CE-DOAS
U. Platt et al.
Title Page
Abstract Introduction
Conclusions References
Tables Figures
◭ ◮
◭ ◮
Back Close
Full Screen / Esc
Printer-friendly Version
Interactive Discussion
or IMAP-DOAS (Frankenberg et al., 2005) are solutions, although further approaches were suggested. In the latter case “modified DOAS” (Coldewey-Egbers et al., 2004) proved successful to solve the problem. These widely used techniques can also be ap-plied to compensate for the non-linearity encountered in CE-DOAS although the origin of the non-linearity is different from the known cases.
5
5 Practical determination of the correction (e.g. length of the average light path)
The above derived correction formulae (Eqs. 27 through 30) for deriving a corrected light path or to correct the derived concentration etc. are straightforward to apply if the total optical densityDCE due to the total extinction (except extinction due to Rayleigh scattering) in the cavity is known. Unfortunately, it can be difficult to determine this
10
quantity, which is composed of:
1. Total extinction due to all trace gases present in the cavity.
2. Extinction due to Mie scattering.
3. Possibly extinction due to turbulence in the cavity.
The traditional DOAS technique provides the differential optical density (e.g. Platt and
15
Stutz, 2008). This is frequently summed up in the equation for the light intensity after traversing an absorption path:
I(λ)=I0(λ)·exp
−L·
X
j
σ′ j(λ)·c¯j
·exp
−L·
X
j
σjB(λ)·c¯
j
+εR(λ)+εM(λ)
(34)
AMTD
1, 481–507, 2008CE-DOAS
U. Platt et al.
Title Page Abstract Introduction Conclusions References Tables Figures ◭ ◮ ◭ ◮ Back Close
Full Screen / Esc
Printer-friendly Version
Interactive Discussion
Where the first exponential describes the differential optical densityD′
due to different trace gases j to be measured, which varies strongly with wavelength. The second exponential describes rather continuous absorption, which varies smoothly with wave-length (see e.g. Platt, 1994, or Platt and Stutz, 2008). The latter is due to Rayleigh scattering by air molecules (extinction coefficient εR), Mie scattering by atmospheric
5
aerosol (extinction coefficientεM) and a possible continuous fraction of the trace gas absorptions. Thus the total trace absorption cross sectionσ(λ) is split in a “differential” partσ’ (λ) rapidly varying with wavelength (i.e. describing absorption bands or lines) and a rather continuous partσB(λ). Accordingly the optical densities can be written as:
D=ln I
0(λ)
I(λ)
=L· X
j
σ′ j(λ)·c¯j
+L·
X
j
σjB(λ)·c¯j
+εR(λ)+εM(λ)
10
or
D=D′
+DB (35)
with
D′
=L·X
j
σ′ j(λ)·c¯j
andDB=L·
X
j
σjB(λ)·c¯
j
+εR(λ)+εM(λ)
As explained above the termDCE in the correction formulae Eqs. (27) and (28),
re-15
spectively, requires the total optical densityDCE, while the DOAS analysis of the spec-tra only provides the differential optical density D′
CE. Therefore, the application of the
above correction is not straightforward in general. However, there have been a number of techniques developed to solve this problem (see Sect. 4 above):
1. If there are only known absorbers, their total absorption can be calculated from
20
their (measured) differential absorption, there remains, however the problem of possible Mie extinction.
AMTD
1, 481–507, 2008CE-DOAS
U. Platt et al.
Title Page
Abstract Introduction
Conclusions References
Tables Figures
◭ ◮
◭ ◮
Back Close
Full Screen / Esc
Printer-friendly Version
Interactive Discussion
2. The total extinction in the cavity can be determined from the ring-down time (see Meinen et al. (2008). The problem associated with this approach is the possible variation of the mirror reflectivityR(λ) with wavelength, which has to be overcome by modelling the intensity in the cavity as a function of time (Meinen et al., 2008).
3. The total extinction in the cavity can be determined from the reduction in intensity
5
when changing from a pure air filled cavity to an ambient air filled one (Thieser, 2008). The only drawbacks here are the possible change of the cavity quality be-tween measurement and the additional hardware required for periodically sealing the cavity from the ambient air and flushing it with pure air.
4. The effective path length can be determined by determining the differential
10
strength of absorption band(s)DCE,K due to species XK with known column
den-sity per unit length (e.g. of H2O, O2, or O4). Since both,DeffandDCE,K are known
(the former is measured, the latter is calculated from concentration and absorp-tion cross secabsorp-tion (or the product of both quantities in the case of O4).) the optical densityDB due to broad-band absorption (i.e. aerosol optical density) can be
de-15
termined. This technique has been employed by many DOAS applications (e.g. Platt and Stutz, 2008) and was introduced to CEAS by Ball et al. (2004).
5. Another approach is the selective removal of the trace gas X to be measured (in the case of NO3 by e.g. NO-addition or photolysis (see e.g. Brown et al., 2002),
then ¯L in the presence of all continuous absorbers except species X can be
de-20
termined.
6. The effect of Mie scattering can also be neglected in cases where the air is aerosol-filtered during the measurements (e.g. Brown et al., 2001, 2003). How-ever, frequently this is not desirable, since aerosol filters may affect concentration of the trace gas to be measured.
25
AMTD
1, 481–507, 2008CE-DOAS
U. Platt et al.
Title Page
Abstract Introduction
Conclusions References
Tables Figures
◭ ◮
◭ ◮
Back Close
Full Screen / Esc
Printer-friendly Version
Interactive Discussion
6 The optimum mirror reflectivity for CE-DOAS
We showed above that the highest mirror reflectivityR0 is not the best choice for two
reasons:
1. The DOAS signal e.g. the measured differential optical density D′
CE due to the
trace gas will not grow in proportion to 1/ρ0=1/(1−R0) as one would expect from
5
the variation of the light path of the (empty) cavity being proportional to 1/ρ. In factD′
CE grows less than 1/ρ0with improved mirror reflectivity unlessρ0 is much
larger thanτ=σ·c¯·d0.
2. Another factor to keep in mind is the signal to noise ratio of the measured spec-trum. Since the signal reaching the detectorI=ρ·Iin(see Eq. 16) is proportional to
10
ρ=1−R it diminishes as R approaches unity. Assuming the detector noise to be dominated by photon shot noise which is proportional to I1/2 the signal to noise ratio will vary as I−1/2
and one can derive an optimal ρoptS=2·εtot (e.g. Fiedler,
2005). Whereεtot denotes the absorption due to the trace gas.
Combining both arguments one arrives at an optimum mirror reflectivity belowρoptS.
15
However, in practice the mirror reflectivity has to be chosen beforehand, when the actual trace gas concentrations are still unknown, so the mirror reflectivity can only be approximately optimal and the method proposed by Fiedler (2005) is a sufficient approximation.
7 Summary
20
We investigate the relationships between mirror reflectivity and BB-CEAS signal in de-tail and conclude that it is usually not appropriate to operate instruments in a range whereρ0is much larger than τ=σ·c¯·d0 and thus the differential opticalD
′
CE observed
with the cavity enhanced instrument is in good approximation proportional to the trace
AMTD
1, 481–507, 2008CE-DOAS
U. Platt et al.
Title Page
Abstract Introduction
Conclusions References
Tables Figures
◭ ◮
◭ ◮
Back Close
Full Screen / Esc
Printer-friendly Version
Interactive Discussion
gas concentration ¯c. Therefore, in reality corrections have to be performed to com-pensate for the reduced (and variable) light path in the presence of variable (broad band and narrow band) atmospheric extinction. The determination of the extinction is not always straightforward; however, we review a number of techniques to determine atmospheric extinction.
5
Since a large fraction of the atmospheric extinction can be due to aerosol, these techniques (e.g. determination of the differential optical density due to trace gases with known absorption like O2 or O4) also provide means to derive the absolute aerosol extinction from only relative DOAS measurements.
In summary, we present methods to combine the advantages of two highly
success-10
ful techniques: The compact design of high-finesse cavity based absorptions spec-troscopy with the robustness and specificity of the DOAS technique.
Appendix A
This manuscript is based on the concept of an average light path ¯Lof the light travelling in the cavity. Here the foundation of this concept is provided:
15
We consider a light pulse of intensityIL directed onto a cavity consisting of two mir-rors with reflectivityR (and transmittanceρ=1−R) at distance d comprising a medium with transmittanceτ. For the case of simplicity, we will restrict ourselves to two mirrors of identical reflectivity; the general case can be handled in the same fashion with little more effort.
20
The transmitted intensityI0after the first transect of the light pulse through the cavity
will be
I0=IL(1−R) (1−τ) (1−R)=ρ2(1−τ)
The three factors following the initial intensity represent the losses by the passage trough the entrance mirror, the cavity and the exit mirror respectively.
25
AMTD
1, 481–507, 2008CE-DOAS
U. Platt et al.
Title Page
Abstract Introduction
Conclusions References
Tables Figures
◭ ◮
◭ ◮
Back Close
Full Screen / Esc
Printer-friendly Version
Interactive Discussion
Each further round trip in the cavity attenuates the light pulse by a factor (1−ρ)2 (1−τ)2:
The intensity of the light transmitted after the nth round trip through the cavity is given by
In=IL·ρ2·(1−τ)·[(1−ρ)·(1−τ)]2n=I
L·ρ2·(1−τ)·χnwithχ =[(1−ρ) (1−τ)]2
5
The distance this light has travelled within the cavity is:
Ln=d+n·2d =(2n+1)d
The average light path ¯L is then calculated as the average over all possible pathes of the light weighted corresponding to their intensity
¯
L= ∞
P
n=0
Ln·I
n ∞
P
n=0
In
10
The geometrical series in the denominator is solved easily to yield:
∞
X
n=0
In=IL·ρ2·(1−τ)
. (1−χ)
Also the numerator can be summed up analytically to yield:
∞
X
n=0
Ln·In=IL·ρ2·(1−τ)·d·
1+χ
(1−χ)2
Thereby, the average light pass in the cavity is given by
15
¯
L=d· 1+χ 1−χ =d
· 1+(1
−ρ)2·(1−τ)2 1−(1−ρ)2·(1−τ)2
=d· 2
−2ρ−2τ+ρ2+τ2+4ρτ−2ρ2τ−2ρτ2+ρ2τ2 2ρ+2τ−ρ2−τ2−4ρτ+2ρ2τ+2ρτ2−ρ2τ2
AMTD
1, 481–507, 2008CE-DOAS
U. Platt et al.
Title Page
Abstract Introduction
Conclusions References
Tables Figures
◭ ◮
◭ ◮
Back Close
Full Screen / Esc
Printer-friendly Version
Interactive Discussion
Note that this is the complete analytical expression for the average light path within a lossy and absorbing cavity without any assumptions about the size ofρ orτ. Only if both ρ and τ are much smaller than unity, as it is usually the case in CEAS, higher order terms may be neglected and we arrive at the well known expression ¯L≈ d
ρ+τ as it
is used throughout the manuscript.
5
References
Ball, S. M., Langridge, J. M., and Jones, R. L.: Broadband cavity enhanced absorption spec-troscopy using light emitting diodes, Chem. Phys. Lett., 398, 68–74, 2004.
Bitter, M., Ball, S. M., Povey, I. M., and Jones, R. L.: A broadband cavity ringdown spectrometer for in-situ measurements of atmospheric trace gases, Atmos. Chem. Phys., 5, 2547–2560,
10
2005, http://www.atmos-chem-phys.net/5/2547/2005/.
Brown, S. S., Stark, H., Ciciora, S. J., and Ravishankara, A. R.: In-situ measurement of at-mospheric NO3 and N2O5 via cavity ring-down spectroscopy, Geophys. Res. Lett., 28(17), 3227–3230, 2001.
Brown, S. S., Stark, H., Ciciora, S. J., McLaughlin, R. J., and Ravishankara, A. R: Simultaneous
15
in-situ detection of atmospheric NO3and N2O5via cavity ring-down spectroscopy, Rev. Sci. Instrum., 73(9), 3291–3301, 2002.
Brown, S. S.: Absorption spectroscopy in high-finesse cavities for atmospheric studies, Chem. Rev., 103(12), 5219–5238, 2003.
Busch, K. W. and Busch, M. A. (Eds): Cavity-Ringdown Spectroscopy: An
Ultratrace-20
Absorption Measurement Technique, ACS Symposium No. 720 (1997), ACS Washington D.C., ISBN13: 9780841236004, ISBN10: 0841236003, 1999.
Coldewey-Egbers, M., Weber, M., Buchwitz, M., and Burrows, J. P.: Application of a modified DOAS method for total ozone retrieval from GOME data at high polar latitudes, Adv. Space Res., 34(4), 749–753, 2004.
25
Demtr ¨oder, W.: Laser Spectroscopy, Springer Verlag, Berlin, Heidelberg, New York, 1981. Engeln, R., Berden, G., Peeters, R., and Meijer, G.: Cavity enhanced absorption and cavity
enhanced magnetic rotation spectroscopy, Rev. Sci. Instrum., 69, 3763–3769, 1998.
Englund, D. R.: Cavity-Enhanced Absorption Spectroscopy of BChla, BSc. Thesis, California Institute of Technology, Pasadena, California, 2002.
30
Fawcett, B. L., Parkes, A. M., Shallcross, D. E., and Orr-Ewing, A. J.: Trace detection of
AMTD
1, 481–507, 2008CE-DOAS
U. Platt et al.
Title Page
Abstract Introduction
Conclusions References
Tables Figures
◭ ◮
◭ ◮
Back Close
Full Screen / Esc
Printer-friendly Version
Interactive Discussion methane using continuous wave cavity ring-down spectroscopy at 1.65µm, Phys. Chem.
Chem. Phys., 4, 5960–5965, 2002.
Fiedler, S. E.: Incoherent Broad-Band Cavity-Enhanced Absorption Spectroscopy, Ph. D. The-sis, D83 Faculty II – Mathematics and Sciences, Technische Universit ¨at Berlin, 2005. Fiedler, S. E., Hese, A., and Heitmann, U.: Influence of the cavity parameters on the output
5
intensity in incoherent broadband cavity-enhanced absorption spectroscopy, Rev. Sci. Instr., 78, 073104, doi:10.1063/1.2752608, 2007.
Frankenberg, C., Platt, U., and Wagner, T.: Iterative maximum a posteriori (IMAP)-DOAS for retrieval of strongly absorbing trace gases: Model studies for CH4 and CO2 retrieval from near infrared spectra of SCIAMACHY onboard ENVISAT, Atmos. Chem. Phys., 5, 9–22,
10
2005, http://www.atmos-chem-phys.net/5/9/2005/.
Gherman, T., Venables, D. S., Vaughan, S., Orphal, J., and Ruth, A. A.: Incoherent Broadband Cavity-Enhanced Absorption Spectroscopy in the near-Ultraviolet: Application to HONO and NO2, Environ. Sci. Technol., 42, 890–895, 2008.
Langridge, J. M., Stephen, M. B., and Jones, R. L.: A compact broadband cavity enhanced
ab-15
sorption spectrometer for detection of atmospheric NO2using light emitting diodes, Analyst, 131, 916–922, 2006.
Langridge, J. M., Laurilla, T., Watt, R. S., Jones, R. L., Kaminski, C. F., and Hult, J.: Cavity enhanced absorption spectroscopy of multiple trace gas species using a supercontinuum radiation source, Optics Express, 16, 10178–10188, 2008.
20
Marquard, L. C., Wagner, T., and Platt, U.: Improved approaches for the calculation of air mass factors required for scattered light differential optical absorption spectroscopy, J. Geophys. Res., 105, 1315–1327, 2000.
Maurellis, A. N., Lang, R., van der Zande, W. J.: A new DOAS parametrization for retrieval of trace gases with highly-structured absorption spectra, Geophys. Res. Lett., 27, 4069–4072,
25
2000.
Meinen, J., Thieser, J., Platt, U., and Leisner, T.: Using a high finesse optical resonator to provide a long light path for differential optical absorption spectroscopy: CE-DOAS, Atmos. Chem. Phys. Discuss., 8, 10665–10695, 2008,
http://www.atmos-chem-phys-discuss.net/8/10665/2008/.
30
Peeters, R., Berden, G., Apituley, A., and Meijer, G.: Open-path trace gas detection of am-monia based on cavity-enhanced absorption spectroscopy, Appl. Phys. B, 71, 231–236, doi:10.1007/s003400000302, 2000.
AMTD
1, 481–507, 2008CE-DOAS
U. Platt et al.
Title Page
Abstract Introduction
Conclusions References
Tables Figures
◭ ◮
◭ ◮
Back Close
Full Screen / Esc
Printer-friendly Version
Interactive Discussion Platt, U.: Differential optical absorption spectroscopy (DOAS), in: Air Monitoring by
Spectro-scopic Techniques, edited by: Sigrist, M. W., Chemical Analysis Series, John Wiley & Sons, Inc., vol. 127, ISBN 0-471-55875-3, pp. 27–84, 1994.
Platt, U. Marquard, L., Wagner, T., and Perner, D.: Corrections for zenith scattered light DOAS, Geophys. Res. Lett., 24, 1759–1762, 1997.
5
Platt, U. and Stutz, J.: Differential Optical Absorption spectroscopy, Principles and Applications, Springer, XV, 597 p. 272 illus., 29 in color, Physics of Earth and Space Environments, ISBN 978-3-540-21193-8, 2008.
Siegman, A. E.: Lasers, University Science Books, Mill Valley, 1986, Chapter 14, pp 558–579, 1986.
10
Simpson, W. R.: Continuous wave cavity ring-down spectroscopy applied to in situ detection of dinitrogen pentoxide (N2O5), Rev. Sci. Instr., 74(7), 3442–3452, 2003.
Thompson, J. E. and Spangler, H. D.: Tungsten source integrated cavity output spectroscopy for the determination of ambient atmospheric extinction coefficient, Appl. Phys. B, 91, 195–201, 2006.
15
Triki, M., Cermak, P., M ´ejean, G., and Romanini, D.: Cavity-enhanced absorption spectroscopy with a red LED source for NOx trace analysis, Appl. Phys. B, 91, 195–201, 2008.
Venables, D. S., Gherman, T., Orphal, J., Wenger, J. C., and Ruth, A. A.: High Sensitive in Situ Monitoring of NO3in an Atmospheric Simulation Chamber Using Incoherent Broadband Cavity-Enhanced Absorption Spectroscopy, Environ. Sci. Technol., 40, 6758–6763, 2006.
20
Volkamer, R., Etzkorn, T., Geyer, A., and Platt, U.: Correction of the oxygen interference with UV spectroscopic (DOAS) measurements of monocyclic aromatic hydrocarbons in the atmo-sphere, Atmos. Environ., 32, 3731–3747, 1998.
Volkamer, R.: A DOAS Study on the Oxidation Mechanism of Aromatic Hydrocarbons un-der Simulated Atmospheric Conditions, Doktoral Thesis, University of Heidelberg, Germany,
25
2001.
Wheeler, M. D., Newman, S. M., Orr-Ewing, A. J., and Ashfold, M. N. R.: Cavity ring-down spectroscopy, J. Chem. Soc., Faraday Trans., 94(3), 337–351, 1998.
Yokelson, R. J., Burkholder, J. B., Fox, R. W., Talukdar, R. K., and Ravishankara, A. R.: Tem-peratureDependence of the NO3 Absorption Spectrum, J. Phys. Chem., 98, 13144–13150,
30
1994.
Zalicki, P. and Zare, R. N.: Cavity ring-down spectroscopy for quantitative absorption measure-ments, J. Chem. Phys., 102(7), 2708–2717, 1995.
AMTD
1, 481–507, 2008CE-DOAS
U. Platt et al.
Title Page
Abstract Introduction
Conclusions References
Tables Figures
◭ ◮
◭ ◮
Back Close
Full Screen / Esc
Printer-friendly Version
Interactive Discussion
Resonator (Cavity)
IL
M1 M2
d0
Iin
R=1-ρ T=1-τ R=1-ρ
Spectrograph and Detector I0, I
ρ
τ ε
Fig. 1.Sketch of CEAS set-up. The optical resonator is formed by two concave mirrorsM1and
M2, both with the same reflectivityR=1−ρ. The transmission factor for one traverse through
the cavity isT=1−τ=1−εd0. The intensity of the radiation emitted by the source isIL(transfer
optics between light source and resonator is not shown).
AMTD
1, 481–507, 2008CE-DOAS
U. Platt et al.
Title Page
Abstract Introduction
Conclusions References
Tables Figures
◭ ◮
◭ ◮
Back Close
Full Screen / Esc
Printer-friendly Version
Interactive Discussion
I
in(n
0)
I
in0(n
0)
I
in(n)
I’
in0(n)
I
λ
Fig. 2.Sketch of intensities vs. wavelength:Iin0(n0): intensity (aftern0passes through the
cav-ity) in the pure air filled cavity without any absorbers,I′
in0(n): intensity (afternpasses through
the cavity) after any continuous absorption (due to gases or aerosol) has taken place. Iin(n): Intensity afternpasses through the cavity including also differential absorptions (note thatn
varies with wavelength since the trace gas absorption cross section varies with wavelength).
Iin(n0): Theoretical intensity for the same absorptions if the number of traverses were not re-duced.
AMTD
1, 481–507, 2008CE-DOAS
U. Platt et al.
Title Page
Abstract Introduction
Conclusions References
Tables Figures
◭ ◮
◭ ◮
Back Close
Full Screen / Esc
Printer-friendly Version
Interactive Discussion Fig. 3.Comparison of the effect of different correction schemes as a function of the absorption
(I0/I), whereI andI0 correspond to the integral of the total intensity in the cavity as given in
Eq. (17). Gray line: No correction, i.e. the optical density is justDCE; see Eq. (17). Dotted line: Correction commonly used in IBB-CEAS studies (see e.g. Fiedler, 2005). Drawn line:Deff,
correction described in this study (Eq. 30). While all expressions agree at low absorptions (I0/I
near unity) there are large deviations at high absorptions.
AMTD
1, 481–507, 2008CE-DOAS
U. Platt et al.
Title Page
Abstract Introduction
Conclusions References
Tables Figures
◭ ◮
◭ ◮
Back Close
Full Screen / Esc
Printer-friendly Version
Interactive Discussion
(a) (b)
⋅
λ
⋅
λ
Fig. 4. The effect of the distortion of absorption bands due to different light paths in the band centre and at the wings. Here an NO3 band at 662 nm is used as an example. (a) At low optical densitiesD≪1 (NO3column 2.5×1015cm−2) the effect of changing absorption structure
is rather small, the actual line shapeDCE(λ) fits the expected line shape calculated forD be-ing independent of wavelength quite well. The arisbe-ing residual (lower panel) is small and will not significant increase the measurement error. (b)At higher optical densities (NO3 column 10×1015cm−2) the distortion in the shape of the absorption structure becomes clearly visible
and leads to errors in the fit of the NO3absorption cross section (upper panel). The expected optical densityD0is significantly different from the detected optical densityDCE(λ) actually re-trieved. The rather large fitting residual (lower panel) indicates an enhanced measurement error.