www.atmos-meas-tech.net/3/1797/2010/ doi:10.5194/amt-3-1797-2010
© Author(s) 2010. CC Attribution 3.0 License.
Measurement
Techniques
Inherent calibration of a blue LED-CE-DOAS instrument
to measure iodine oxide, glyoxal, methyl glyoxal, nitrogen dioxide,
water vapour and aerosol extinction in open cavity mode
R. Thalman1and R. Volkamer1,2
1Department of Chemistry and Biochemistry, University of Colorado, Boulder, CO, 80309, USA 2Cooperative Institute for Research in Environmental Sciences (CIRES), Boulder, CO, 80309, USA Received: 1 May 2010 – Published in Atmos. Meas. Tech. Discuss.: 24 June 2010
Revised: 3 December 2010 – Accepted: 13 December 2010 – Published: 22 December 2010
Abstract. The combination of Cavity Enhanced
Absorp-tion Spectroscopy (CEAS) with broad-band light sources (e.g. Light-Emitting Diodes, LEDs) lends itself to the ap-plication of cavity enhanced Differential Optical Absorption Spectroscopy (CE-DOAS) to perform sensitive and selec-tive point measurements of multiple trace gases and aerosol extinction with a single instrument. In contrast to other broad-band CEAS techniques, CE-DOAS relies only on the measurement of relative intensity changes, i.e. does not require knowledge of the light intensity in the absence of trace gases and aerosols (I0). We have built a prototype LED-CE-DOAS instrument in the blue spectral range (420– 490 nm) to measure nitrogen dioxide (NO2), glyoxal (CHO-CHO), methyl glyoxal (CH3COCHO), iodine oxide (IO), water vapour (H2O) and oxygen dimers (O4). We demon-strate the first direct detection of methyl glyoxal, and the first CE-DOAS detection of CHOCHO and IO. The instru-ment is further inherently calibrated for light extinction from the cavity by observing O4or H2O (at 477 nm and 443 nm) and measuring the pressure, relative humidity and tempera-ture independently. This approach is demonstrated by exper-iments where laboratory aerosols of known size and refrac-tive index were generated and their extinction measured. The measured extinctions were then compared to the theoretical extinctions calculated using Mie theory (3–7×10⁻⁷cm−1). Excellent agreement is found from both the O4and H2O re-trievals. This enables the first inherently calibrated CEAS measurement at blue wavelengths in open cavity mode, and eliminates the need for sampling lines to supply air to the cavity, i.e., keep the cavity enclosed and/or aerosol free.
Correspondence to: R. Volkamer
Measurements in open cavity mode are demonstrated for CHOCHO, CH3COCHO, NO2, H2O and aerosol extinction. Our prototype LED-CE-DOAS provides a low cost, yet re-search grade innovative instrument for applications in simu-lation chambers and in the open atmosphere.
1 Introduction
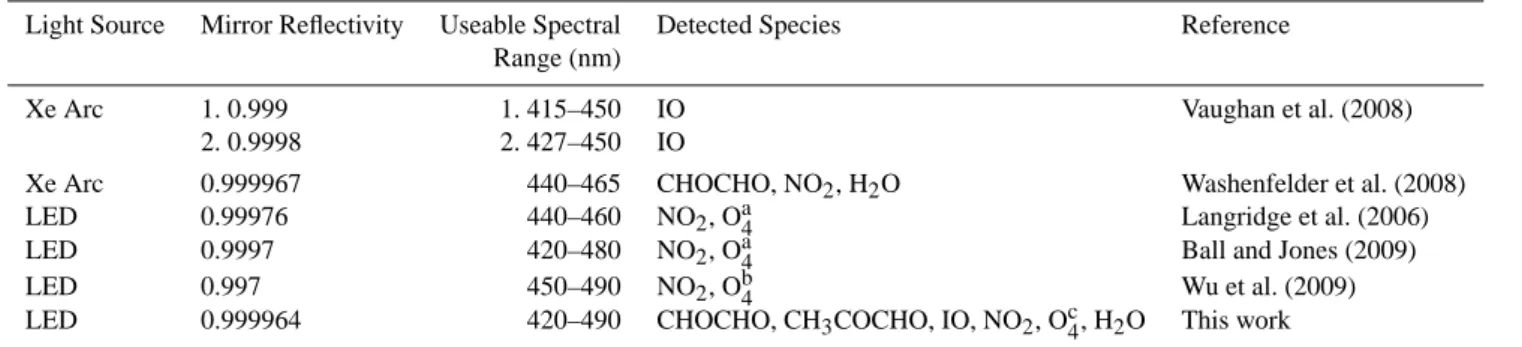
Table 1. Previous CEAS instruments in the blue spectral range.
Light Source Mirror Reflectivity Useable Spectral Detected Species Reference Range (nm)
Xe Arc 1. 0.999 1. 415–450 IO Vaughan et al. (2008) 2. 0.9998 2. 427–450 IO
Xe Arc 0.999967 440–465 CHOCHO, NO2, H2O Washenfelder et al. (2008) LED 0.99976 440–460 NO2, Oa4 Langridge et al. (2006) LED 0.9997 420–480 NO2, Oa4 Ball and Jones (2009) LED 0.997 450–490 NO2, Ob4 Wu et al. (2009) LED 0.999964 420–490 CHOCHO, CH3COCHO, IO, NO2, Oc4, H2O This work
aIn pure O
2at 446 (25 times enhancement of O4over ambient conditions). bIn pure O
2at 477 nm. cIn ambient air at 446 and 477 nm.
Langridge et al., 2006, 2008a,b; Gherman et al., 2008; Triki et al., 2008; Washenfelder et al., 2008; Wu et al., 2009), the nitrate radical (NO3) (Ball et al., 2004; Venables et al., 2006; Langridge et al., 2006, 2008a,b; Gherman et al., 2008; Meinen et al., 2008; Triki et al., 2008; Schuster et al., 2009), dinitrogen pentoxide (N2O5) (Schuster et al., 2009), nitrous acid (HONO) (Gherman et al., 2008), water vapor (H2O) (Venables et al., 2006; Langridge et al., 2008a,b; Washen-felder et al., 2008), ozone (O3) (Venables et al., 2006; Chen and Venables, 2010), oxygen dimer (O4) (Langridge et al., 2006; Chen and Venables, 2010), iodine (I2) (Ball et al., 2004; Vaughan et al., 2008; Dixneuf et al., 2009), iodine monoxide (IO) (Vaughan et al., 2008), iodine dioxide (OIO) (Vaughan et al., 2008), bromine oxide (BrO), sulfur diox-ide (SO2) (Chen and Venables, 2010), and glyoxal (CHO-CHO) (Washenfelder et al., 2008). CEAS techniques have also been used to measure the rather “broad band” absorp-tion cross secabsorp-tion spectra of acetone, butanone, and 2-pentanone (Chen and Venables, 2010). Available CEAS in-struments to measure atmospheric trace gases in the blue spectral range (420–490 nm) are shown in Table 1. These techniques have incorporated both Xe-arc lamps and LEDs as light sources.
Traditional CEAS techniques rely on absolute intensity measurements to determine trace gas extinctions (Fiedler et al., 2003). Such measurements are susceptible to lamp drifts. Additionally, the ability of existing CEAS techniques to separate and quantify the temporal variability of extinction losses due to aerosols, turbulence, and changes in the mir-ror reflectivity and/or cavity alignment from the trace gases of interest remains poorly developed. CEAS measurements to date require frequent calibration measurements, which are time consuming and reduce the duty cycle of measure-ments. Further, the temporal variability of aerosol extinc-tion in the atmosphere poses a major challenge to measure-ments in open cavity mode, and aerosols often need to be removed from the cavity by means of filtration in sampling
lines to enable quantitative measurements. Cavity Enhanced Differential Optical Absorption Spectroscopy (CE-DOAS) is a novel CEAS technique under development (Meinen et al., 2008; Platt et al., 2009). CE-DOAS in principle holds promise to retrieve both aerosol and trace gas information simultaneously, but this potential had as of yet not been systematically exploited. CE-DOAS and other CEAS tech-niques have in common the use of a high finesse optical cav-ity coupled to a broad band light source; broad areas of the spectrum (several 10 nm) are simultaneously measured by means of a single detector (multiplexing advantage). DOAS retrievals are inherently insensitive to variations in the abso-lute light intensity (Platt and Stutz, 2008), as DOAS relies on measuring narrow band (<3–5 nm FWHM) “differential” absorption features of trace gases; the differential absorption is independent of intensity variations, i.e., does not require knowledge of the light intensity in the absence of absorbers,
I0. In particular, lamp drifts or the presence of aerosols, both broadband processes, do not affect the fitting of nar-row band structures, which a DOAS retrieval separates from broad band extinction by means of numerical high-pass filter-ing of the spectra. First attempts have coupled CEAS hard-ware with a DOAS retrieval algorithm (Meinen et al., 2008), and discussed the peculiarities of differential retrievals in op-tical cavities (Platt et al., 2009). Platt et al. (2009) showed that the average (1/e) path length in the cavity is given by the following equation:
Leff(λ) =
d0
1−R(λ)+εRay(λ)d0+εMie(λ)d0+6σicid0 (1) whered0 is the cavity length, R is the mirror reflectivity, εRay, is the extinction due to Rayleigh scattering, εMie is the extinction due to aerosols andσi is the absorption
cross-section of a trace absorber of concentration ci. The
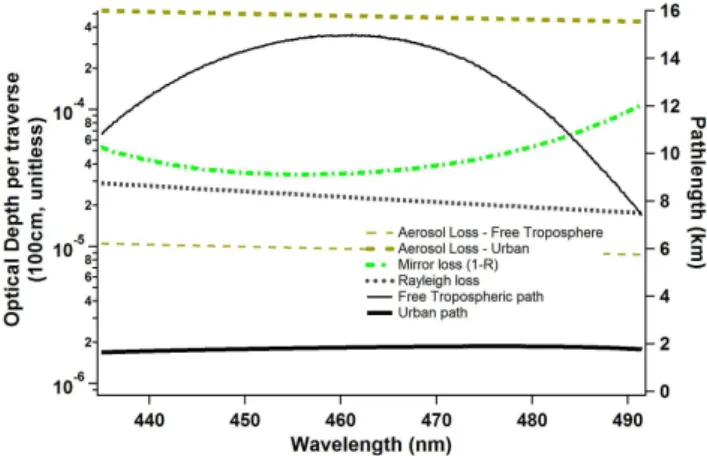
for the reduction in path length caused by temporally vari-able aerosol extinction, or other causes for varivari-able cavity throughput. The strong sensitivity of Eq. (1) towards aerosol extinction is illustrated in Fig. 1, where the individual ex-tinction losses are shown for our cavity. As the exex-tinction loss becomes larger than the mirror loss or the Rayleigh loss, the effective path length decreases. Furthermore, the dif-ferent contributions to the overall extinction have difdif-ferent wavelength dependencies. The effective wavelength depen-dent path length is thus no longer determined exclusively by R, and εRay, and their known wavelength dependen-cies. Aerosols are highly variable in the atmosphere, and as a result the effective path length becomes time depen-dent. Moreover, the wavelength dependence in Eq. (1) is no longer necessarily well defined. Past attempts to char-acterize broad band extinction losses by means of separate extinction calibration measurements have mostly been lim-ited to the characterization of mirror reflectivity by the use of O4 in pure oxygen (25 times higher O4abundance over atmospheric conditions, O4measured at 446 nm and 532 nm bands) (Langridge et al., 2006; Ball and Jones, 2009; Ball et al., 2009), NO2(using a known NO2mixture) (Langridge et al., 2006; Venables et al., 2006; Gherman et al., 2008; Triki et al., 2008; Vaughan et al., 2008) or CO2 (Orphal and Ruth, 2008). Aerosol extinction measurements based on relative retrievals have been discussed at red wavelengths (Varma et al., 2009); in the blue spectral range previous at-tempts to measure aerosol extinction required knowledge of
Io (Washenfelder et al., 2008). An inherent means to cal-ibrate path length in the blue spectral range as a function of wavelength under atmospheric conditions in the presence of variable atmospheric turbulence, aerosols and/or cavity throughput are desirable, and are currently missing.
The blue spectral range holds great potential to detect mul-tiple interesting molecules simultaneously in the atmosphere. Glyoxal is the smallest alpha-dicarbonyl and a novel indica-tor species for fast photochemistry of volatile organic com-pounds (VOCs) on local (Volkamer et al., 2005b; Sinreich et al., 2007) and global scales (Kurosu et al., 2005; Wittrock et al., 2006; Vrekoussis et al., 2009). The global CHOCHO source from land ranges between 50 and 108 Tg yr−1, with a single VOC precursor, isoprene, contributing ca. 30% to the currently known sources (Myriokefalitakis et al., 2008; Fu et al., 2008; Stavrakou et al., 2009), but about half of the ter-restrial source is currently unaccounted for (Stavrakou et al., 2009). Recent measurements demonstrate the uncertainties in the amount of glyoxal formed from isoprene (Volkamer et al., 2005a). Current isoprene oxidation schemes consider glyoxal to be only a second and higher generation oxidation product (Bloss et al., 2005; Taraborrelli et al., 2009), while theoretical predictions (Dibble, 2004a,b) suggest a pathway that forms glyoxal also as a first generation product. Such “prompt” formation of glyoxal was demonstrated to form in yields of up to 3% from the isoprene + OH reaction (Volka-mer et al., 2005a). This corresponds to about an additional
Fig. 1. Aerosols can strongly affect the effective path length. The
wavelength dependent extinction losses (dotted lines) are: mirror loss (1−R) of our cavity (green dashed-dotted line), Rayleigh scat-tering loss of air at 1 atm (gray dotted line), and aerosol losses for two scenarios: free tropospheric conditions (εMie= 1×10⁻⁷cm−1 at 450 nm, thin dashed line); and polluted urban conditions (5×10⁻⁶cm−1at 450 nm, thick dashed line). The wavelength de-pendence of aerosol extinction was approximated asλ−1.5. The corresponding effective path length for both scenarios is shown by the respective solid lines.
10 Tg/yr of a glyoxal source on global scales that is currently not reflected in atmospheric models. While significant, it does not explain all of the missing glyoxal in biogenic ar-eas. Further, there is also consistent evidence that CHOCHO is a building block for secondary organic aerosol (SOA) for-mation (Jang et al., 2002; Hastings et al., 2005; Liggio et al., 2005; Volkamer et al., 2007, 2009b; Galloway et al., 2009; Tan et al., 2009; Ervens and Volkamer, 2010). SOA is a con-cern for public health (Villalobos-Pietrini et al., 2007) and elevated SOA is linked to increased mortality rates (Pope and Dockery, 2006).
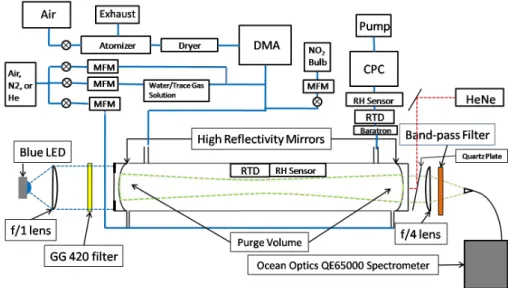
Fig. 2. Schematic of cavity set up and block diagram of flow handling system for aerosol delivery.
resulting temporal variability of the Xe-gas emission lines complicates DOAS applications of Xe-arc lamps in this spec-tral range. As the number of commercially available high-powered LEDs has increased, LEDs are starting to provide an interesting alternative light source to Xe-arc lamps that is particularly attractive to make the blue spectral range more accessible. Here we present an innovative prototype instru-ment that actively addresses these challenges, and enables the first inherently calibrated CEAS measurement of trace gases and aerosol extinction in the blue spectral range by a single measurement in open cavity mode under atmospheric conditions.
2 Experimental
2.1 Description of LED-CE-DOAS instrument
Figure 2 depicts the set up of the LED-CE-DOAS instrument along with the gas delivery and aerosol generation and sizing instrumentation, i.e., an atomizer, differential mobility an-alyzer (DMA), condensation particle counter (CPC). Light from the LED is collimated and directed into the optical cav-ity where it makes many passes through the sample volume and is then focused onto the optical fiber and detected by the spectrometer/detector system attached.
2.1.1 Characterization of LED light sources
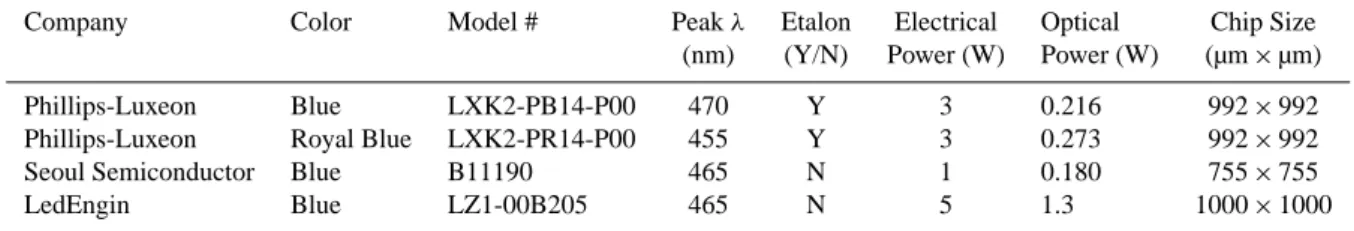
The criteria for a suitable blue LED for LED-CE-DOAS are: (1) lack of a Fabry-P´erot etalon; (2) match well with the expected reflectivity of the mirrors (Fig. 3a); (3) high light output, and (4) reasonably small chip size (<1 mm2). Vari-ations of etalon structures, which are periodic emission fea-tures arising from the difference in the refractive indices of
the coating layers on the LED chip, are caused by fluctua-tions in either the current (amperage) or the temperature of the LED chip, and can complicate the elimination of spectral features from the LED emission spectrum thus introducing residual structures that limit the sensitivity of the DOAS ap-proach. A good match of LED andR consists in suitable optical power output of the LED, limited out of band light from single pass transmission through the cavity, with the overall effect that the intensity past the cavity is reasonably constant (balanced) over the dynamic range of the detector (Ball et al., 2004; Ball and Jones, 2009). While the presence of etalon structures does not present a fundamental limitation (it can be eliminated by temperature stabilizing the LED, in combination with an extra stable power supply, and/or view-ing the LED at an angle) (Kern et al., 2006; Sihler et al., 2009), the absence of etalon structures is desirable.
Table 2. Properties of LEDs that were tested in the blue spectral range.
Company Color Model # Peakλ Etalon Electrical Optical Chip Size (nm) (Y/N) Power (W) Power (W) (µm×µm)
Phillips-Luxeon Blue LXK2-PB14-P00 470 Y 3 0.216 992×992 Phillips-Luxeon Royal Blue LXK2-PR14-P00 455 Y 3 0.273 992×992 Seoul Semiconductor Blue B11190 465 N 1 0.180 755×755 LedEngin Blue LZ1-00B205 465 N 5 1.3 1000×1000
2.1.2 Characterization of the optical cavity and mirror reflectivity
The optical cavity (Fig. 2) consists of two 1 inch diameter mirrors with a one meter radius of curvature and a mea-sured reflectivity of 99.9964% at 455 nm (Advanced Thin Films- Boulder, CO), which are mounted 99.0 cm apart. Out of band light was removed using a colored glass fil-ter (Schott GG420) before the cavity and a band-pass filfil-ter (Newport 10BPF70-450, λ= 450 nm, FWHM = 70 nm) be-fore the fiber. The effect of the cavity and the optical fil-ters is demonstrated in Fig. 3b. The GG420 is used to avoid saturating the detector while maximizing the use of the de-tector in the region of interest. The band-pass filter was used to suppress the out of band light at longer wavelengths. If the spectrometer system has any issues with out of band light projection this can introduce stray light into the measurement spectra because the out of band light is orders of magnitude more intense than the measurement light in the region of in-terest. Light from the LED was collimated into the cavity by a 2 inch diameter f/1 lens and focused onto the fiber af-ter the cavity by a 1 inch diameaf-ter f/4 lens (Thorlabs). The cavity and mirror mounts are designed so that the cavity can be enclosed using a 1 inch diameter stainless steel or Teflon tube.
After alignment the mirror reflectivity was determined using Rayleigh scattering as described in Washenfelder et al. (2008) by flowing helium in the cavity for a reference spectrum followed by air or nitrogen:
R(λ) = 1 −d0 I
N2(λ) IHe(λ) ε
N2 Ray(λ)
− εRayHe(λ)
1 −IN2(λ)
IHe(λ)
, (2)
whered0is the cavity length andεRayis the extinction due to Rayleigh scattering andIN2andIHeare the intensities of the helium and nitrogen spectra respectively.
2.1.3 The spectrometer and detector systems
The light exiting the cavity was focused onto an optical fiber. Two different sets of transfer optics and detector sys-tems were used: (1) light was coupled via a 1 inch f/4 lens onto a 1mm diameter, f/4 glass optical fiber (Ocean Optics)
Fig. 3. (A) Emission spectra of several LEDs and a Xe arc lamp
compared to mirror reflectivity. (B) Example spectra illustrate the effect of each optical filter element (cavity mirrors, GG420 cut-off filter, band-pass filter) on spectral intensity.
vertically in front of the slit of an Acton 2300i spectrometer, which was coupled with a PIXIS400 CCD Camera (Roper Scientific). In the Acton 2300i a f/3.9 Czerny-Turner 300 mm focal length spectrometer was used with a 1200 grooves/mm grating blazed at 450 nm. The PIXIS400 camera used a 8 mm high 26.8 mm wide back illuminated CCD chip (e2v®, 1340×400 pixels), that was thermoelectrically cooled to −75.±0.1◦C in order to reduce dark current. The spectrom-eter was heated to 35±0.1◦C. Both spectrometer/detector systems are fully integrated and controlled by the ATMO-SpecLab data acquisition LabVIEW code. The code also reads up to eight temperatures, and contains four PID loops used to control and stabilize temperature (Volkamer et al., 2009a; Coburn et al., 2010).
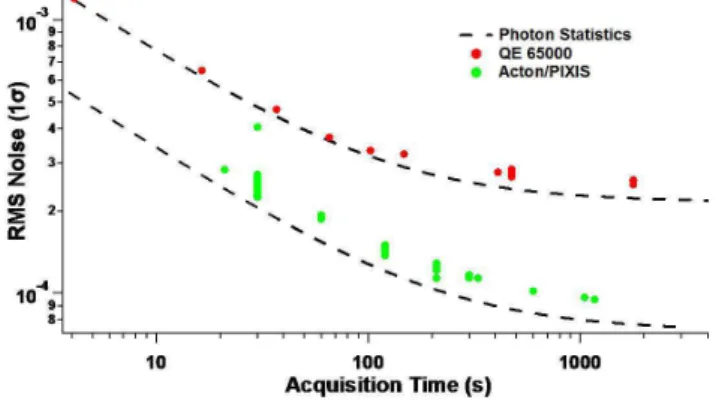
2.1.4 Signal to noise comparison
The signal to noise of the two spectrometer/detector systems was evaluated using the root mean square (RMS) fit residual of the DOAS trace gas fit. The theoretical noise level was calculated using combination of the noise levels of the ref-erence and the sample spectra taken in quadrature where the theoretical noise is:1.
(N being the maximum number of counts in the spectra). The integration time used to record the reference spectrum was two minutes for the QE65000, while the Acton/PIXIS reference was 3.5 min. Consecutive spectra were recorded with an integration time of 30 s and co-added to increase the photon counting statistics. Figure 4 compares the signal to noise ratio of the QE65000 and the Acton/PIXIS spectrom-eters. The Acton/PIXIS achieves a 2–3 times lower RMS noise for comparable integration times reflecting a 4–9 times higher light throughput. The higher light throughput is pri-marily due to the high photon collection efficiency of a larger detector with high quantum efficiency, which is systemat-ically exploited by the custom fiber assembly. The spec-trometer/detector assembly is described in detail in Coburn et al. (2010).
2.2 Aerosol generation and measurement
To characterize the performance of LED-CE-DOAS in the presence of aerosols, mono-disperse aerosols of known size and refractive index were produced using the experimental setup shown in Fig. 2. Polystyrene latex spheres were used as the spherical size-selected aerosol test case. An aque-ous solution of polystyrene latex (PSL) spheres (Thermo Scientific, 350 nm±7 nm) was prepared by suspending ten drops of standard in approximately 200 mL of de-ionized water. The solution was then volatilized using an atom-izer. The airstream was subsequently dried using silica beads, and passed through a Scanning Mobility Particle Sizer (SMPS) which consists of a Differential Mobility Ana-lyzer (DMA) (TSI model 3081) and a Condensation Particle Counter (CPC) (TSI 3022A, in high flow mode) used to size
Fig. 4. RMS Photon noise as a function of acquisition time as
mea-sured by the two spectrometer/detector systems used in this study. The theoretical limit of the noise reduction is shown by the dashed lines.
select and count particles. The SMPS was set to 5 lpm (liters per minute) sheath flow and the sample flow through the DMA was 500 standard cubic centimeters per minute (sccm). The size of the aerosols selected by the DMA is known to a 3% uncertainty (Biskos et al., 2006). Particles were counted by the CPC before and after passing through the cavity, and numbers were found identical to within less than 1% indicat-ing negligible particle losses inside the cavity. The mirrors were kept clean using a dry air purge at the ends of the cavity and the sample (aerosols and/or trace gases) was supplied in the middle of the enclosed cavity volume (Fig. 2).
2.3 Trace gas generation
Iodine monoxide measurements were made in closed-cavity mode. IO was generated via the reaction of ozone with iodine atoms as described by the mechanism outlined in Gomez-Martin et al. (2007). A 20 sccm flow of air was passed first through a flask that contained iodine crystals (Fisher Scientific) cooled in an ice bath and flowed into an-other flask equipped with an atomic Hg line emission lamp and a Xe line emission lamp (UVP). The Hg lamp was switched on briefly to produce ozone in the flask. The Xe lamp was on continuously, and produced iodine atoms by the photolysis of I2, which then reacted with the ozone to make IO. The flow was diluted into a 1000 sccm total flow into the instrument. After exiting the cavity an ozone monitor (Ther-moFisher Scientific, 49i) measured the amount of ozone in the sample flow.
For open cavity measurements the tube enclosing the cav-ity was removed and a curtain flow was maintained on the mirrors, allowing both mirrors to face the open room air. NO2 and water were present in the room air in sufficiently high concentrations that no further supply was needed. Gly-oxal and methyl glyGly-oxal were introduced to the light path by placing a row of Petri dishes containing solutions of glyoxal and methyl glyoxal directly under the light path so that the solutions evaporated into the light path.
3 Results
3.1 LED light source
The LEDengin LED used here is 5 times more powerful than the Luxeon and is more powerful than the calculated out-put of the Xe arc (Fig. 3a). The LED also overcomes the limitation created by the highly unstable Xe emission lines that fall in the middle of the CHOCHO evaluation range (see e.g., Washenfelder et al., 2008). Because the LED emits less light at wavelengths where the mirror reflectivity drops (out of band light) than a Xe-arc lamp less filtering is needed to remove out of band light. Out of band light is orders of magnitude more intense than the sample light because of the drop in mirror reflectivity (more light allowed through the cavity). The reduced need for filtration allows for a wider useable wavelength range (420–490 nm) compared to arc lamp IBBCEAS setups (see Table 1), and helps increase light throughput by reducing optical surfaces.
Another advantage of the light source that has been ex-ploited in our LED-CE-DOAS instrument is that the center wavelength of the LED can be chosen to match the wave-length of maximum mirror-reflectivity. This enables us to use the mirror in order to balance the light intensity across the detector. The effect of the mirror is illustrated in Fig. 3b, and enables us to measure a particularly broad spectral range that is 70 nm wide. This is wider than previous CEAS instru-ments, see Table 1. Our motivation in systematically widen-ing the spectral range is innovative, because in contrast to
previous work it is chosen to include measurement of the O4 absorption band at 477 nm, together with the other gases. The O4 absorption cross section is >10 times stronger at 477 nm than at 446 nm. That strong O4band, and the wa-ter bands at 443 nm provide us with independent means to measure under atmospheric conditions even small variations in the effective extinction length of photons from the cavity at two wavelengths, as part of each individual spectrum. Such variations could be caused by atmospheric turbulence or vari-able aerosol optical depth. By measuring the decrease in the O4and H2O SCDs compared to clean (aerosol free) air, CE-DOAS in principle allows for the differential measurement of aerosol optical depth.
3.2 DOAS retrieval and absorption cross section
weighting
A data analysis routine has been developed using the Win-DOAS spectral fitting program (Fayt and Van Roosendael, 2001). The algorithm uses as input the high-resolution molecular absorption cross-section spectra of glyoxal (296 K) (Volkamer et al., 2005c), methyl glyoxal (296 K) (Meller et al., 1991), O4(Hermans, 2010), H2O (833 mbar, 296 K) (Rothman et al., 2006), NO2(294 K) (Vandaele et al., 2002) and IO (H¨onninger, 1999). These spectra are con-voluted with the slit function of the spectrometer and in-terpolated onto the wavelength dispersion of the spectrom-eter. Two fit ranges were used, one for the trace gases (435– 465 nm) and one for O4 (455–487 nm) each of these used a 4-th order polynomial for the high pass filter. The cross-sections are then fitted to the measured optical density to re-trieve the slant column density (SCD, integrated concentra-tion along a given path length). Other degrees of freedom of the non-linear least-square fitting routine are kept to a mini-mum in our retrieval, i.e., no spectral shift and intensity offset are allowed. The slant columns are converted to concentra-tions using the path length calibration.
DOAS uses Lambert Beer’s Law: ln
I 0 I
= σ (λ) c l(λ) (3)
in a modified form that separates extinction processes as broadband and narrow-band (differential) processes: ln
I 0
I
=
6 σ′i(λ) ci +6 σb,i(λ) ci +εRay (4)
+εMie +T (λ)]l =
6 σ′i(λ) ci +polynominal
l
whereI0 and I are the reference and measurement inten-sities respectively andσ, candl are the absorption cross-section, concentration and absorption path length, respec-tively; σ′i is the differential (narrow band) portion of the
instrument transfer function. A polynomial (or other form of a high pass filter) is used to represent all broadband pro-cesses (σb, both Rayleigh and Mie scattering andT), while the trace gases of interest are identified and quantified by their characteristic differential absorption structure. This ap-plication of Beer’s law assumes that path length is constant within the wavelength interval used for the DOAS fit. How-ever, in CEAS applications the effective path length, Leff, varies strongly with wavelength, as given by Eq. (1), and il-lustrated in Fig. 1. The resulting wavelength dependence of path length creates residual structures if spectra are linearly scaled in the respective fit windows. The effect is illustrated in Fig. 5 for a DOAS retrieval of glyoxal. For weak absorbers in a Rayleigh atmosphere (no aerosols), the cavity enhance-ment factor in BB-CEAS retrievals accounts for the wave-length dependence in path wave-length and converts the optical density into extinction units (Fiedler et al., 2003; Washen-felder et al., 2008). For strong absorbers, the trace gas can further become self-limiting to path length at the center of an absorption band. This effect is discussed at a single wave-length by Platt et al. (2009). In this work all trace gas ab-sorbers are optically thin (differential optical density<4%), and the effect to self-limit path length is negligible. How-ever, as illustrated in Fig. 1, aerosols can strongly modify the wavelength dependence of path length. Spectral distor-tions in DOAS applicadistor-tions are observed for various reasons (Platt et al., 2009). A generalized solution consists in a vari-ation of the interpolvari-ation approach (Volkamer et al., 1998) that interpolates differential absorption between two extreme cases: (1) the Rayleigh case and (2) an upper limit aerosol extinction (hereεMie= 8×10⁻⁷cm−1). We create the effec-tive cross-sections,σeff(λ)as follows:
σeff(λ) = σ (λ) F (λ) (5)
where the weighing factor, F (λ), accounts for the relative variation of the wavelength dependence of path length;F is calculated as follows:
F (λ) = Leff(λ)
Leff(peakλof absorption)
(6) whereLeffis calculated according to Eq. (1), and normaliza-tion is most useful with respect to a wavelength where the path length is well known. At that wavelengthF takes the value of unity (no scaling);F varied from 0.7< F <1.2 for the spectral windows fitted, see Fig. S2 in the Supplement. This notation decouples the relative variation of path length over a fitting window (F) from the absolute value ofLeffat the wavelength of normalization. At any point in timeLeffis well defined at two wavelengths in our system, i.e., at 477 nm from measurements of O4:
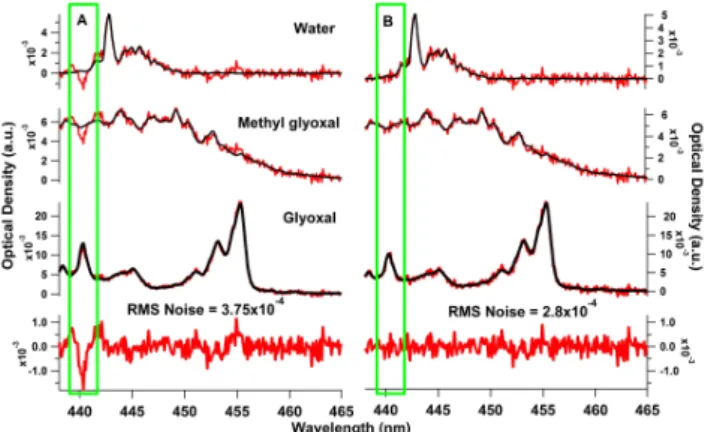
Fig. 5. Effects of wavelength dependent path length on the fit
resid-ual. (A) An unscaled glyoxal cross-section is fitted to the spectra.
(B) Scaled glyoxal cross-section fit (Eqs. 5 and 6, Rayleigh case in
N2). Cross-section scaling is able to reduce the RMS by eliminat-ing systematic residual structures. The experimental conditions are: [glyoxal] = 1.45 ppbv, [methylglyoxal] = 2.05 ppbv, [H2O] = 0.59%.
Leff(477 nm) =
SCDO4,477nm
N2O2 (7a)
= d0
1−R477nm+εRay,477nmd0+εMie,477nmd0+6σicid0
and at 443 nm from measurements of water:
Leff(443 nm) =
SCDH2O,443nm NH2O
(7b)
= d0
1−R443nm+εRay,443nmd0+εMie,443nmd0+6σicid0
high reflectivity mirrors and low photon shot-noise (strong light sources) as pre-requisites; inherent path length calibra-tion thus should be considered as an opcalibra-tion when choosing mirror reflectivity; other factors are discussed by Fiedler et al. (2007); Platt et al. (2009).
3.3 Determination of sample path,ds
As depicted in Fig. 2, the aerosol and trace gas samples do not occupy the entire length of the cavity; the length of the volume (ds) must be determined by a separate set of experi-ments. This is done by flowing a known amount of an ab-sorber through the sample portion of the cavity. In each run of the experiment before aerosols were introduced, hu-midified air was flowed through the cavity and the water va-por concentration was measured by the combination of rela-tive humidity sensor, RTD and the pressure sensor. The ra-tiods/d0is then calculated as the ratio of the retrieved light path for the water (H2O SCD divided by concentration cal-culated from the RH) and the theoretical path, Eq. (1), at the wavelength of the water band. The sample path is then calculated by multiplying this ratio byd0. This can also be done using O4 by flowing nitrogen in the purge volumes, and compressed air at known pressure in the cavity. Use of synthetic air requires characterization of the oxygen mix-ing ratio separately. In this experimentd0= 99.±0.1 cm and ds= 83±1 cm.
3.4 Accounting of broadband extinction by Polynomial
order
In DOAS retrievals, fitting a polynomial is one means of numerical high pass filtering of spectra to represent broad-band extinction, see Eq. (4). The wavelength dependence of the mirror reflectivity is a primary factor that imposes a broadband shape to the collected spectra in Rayleigh atmo-spheres. This variation in the number of times thatR im-poses its wavelength dependence is systematically exploited in Washenfelder et al. (2008) for the case of gases with dif-ferent Rayleigh scattering cross sections to calculate mirror reflectivity over a wide wavelength range, Eq. (2). However, the imposition ofRis also relevant to other cases of variable extinction (e.g., aerosols), and needs to be captured accu-rately in DOAS retrievals. When the cavity is sequentially filled with gases of different Rayleigh cross-sections, for ex-ample helium compared to nitrogen, or with air and aerosol compared to nitrogen only, the difference in the number of passes,1n, is significant, and the mirror imposes its wave-length dependence according to a power law, i.e.,R1n. The interpolation approach described in Sect. 3.2 can account for such variable wavelength dependence of extinction. An alter-native means is to account for the variability in wavelength dependence of extinction by a suitable polynomial. A set of sensitivity studies were carried out that compared He and air spectra, and/or the Rayleigh case with an aerosol laden
Fig. 6. Effect of mirror reflectivity and high pass filter on the O4 retrieval. (A) Effective path length and number of traverses in the cavity in helium (black), nitrogen (green), air (blue) and air with aerosol (brown,εMie= 3×10⁻⁷cm−1) calculated from theory us-ing known Rayleigh sections and the aerosol extinction cross-section from Mie theory (Bodhaine et al., 1999; Sneep and Ubachs, 2005). (B) The relative error in the retrieved O4slant column re-trieved compared to the calculated O4slant column as a function of polynomial order of the high pass filter. Open green squares: air spectrum fit against a nitrogen reference with F (Eq. 5) for the Rayleigh case; open black circles: air spectrum, nitrogen ref-erence, Aerosol case scaled cross-section; open red diamonds: air spectrum, nitrogen reference, sum of two cross-section fit; open blue triangles: air spectrum, He reference, Rayleigh case cross-section; closed green squares: Aerosol spectrum, nitrogen refer-ence, Rayleigh case cross-section; closed black circles: aerosol spectrum, nitrogen reference, Aerosol case cross-section; closed red diamonds: aerosol spectrum, nitrogen reference, sum of two cross-section fit.
Table 3. Detection Limits (2σ) for species in an aerosol free and an urban environment (εMie= 5×10⁻⁶cm−1at 450 nm).
Species Detected in 1 min Aerosol Free Urban Environment (L= 11–14 km) (L= 1.8 km)
CHOCHO 19 pptv 190 pptv
CH3COCHO 170 pptv 1.5 ppbv
NO2 30 pptv 290 pptv
IO 0.7 pptv 4.4 pptv
Water 280 ppm 0.3%
O4 0.1%∗ 0.8%
∗Calculated as the equivalent error of the O
2volume mixing ratio of air at STP.
wavelength dependence of extinction into the polynomial or-der thus presents a viable option; this approach reduces the number of effective cross sections to be fitted simultaneously as the sum of the extreme cases performs with similar ac-curacy to either of the two other cases. Notably, a key ad-vantage of the DOAS optimized retrieval is that the resid-ual RMS alerts of an incorrectly captured wavelength depen-dence of extinction and/or self-limitation in path length, as both effects can cause residual RMS that contain system-atic structures (see Fig. 5a). In absence of such “alerting” structures (i.e., purely statistical RMS), a single set of pre-calculated effective cross sections (one per gas) is sufficient also if the overall cavity extinction, and its wavelength de-pendence are variable.
3.5 Methyl glyoxal measurement
In addition to glyoxal and NO2, methyl glyoxal was detected with the LED-CE-DOAS instrument. The spectral proof is shown for an example retrieval in Fig. 5. The detection sensi-tivity of methyl glyoxal is approximately ten times less than that of glyoxal due to the smaller absorption cross-section. This lower sensitivity combined with the lower concentra-tions of methyl glyoxal make an atmospheric detection un-likely with our instrument. However, the sensitivity is high enough to be useful for the detection of methyl glyoxal in at-mospheric simulation chambers where methyl glyoxal con-centrations are higher. Detection limits for glyoxal, methyl glyoxal, IO, NO2, water and O4were calculated conserva-tively by taking two times the RMS noise of the fit residual and dividing by the peak differential cross-section and the path length; in Table 3 typical values for the detection limit are given for the free troposphere (aerosol free) and an urban environment (aerosol extinction = 5×10⁻⁶cm−1).
3.6 IO and I2measurement
IO was measured by the instrument in the presence of I2 and ozone. Both the ozone absorption in the Huggins band, and the molecular iodine absorption provide broad-band extinctions in the cavity. Because the measured ozone
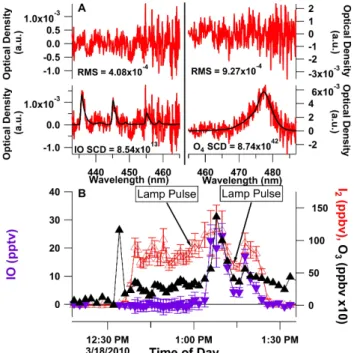
Fig. 7. (A) Example spectrum for the IO detection (4.4 pptv IO,
62 ppbv I2) (left panel) with the corresponding O4fit (right panel).
(B) Time trace showing the variations in IO, O3and I2, as inferred from the reduction in O4path length. The detection limits for IO (dashed line) and I2 (dotted line) increase towards longer wave-lengths because of extinction losses due to I2.
3.7 Aerosol extinction measurements
For measurements in the ambient atmosphere, aerosols are likely the largest contributor to extinction and thus reduce the path length in the cavity (see Fig. 1). Aerosol extinction can be inferred from the change in the measured path in the presence of aerosols, compared to the path in the empty cav-ity (determined by separate measurements ofR, Sect. 2.1.2, and knowledge of the Rayleigh scattering cross section of air, and air pressure). The aerosol extinction was calculated us-ing a modified version of Eq. (1), with the substitution ofds (the sample length) ford0(the cavity length) for aerosols and trace gases:
εaer(λ) =
d0 Laer(λ)
−1 +R(λ)−εRay(λ) d0 ds
(8) This can be simplified if the sample path for the aerosols and the reference absorber are the same:
εaer(λ) = d0 ds
1
Laer(λ)
− 1
L0(λ)
(9)
= d0
ds O22vmr
1 SCDO4
,aer Nd2,aer
− 1 SCDO4,Ray
Nd2,Ray
whereLaeris the path in the presence of aerosols andL0is the path for the Rayleigh case in a clean cavity filled with air (see Eq. 1),d0andds are defined in Sect. 3.3,Ndis the density of air (Nd= 2.09×10¹⁹molecules cm−3at a pressure of 830 mbar and a temperature of 298 K) in the aerosol (and reference) case, O2,vmris the oxygen volume mixing ratio of air (0.2095), the SCDO4,Rayis the column density of the oxy-gen dimer in air, andεRay is the extinction due to Rayleigh scattering. The SCDO4,aer is measured and the SCDO4,Ray is calculated. (Please make sure that the O4 and and Ray are in the subscript as the appear in Eq. 9). Two different ap-proaches were used to retrieve the aerosol extinction. The first approach used the change in the retrieved SCD of O4 at 477 nm combined with the independent measurement of pressure and temperature and the knowledge of the oxygen mixing as given in Eq. (9). The second used a modified ver-sion of Eq. (9), using the SCD of water measured at 443 nm in a similar fashion to O4, and relative humidity, pressure and temperature were measured separately to calculate the num-ber density of water molecules in cm3of air. The detection limit for aerosol extinction is 1.6×10⁻⁸cm−1at 477 nm and 1×10⁻⁷cm−1at 443 nm.
3.8 Comparison to Mie theory
The aerosol extinctions as retrieved from the reduction of the path length in the cavity were compared to Mie theory. The wavelength dependence of the refractive index of the mono-disperse PSLs was calculated based on the Cauchy
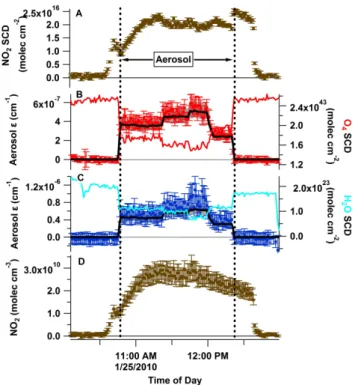
Fig. 8. Simultaneous retrieval of NO2 and aerosol extinction at two wavelengths in closed cavity mode. (A) Retrieved NO2slant column density. (B) O4 SCD (Red Line) and aerosol extinction retrieved from O4 absorption at 477 nm (red dots) compared to Mie theory (black line, gray area represents uncertainty in size of 350 nm PSLs); (C) H2O SCD and aerosol extinction retrieved from water absorption at 442.8 nm (blue dots) compared to theory (black line); (D) NO2concentration corrected for the change in path length measured using O4.
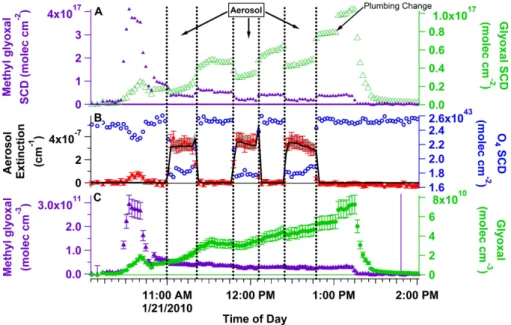
Fig. 9. Simultaneous retrieval of glyoxal, methyl glyoxal and aerosol extinction at one wavelength in closed cavity mode. (A) Slant
column densities (SCD) of glyoxal (green open triangles) and methyl glyoxal (purple triangles). (B) O4SCD (blue circles), retrieved aerosol extinction from the change in the O4SCD (red squares) and the calculated aerosol extinction from Mie theory (solid line, gray area represents the uncertainty in aerosol sizing; peaks at the end of the first two aerosol periods are due to artifacts in the CPC counting). (C) Retrieved concentrations of glyoxal (green dots) and methyl glyoxal (purple triangles) corrected for path length by the retrieved aerosol extinction.
extinction for the NO2experiment. The dynamic range over which aerosol extinction was varied is limited by the atom-izer output, and needs to be regarded in relation to the aerosol free cavity loss. Indeed the lower value of aerosol extinction exceeds the extinction due to Rayleigh scattering in our cav-ity. The upper end value of aerosol extinction is the dominat-ing extinction over the combined Rayleigh and mirror loss. Our experiments vary the overall extinction loss by a signifi-cant factor of 2.2, as illustrated in Fig. S1 in the Supplement. For the glyoxal and methyl glyoxal experiment the known wavelength dependence of the aerosol extinction was used with the mirror reflectivity to retrieve the path length for the glyoxal and methyl glyoxal. The retrievedλ−n dependence (λ−3.8±2.1) of the extinction matches well with the depen-dence calculated from Mie theory (λ−3). The variability is still largely due to the measurement of the aerosol extinc-tion at the water wavelength that is currently limited by the accuracy in the RH measurement. Alternative means to in-fer the wavelength dependence of aerosol extinction are pro-vided by measuring a gas which absorbs over a broad wave-length range, e.g., NO2, at 477 nm (the O4wavelength), and use the known wavelength dependence of that gas to de-rive the wavelength dependence of aerosol extinction. While NO2can not always be relied on to be present in detectable amounts, oxygen and water are among the most abundant molecules in the lower atmosphere, and provide sufficient means to calibrate the wavelength dependence of aerosol ex-tinction, and thus deriveLeffas a function of wavelength.
3.9 Open cavity detection of NO2, glyoxal and methyl glyoxal
Fig. 10. Example retrievals using LED-CE-DOAS in open
cav-ity mode: glyoxal (274±14 pptv), NO2(2.47±0.07 ppbv), methyl glyoxal (1.2±0.2 ppbv), water and O4.
4 Discussion
4.1 Normalization of blue CEAS instrument
sensitivities
Table 4 compares the instruments listed in Table 1 in terms of their sensitivities for a common integration time of 1 min. Normalization is needed to account for different units, and also to compare the “detection sensitivity” of different in-struments at a common confidence level. Values of RMS residuum noise in units of cm−1(typical of most previous CEAS literature) were converted into the equivalent RMS noise (arbitrary units) by multiplying withLeff, RMS equiva-lent noise in arbitrary units of “optical density” is listed at the 2-σ confidence level. The normalized “detection sensitivity” (units of molec cm−3) was then calculated by dividing this 2-σ RMS noise by the product ofσ (absolute retrievals;σ′
for relative retrievals; units of cm2molec−1) andLeff(units of cm), see footnotes to Table 4 for values used for individual gases. Notably, this measure of instrument noise differs from that of the “fit error” that is often treated as equivalent to “de-tection sensitivity” in the BB-CEAS literature. For example, the 1-σRMS residual noise of 3.75×10⁻⁹cm−1reported by Ball and Jones (2009) corresponds to a 1-sigma fit error of 59 ppt NO2; this same NO2concentration corresponds to an optical density of 4.6×10⁻⁴, or ca. 0.3-σ on the RMS noise scale (compare Table 4). Likewise, glyoxal concentrations observed in Fig. 8 of Washenfelder et al. (2008) are negative to 5-σ “fit error”; negative concentrations are non-physical, and are taken here to be marginally equivalent to “zero”, which agrees well with the 2-σRMS noise equivalent detec-tion sensitivity in Table 4. Our scaling is generally consistent with Stutz and Platt (1996), who found that the true error can be underestimated by up to a factor of 6 if equated to the standard least-squares fit error. Notably, Table 4 normalizes
“detection sensitivity” to a common and conservative confi-dence level for the simple means of comparison between in-struments; a similar calculation could equally be performed at another confidence level. Our choice of “normalized de-tection sensitivity” allows for reasonable “white noise” resid-uals to verify “by eye” the spectral proof of detection.
4.2 LED and inherent path length calibration
Ball et al. (2004) pioneered the use of LEDs with CEAS ap-plications (see Sect. 1). At blue wavelengths, the 3 W Luxeon Royal blue used to be the strongest available LED; it had ap-proximately half the intensity of a 450 W Xe-arc lamp (Kern et al., 2006). The optical output measured in Sect. 2.1.2 from the 5 W LEDengin LED, see Table 1, is about three times higher peak spectral intensity compared to that calculated for a 450 W Xe-arc lamp (ε= 0.15), and about 5–6 times higher than the 3 W Luxeon LEDs, see Fig. 3a.
Notably, the inherent path length calibration requires high
R mirrors and low photon shot-noise (strong light sources). The high R mirrors reject valuable photons in a situation where the instrument noise is photon shot noise limited. The high intensity LEDengin makes up for some of these losses, and enables us to widen the wavelength window by avoiding the use of filters to suppress out of band light (detection of O4 at 477 nm). The particular challenge with realizing inherent path length calibration at blue wavelengths is illustrated in Table 4, and consists in the need for accurate measurements of O4and or water at ambient O2partial pressures. Table 4 compares the normalized O4detection sensitivity of differ-ent instrumdiffer-ents (expressed as equivaldiffer-ent O2partial pressure). Previous instruments detect O4only in an oxygen enriched atmosphere, and leverage that O4abundance scales with the square of the O2partial pressure (collision induced absorp-tion of two O2 molecules). Our O4 signal-to-noise ratio is ∼110 times higher than Wu et al. (2009) (using the same O4band) and∼150 times that in Langdridge et al. (2006). Our detection sensitivity is sufficient to detect a 1% change in the O4SCD under STP conditions in air, or 0.1% change in the ambient O2partial pressure, see Table 3. The com-bination of three factors enables this accuracy: (1) highR
Table 4. Normalization and comparison of detection limits for trace gases measured with blue CEAS instruments.
Trace Gas Leff 1-σRMS 2-σRMS Normalized 2-σ Reference (kma) (reported units) (×10−3a.u.) Detection Limit
(pptv)bin 1 min
NO2 4.5 2.9×10⁻⁹cm−1 2.6 325 Langridge et al. (2006) 17.9 20 pptvc ∼4d 100d Washenfelder et al. (2008) 4.5 3.75×10⁻⁹cm−1 3.3 420 Ball and Jones (2009) 0.3 1.72×10⁻⁸cm−1 1.0 3400b Wu et al. (2009) 13 2×10⁻⁴ 0.4 30 This work
CHOCHO 17.9 29 pptvc ∼4d 150d Washenfelder et al. (2008) 13 2×10⁻⁴ 0.4 19 This work
CH3COCHO 13 2×10⁻⁴ 0.4 170 This work
IO 0.68 7.9×10⁻⁸cm−1 10.7 315 Vaughan et al. (2008) 3.2 1.3×10⁻⁷cm−1 83 520 Vaughan et al. (2008) 11 2×10⁻⁴ 0.4 0.7 This work
H2O 15 0.84 ppthvc ∼4d 0.3%d Washenfelder et al. (2008) 13 2×10⁻⁴ 0.4 0.028% This work
O4 4.5 2.9×10⁻⁹cm−1 2.6 43%e Langridge et al. (2006) 0.3 1.72×10⁻⁸cm−1 1.0 35%e Wu et al. (2009) 14 3.5×10⁻⁴ 0.7 3.5%e This work
aCalculated from Eq. (1) for Rayleigh case in air, density of 2.5×10¹⁹molec cm−3.
bNormalized to reflect the 2-σRMS confidence level in “optical density” equivalent units; calculated by dividing 2-σ RMS residual noise (column to the left) byL eff, and
the cross section; for NO2the absolute cross-section is used for BB-CEAS retrievals (σNO2= 7×10⁻¹⁹cm2molec−1), andσ′NO2= 4×10⁻¹⁹cm2molec−1is used for DOAS
retrievals (and 4×10⁻¹⁹cm2molec−1 for 480 nm for Wu et al., 2009), this gives a favorable estimate for BB-CEAS (see Sect. 4.1); other gases are converted based on the
following values: σ′IO= 2×10⁻¹⁷cm2molec−1,σO4 (477 nm) = 6.5×10−46cm5molec−2,σO4 (446 nm) = 5×10−47cm5molec−2,σCHOCHO= 6.5×10⁻¹⁹cm2molec−1,
σH2O= 4.3×10⁻²⁶cm2molec−1.
cReported 1σfit error interpreted as equivalent to measurement precision (see Sect. 4.1), ppthv = permille volume mixing ratio.
dNo statistical residuals are reported in this paper; the detection limits are estimated from the distribution around zero in Fig. 8 of Washenfelder et al. (2008), see text for details.
eCalculated as equivalent O
2partial pressure in air at STP.
4.3 Benefits of DOAS retrievals
DOAS retrievals are inherently insensitive to lamp drift. Once the retrieval method is established, such relative re-trievals provide a software solution to the problem of lamp drift. Since CE-DOAS only relies on a relative intensity distribution of the lamp spectrum, the frequency at which the lamp needs to be characterized is greatly reduced. For example, we can run our instrument over several days with a single lamp spectrum, without the need to reduce the duty cycle to characterize the lamp intensity and/or cavity trans-mission. The strong LED, coupled with the reduced need for calibrations makes time and photons available to reduce photon shot noise, improve the signal-to-noise ratio, and achieve lower detection limits without sacrificing the ability to demonstrate “control” over cavity transmission. While the measurement of O4and water are not proprietary of relative retrievals, the ability to detect these gases relies exclusively on the concept of “differential” absorption for which DOAS retrievals are optimized.
lamps; instruments that employ LEDs tend to give better RMS. The study of Wu et al. (2009) employed very lowR
mirrors (two orders of magnitude lower than this work) and despite abundant light their noise level is about 2.5 times the RMS derived in this work; the stability of their LED did not allow for RMS to improve beyond∼50 to 100 s averaging time. State-of-the-art CEAS applications currently dedicate separate hardware to measuring fluctuations inI0by observ-ing “sobserv-ingle-traverse” out-of-band light (Washenfelder et al., 2008; Chen and Venables, 2010). The need to characterize and correct for drift inI0adds to the hardware cost, increases shot-noise in the measurement of interest by using a portion of the available photons to characterizeI0, and adds an un-certainty that can limit the minimal extinction which can be quantified; the uncertainty of the separateI0 measurement needs to be propagated into the final error of absolute re-trievals. DOAS retrievals eliminate such hardware needs and potential for error.
DOAS retrievals do not have any particular benefit over absolute retrievals to separate further between broad band ex-tinction from aerosols, changes inR or cavity alignment, or atmospheric turbulence; in either retrieval the decoupling of aerosol extinction relies on engineering solutions of the cav-ity and air supply. Notably, in an unknown mixture of gases any retrieval techniques relies exclusively on differential ab-sorption features to distinguish between the individual gases that contribute to the total extinction from the cavity. CEAS “selectivity”, or the ability to give spectral proof for unam-biguous detection of a specific gas, relies on comparing the differential “signal” (relative retrievals: arbitrary units typi-cal of “optitypi-cal density”; absolute retrievals: units of cm−1) in relation to the RMS noise; the broad band extinction from
σb(Eq. 4) is convoluted with aerosol extinction, changes in R or cavity alignment, and/or atmospheric turbulence, and – in the case of BB-CEAS retrievals also drift inI0. Con-versely the benefit ofσbtowards the “sensitivity”, or ability to quantify the concentration, becomes ill defined. For gases like glyoxal and IO, whereσandσ′are near identical, there is no benefit in absolute retrievals.
Finally, the fit residual carries valuable information to “alert” of the potential for systematic bias (Stutz and Platt, 2008): limitations in hardware, and/or the incomplete ac-counting of absorbers can create systematic residual structure and impose a cap on the attainable detection limit due to spectral cross-correlations with overlapping features be-tween the residual and other absorbers. Notably, DOAS retrievals maintain “units” that facilitate a straightforward comparison with theoretical RMS noise (i.e., photon-shot-noise, see Fig. 4, Sect. 2.1.4). The attainable RMS of other DOAS applications continues to decrease as our under-standing of hardware limitations that cause deviations from photon-shot noise statistics at very low noise levels contin-ues to improve (Coburn et al., 2010; Volkamer et al., 2009a): 1-σ RMS ∼6×10⁻⁶ has been realized in laboratory ap-plications, and ∼1×10⁻⁴ can now routinely be achieved
(see Fig. 4, and also Table 1 in Coburn et al., 2010). Such DOAS hardware is transferrable to LED-CE-DOAS applica-tions. Future improvements in RMS will also depend on the availability of improved laboratory cross-section data.
5 Conclusions
We demonstrate inherently calibrated CEAS measurements at blue wavelengths, and measured glyoxal, methyl glyoxal, NO2, water and aerosol extinction at 443 nm and 477 nm in open cavity mode. The open cavity mode eliminates the need for sampling lines, and is particularly useful for measure-ments of reactive gases and iodine oxide radicals that can get lost in sampling lines.
– A strong LED coupled with highRmirrors and DOAS
retrievals enables low detections limits, while maintain-ing the ability to demonstrate on-line “control” over cavity transmission. The method is based on excellent signal to noise measurements of O4at atmospheric con-ditions as part of each spectrum. The path length cal-culation only requires a pressure reading as input. Sim-ilarly, measurements of the H2O in combination with relative humidity and temperature are used.
– To our knowledge ours is the first retrieval of aerosol
extinction by a CEAS instrument that has been veri-fied quantitatively using Mie theory. Two methods are presented to characterize the wavelength dependence of aerosol extinction as pre-requisite for path length calcu-lations in open cavity mode.
– Such control over cavity transmission enables the use
of CEAS cavities as direct alternative to traditional multi-reflection cells, for which the number of reflec-tions is geometrically defined, and constant. The maxi-mum number of passes in our cavity (∼1.7×10⁴) com-pares favorably to White-cells (16 to 144), Herriott-cells (∼100), and astigmatic-type multi-reflection cells (up to 182). The increased photon path length leads to an accordingly better sensitivity.
– DOAS retrievals provide a software solution to the
prob-lem of lamp drift, and lowers the attainable RMS noise from CEAS measurements. The sensitivity of our LED-CE-DOAS is suitable for atmospheric measurements of glyoxal, iodine oxide, nitrogen dioxide and aerosol ex-tinction in polluted and pristine air, and sufficient to detect methyl glyoxal directly under simulated atmo-spheric conditions.
Supplementary material related to this article is available online at:
Acknowledgements. This work was supported by the National Sci-ence Foundation CAREER award ATM-847793, CU start-up funds and NASA Earth and Space Science Fellowship 09-EARTH09F-88. The authors like to thank Jose Luis Jimenez, Steve Brown, Re-becca Washenfelder, and Christa Hasenkopf for use of calibration equipment, and helpful discussions, Barbara Dix and Eleanor Waxman provided guidance on the WinDOAS software package, and comments on the manuscript.
Edited by: J. Stutz
References
Ball, S. M. and Jones, R. L.: Broadband Cavity Ring-down, in: Cavity Ring-Down Spectroscopy: Techniques and Applications, edited by: Berden, G. and Englen, R., John Wiley and Sons LTD, Chichester, 89–111, 2009.
Ball, S. M., Langridge, J. M., and Jones, R. L.: Broadband cavity enhanced absorption spectroscopy using light emitting diodes, Chem. Phys. Lett., 398, 68–74, 2004.
Ball, S. M., Hollingsworth, A. M., Humbles, J., Leblanc, C., Potin, P., and McFiggans, G.: Spectroscopic studies of molecular iodine emitted into the gas phase by seaweed, Atmos. Chem. Phys., 10, 6237–6254, doi:10.5194/acp-10-6237-2010, 2010.
Betterton, E. A. and Hoffmann, M. R.: Henry’s law constants of some environmentally important aldehydes, Environ. Sci. Tech-nol., 22, 1415–1418, 1988.
Biskos, G., Paulsen, D., Russell, L. M., Buseck, P. R., and Martin, S. T.: Prompt deliquescence and efflorescence of aerosol nanopar-ticles, Atmos. Chem. Phys., 6, 4633–4642, doi:10.5194/acp-6-4633-2006, 2006.
Bloss, C., Wagner, V., Bonzanini, A., Jenkin, M. E., Wirtz, K., Martin-Reviejo, M., and Pilling, M. J.: Evaluation of detailed aromatic mechanisms (MCMv3 and MCMv3.1) against envi-ronmental chamber data, Atmos. Chem. Phys., 5, 623–639, doi:10.5194/acp-5-623-2005, 2005.
Bodhaine, B. A., Wood, N. B., Dutton, E. G., and Slusser, J. R.: On Rayleigh Optical Depth Calculations, J. Atmos. Ocean. Tech., 16, 1854–1861, 1999.
Brown, S. S.: Absorption spectroscopy in high-finesse cavities for atmospheric studies, Chem. Rev., 103, 5219–5238, 2003. Chen, J. and Venables, D. S.: A broadband optical cavity
trometer for measuring weak near-ultraviolet absorption spec-tra of gases, Atmos. Meas. Tech. Discuss., 3, 4571–4602, doi:10.5194/amtd-3-4571-2010, 2010.
Coburn, S., Dix, B., Sinreich, R., and Volkamer, R.: Develop-ment and Characterization of the CU Ground MAX-DOAS In-strument: lowering RMS noise and first measurements of BrO, IO, and CHOCHO near Pensacola, FL, Atmos. Meas. Tech. Dis-cuss., submitted, 2010.
Dibble, T. S.: Intramolecular Hydrogen Bonding and Double H-Atom Transfer in Peroxy and Alkoxy Radicals from Isoprene, J. Phys. Chem. A, 108, 2199–2207, 2004a.
Dibble, T. S.: Prompt Chemistry of Alkenoxy Radical Products of the Double H-Atom Transfer of Alkoxy Radicals from Isoprene, J. Phys. Chem. A, 108, 2208–2215, 2004b.
Dixneuf, S., Ruth, A. A., Vaughan, S., Varma, R. M., and Or-phal, J.: The time dependence of molecular iodine emission from Laminaria digitata, Atmos. Chem. Phys., 9, 823–829, doi:10.5194/acp-9-823-2009, 2009.
Ervens, B. and Volkamer, R.: Glyoxal processing by aerosol multi-phase chemistry: towards a kinetic modeling framework of sec-ondary organic aerosol formation in aqueous particles, Atmos. Chem. Phys., 10, 8219–8244, doi:10.5194/acp-10-8219-2010, 2010.
Fayt, C. and Van Roosendael, M.: WinDOAS User Manual, 2001. Fiedler, S. E., Hese, A., and Ruth, A. A.: Incoherent broad-band
cavity-enhanced absorption spectroscopy, Chem. Phys. Lett., 371, 284–294, 2003.
Fiedler, S. E., Hese, A., and Heitmann, U.: Influence of the cav-ity parameters on the output intenscav-ity in incoherent broadband cavity-enhanced absorption spectroscopy, Rev. Sci. Instrum., 78, 073104, doi:10.1063/1.2752608, 2007.
Fu, T. M., Jacob, D. J., Wittrock, F., Burrows, J. P., Vrekous-sis, M., and Henze, D. K.: Global budgets of atmospheric glyoxal and methylglyoxal, and implications for formation of secondary organic aerosols, J. Geophys. Res., 113, D15303, doi:10.1029/2007JD009505, 2008.
Galloway, M. M., Chhabra, P. S., Chan, A. W. H., Surratt, J. D., Flagan, R. C., Seinfeld, J. H., and Keutsch, F. N.: Glyoxal up-take on ammonium sulphate seed aerosol: reaction products and reversibility of uptake under dark and irradiated conditions, At-mos. Chem. Phys., 9, 3331–3345, doi:10.5194/acp-9-3331-2009, 2009.
Gherman, T., Venables, D. S., Vaughan, S., Orphal, J., and Ruth, A. A.: Incoherent broadband cavity-enhanced absorption spec-troscopy in the near-ultraviolet: Application to HONO and NO2, Environ. Sci. Technol., 42, 890–895, 2008.
Gomez Martin, J. C. G., Spietz, P., and Burrows, J. P.: Kinetic and mechanistic studies of the I-2/O-3 photochemistry, J. Phys. Chem. A, 111, 306–320, 2007.
Hastings, W. P., Koehler, C. A., Bailey, E. L., and De Haan, D. O.: Secondary organic aerosol formation by glyoxal hydration and oligomer formation: Humidity effects and equilibrium shifts during analysis, Environ. Sci. Technol., 39, 8728–8735, 2005. Hermans, C.: Measurement of absorption cross sections and
spectroscopic molecular parameters: O2 and its collisonal induced absorption: http://www.aeronomie.be/spectrolab/o2. htm4-9-20104-26-3010 last access: 16 December, 2010. Herriott, D. R. and Schulte, H. J.: Folded Optical Delay Lines,
Appl. Optics, 4, 883–889, 1965.
H¨onninger, G.: Referenzspektren reaktiver Halogenverbindungen f¨ur DOAS-Messungen, 1999.
Huisman, A. J., Hottle, J. R., Coens, K. L., DiGangi, J. P., Gal-loway, M. M., Kammrath, A., and Keutsch, F. N.: Laser-Induced Phosphorescence for the in Situ Detection of Glyoxal at Part per Trillion Mixing Ratios, Anal. Chem., 80, 5884–5891, 2008. Ip, H. S. S., Huang, X. H. H., and Yu, J. Z.: Effective Henry’s law
constants of glyoxal, glyoxylic acid, and glycolic acid, Geophys. Res. Lett., 36, L01802, doi:10.1029/2008GL036212, 2009. Jang, M., Czoschke, N. M., Lee, S., and Kamens, R. M.:
Kern, C., Trick, S., Rippel, B., and Platt, U.: Applicability of light-emitting diodes as light sources for active differential optical ab-sorption spectroscopy measurements, Appl. Optics, 45, 2077– 2088, 2006.
Kurosu, T., Chance, K., and Volkamer, R.: Global measurements of OClO, BrO, HCHO, and CHO-CHO from the Ozone Monitor-ing Instruments on EOS Aura, EOS Trans. EGU, 86, Fall Meet. Suppl. Abstract A54B-01, 2005.
Langridge, J. M., Ball, S. M., and Jones, R. L.: A compact broad-band cavity enhanced absorption spectrometer for detection of atmospheric NO2using light emitting diodes, Analyst, 131, 916– 922, 2006.
Langridge, J. M., Ball, S. M., Shillings, A. J. L., and Jones, R. L.: A broadband absorption spectrometer using light emitting diodes for ultrasensitive, in situ trace gas detection, Rev. Sci. Instrum., 79, 123110, doi:10.1063/1.3046282, 2008a.
Langridge, J. M., Laurila, T., Watt, R. S., Jones, R. L., Kamin-ski, C. F., and Hult, J.: Cavity enhanced absorption spectroscopy of multiple trace gas species using a supercontinuum radiation source, Opt. Express, 16, 10178–10188, 2008b.
Liggio, J., Li, S. M., and McLaren, R.: Reactive uptake of gly-oxal by particulate matter, J. Geophys. Res., 110, D10304, doi:10.1029/2004JD005113, 2005.
McManus, J. B., Kebabian, P. L., and Zahniser, M. S.: Astig-matic mirror multipass absorption cells for long-path-length spectroscopy, Appl. Optics, 34, 3336–3348, 1995.
Meinen, J., Thieser, J., Platt, U., and Leisner, T.: Technical Note: Using a high finesse optical resonator to provide a long light path for differential optical absorption spectroscopy: CE-DOAS, Atmos. Chem. Phys., 10, 3901–3914, doi:10.5194/acp-10-3901-2010, 2010.
Meller, R., Raber, W., Crowley, J. N., Jenkin, M. E., and Moortgat, G. K.: The UV-visible absorption spectrum of methylglyoxal, J. Photoch. Photobio. A, 62, 163–171, 1991.
Miles, R. E. H., Rudic, S., Orr-Ewing, A. J., and Reid, J. P.: Mea-surements of the wavelength dependent extinction of aerosols by cavity ring down spectroscopy, Phys. Chem. Chem. Phys., 12, 3914–3920, 2010.
Myriokefalitakis, S., Vrekoussis, M., Tsigaridis, K., Wittrock, F., Richter, A., Br¨uhl, C., Volkamer, R., Burrows, J. P., and Kanaki-dou, M.: The influence of natural and anthropogenic secondary sources on the glyoxal global distribution, Atmos. Chem. Phys., 8, 4965–4981, doi:10.5194/acp-8-4965-2008, 2008.
O’Keefe, A.: Integrated cavity output analysis of weak absorbers, Chem. Pys. Lett., 293, 331–336, 1998.
O’Keefe, A. and Deacon, D. A. G.: Cavity Ring-Down Optical Spectrometer for Absorption-Measurements Using Pulsed Laser Sources, Rev. Sci. Instrum., 59, 2544–2551, 1988.
Orphal, J. and Ruth, A. A.: High-resolution Fourier-transform cavity-enhanced absorption spectroscopy in the near-infrared us-ing an incoherent broad-band light source, Opt. Express, 16, 19232–19243, 2008.
Platt, U. and Stutz, J.: Differential optical absorption spectroscopy: principles and applications, 1, Springer Verlag, Berlin, 2008. Platt, U., Meinen, J., P¨ohler, D., and Leisner, T.: Broadband
Cav-ity Enhanced Differential Optical Absorption Spectroscopy (CE-DOAS) - applicability and corrections, Atmos. Meas. Tech., 2, 713–723, doi:10.5194/amt-2-713-2009, 2009.
Pope, C. A. and Dockery, D. W.: Health effects of fine particulate air pollution: Lines that connect, J. Air Waste Manage., 56, 709– 742, 2006.
Rothman, L. S., Gordon, I. E., Barbe, A., Benner, D. C., Bernath, P. F., Birk, M., Boudon, V., Brown, L. R., Campargue, A., Champion, J. P., Chance, K., Coudert, L. H., Dana, V., Devi, V. M., Fally, S., Flaud, J. M., Gamache, R. R., Goldman, A., Jacquemart, D., Kleiner, I., Lacome, N., Lafferty, W. J., Mandin, J. Y., Massie, S. T., Mikhailenko, S. N., Miller, C. E., Moazzen-Ahmadi, N., Naumenko, O. V., Nikitin, A. V., Or-phal, J., Perevalov, V. I., Perrin, A., Predoi-Cross, A., Rinsland, C. P., Rotger, M., Simeckov, M., Smith, M. A. H., Sung, K., Tashkun, S. A., Tennyson, J., Toth, R. A., Vandaele, A. C., and Vander Auwera, J.: The HITRAN 2008 molecular spectroscopic database, J. Quant. Spectrosc. Ra., 110, 533–572, 2006. Schuster, G., Labazan, I., and Crowley, J. N.: A cavity ring
down/cavity enhanced absorption device for measurement of ambient NO3 and N2O5, Atmos. Meas. Tech., 2, 1–13, doi:10.5194/amt-2-1-2009, 2009.
Sihler, H., Kern, C., Pohler, D., and Platt, U.: Applying light-emitting diodes with narrowband emission features in differential spectroscopy, Opt. Lett., 34, 3716–3718, 2009.
Sinreich, R., Volkamer, R., Filsinger, F., Frieß, U., Kern, C., Platt, U., Sebasti´an, O., and Wagner, T.: MAX-DOAS detection of gly-oxal during ICARTT 2004, Atmos. Chem. Phys., 7, 1293–1303, doi:10.5194/acp-7-1293-2007, 2007.
Sneep, M. and Ubachs, W.: Direct measurement of the Rayleigh scattering cross section in various gases, J. Quant. Spectrosc. Ra., 92, 293–310, 2005.
Stavrakou, T., M¨uller, J.-F., De Smedt, I., Van Roozendael, M., Kanakidou, M., Vrekoussis, M., Wittrock, F., Richter, A., and Burrows, J. P.: The continental source of glyoxal es-timated by the synergistic use of spaceborne measurements and inverse modelling, Atmos. Chem. Phys., 9, 8431–8446, doi:10.5194/acp-9-8431-2009, 2009.
Stutz, J. and Platt, U.: Numerical analysis and estimation of the sta-tistical error of differential optical absorption spectroscopy mea-surements with least-squares methods, Appl. Optics, 35, 6041– 6053, 1996.
Tan, Y., Perri, M. J., Seitzinger, S. P., and Turpin, B. J.: Effects of Precursor Concentration and Acidic Sulfate in Aqueous Glyoxal OH Radical Oxidation and Implications for Secondary Organic Aerosol, Environ. Sci. Technol., 43, 8105–8112, 2009.
Taraborrelli, D., Lawrence, M. G., Butler, T. M., Sander, R., and Lelieveld, J.: Mainz Isoprene Mechanism 2 (MIM2): an isoprene oxidation mechanism for regional and global atmospheric mod-elling, Atmos. Chem. Phys., 9, 2751–2777, doi:10.5194/acp-9-2751-2009, 2009.
Triki, M., Cermak, P., Mejean, G., and Romanini, D.: Cavity-enhanced absorption spectroscopy with a red LED source for NOxtrace analysis, Appl. Phys. B, 91, 195-201, 2008.
Varma, R. M., Venables, D. S., Ruth, A. A., Heitmann, U., Schlosser, E., and Dixneuf, S.: Long optical cavities for open-path monitoring of atmospheric trace gases and aerosol extinc-tion, Appl. Optics, 48, B159–B171, 2009.
Vaughan, S., Gherman, T., Ruth, A. A., and Orphal, J.: Incoherent broad-band cavity-enhanced absorption spectroscopy of the ma-rine boundary layer species I-2, IO and OIO, Phys. Chem. Chem. Phys., 10, 4471–4477, 2008.
Venables, D. S., Gherman, T., Orphal, J., Wenger, J. C., and Ruth, A. A.: High sensitivity in situ monitoring of NO3in an atmo-spheric simulation chamber using incoherent broadband cavity-enhanced absorption spectroscopy, Environ. Sci. Technol., 40, 6758–6763, 2006.
Villalobos-Pietrini, R., Hernandez-Mena, L., Amador-Munoz, O., Munive-Colin, Z., Bravo-Cabrera, J. L., G´omez-Arroyo, S., Frias-Villegas, A., Waliszewski, S., Ramirez-Pulido, J., and Ortiz-Muniz, R.: Biodirected mutagenic chemical assay of PM10 extractable organic matter in Southwest Mexico City, Mutat. Res./Gen. Toxicol. Environ. Mutag., 634, 192–204, 2007. Volkamer, R., Etzkorn, T., Geyer, A., and Platt, U.: Correction of
the oxygen interference with UV spectroscopic (DOAS) mea-surements of monocyclic aromatic hydrocarbons in the atmo-sphere, Atmos. Environ., 32, 3731–3747, 1998.
Volkamer, R., Barnes, I., Platt, U., Molina, L. T., and Molina, M. J.: Remote Sensing of Glyoxal by Differential Optical Absorp-tion Spectroscopy (DOAS): Advancements in SimulaAbsorp-tion ber and Field Experiments, in: Environmental Simulation Cham-bers: Application to Atmospheric Chemical Processes, edited by: Rudzinki, K. and Barnes, I., NATO Sci. Ser., IV Earth Environ. Sci. vol. 62, Kluwer Acad., Dortrecht, The Netherlands, 129– 142, 2005a.
Volkamer, R., Molina, L. T., Molina, M. J., Shirley, T., and Brune, W. H.: DOAS measurement of glyoxal as an indicator for fast VOC chemistry in urban air, Geophys. Res. Lett., 32, L08806, doi:10.1029/2005GL022616, 2005b.
Volkamer, R., Spietz, P., Burrows, J., and Platt, U.: High-resolution absorption cross-section of glyoxal in the UV-vis and IR spectral ranges, J. Photoch. Photobio. A, 172, 35–46, 2005c.
Volkamer, R., San Martini, F., Molina, L. T., Salcedo, D., Jimenez, J. L., and Molina, M. J.: A missing sink for gas-phase glyoxal in Mexico City: Formation of secondary organic aerosol, Geophys. Res. Lett., 34, L19807, doi:10.1029/2007GL030752, 2007.
Volkamer, R., Coburn, S., Dix, B., and Sinreich, R.: MAX-DOAS observations from ground, ship, and research aircraft: maximiz-ing signal-to-noise to measure “weak” absorbers, SPIE Proceed-ings “Ultraviolet and Visible Ground- and Space-based Measure-ments, Trace Gases, Aerosols and Effects”, San Diego, 2–9 Au-gust 2009, paper 7264-4, doi:10.1117/12.826792, 2009a. Volkamer, R., Ziemann, P. J., and Molina, M. J.: Secondary
Or-ganic Aerosol Formation from Acetylene (C2H2): seed effect on SOA yields due to organic photochemistry in the aerosol aque-ous phase, Atmos. Chem. Phys., 9, 1907–1928, doi:10.5194/acp-9-1907-2009, 2009b.
Volkamer, R., Coburn, S., Dix, B., and Sinreich, R.: The Eastern Pacific Ocean is a source for short lived trace gases: Glyoxal and Iodine Oxide, Clivar Exchanges April 2010, 15(2), No. 52, 30–33, 2010.
Vrekoussis, M., Wittrock, F., Richter, A., and Burrows, J. P.: Tem-poral and spatial variability of glyoxal as observed from space, Atmos. Chem. Phys., 9, 4485–4504, doi:10.5194/acp-9-4485-2009, 2009.
Washenfelder, R. A., Langford, A. O., Fuchs, H., and Brown, S. S.: Measurement of glyoxal using an incoherent broadband cav-ity enhanced absorption spectrometer, Atmos. Chem. Phys., 8, 7779–7793, doi:10.5194/acp-8-7779-2008, 2008.
White, J. U.: Long Optical Paths of Large Aperture, J. Opt. Soc. Am., 32, 285–288, 1942.
Wiedensohler, A.: An approximation of the bipolar charge distribu-tion for particles in the submicron size range, J. Aerosol Sci., 19, 387–389, 1988.
Wittrock, F., Richter, A., Oetjen, H., Burrows, J. P., Kanakidou, M., Myriokefalitakis, S., Volkamer, R., Beirle, S., Platt, U., and Wagner, T.: Simultaneous global observations of glyoxal and formaldehyde from space, Geophys. Res. Lett., 33, 123110, doi:10.1063/1.3046282, 2006.
Wu, T., Zhao, W., Chen, W., Zhang, W., and Gao, X.: Incoherent broadband cavity enhanced absorption spectroscopy for in situ measurements of NO2with a blue light emitting diode, Appl. Phys. B, 94, 85–94, 2009.