Submitted9 November 2015
Accepted 6 March 2016
Published7 April 2016
Corresponding author
Alfredo Vázquez-Ovando, [email protected]
Academic editor
Erica Goss
Additional Information and Declarations can be found on page 14
DOI10.7717/peerj.1855
Copyright
2016 Gutiérrez-López et al.
Distributed under
Creative Commons CC-BY 4.0
OPEN ACCESS
Unique haplotypes of cacao trees as
revealed by
trnH-psbA
chloroplast DNA
Nidia Gutiérrez-López1, Isidro Ovando-Medina1, Miguel Salvador-Figueroa1, Francisco Molina-Freaner2, Carlos H. Avendaño-Arrazate3and
Alfredo Vázquez-Ovando1
1Instituto de Biociencias, Universidad Autónoma de Chiapas, Tapachula, Chiapas, Mexico
2Departamento de Ecología de la Biodiversidad, Instituto de Ecología, Universidad Nacional Autónoma de
México, Hermosillo, Sonora, Mexico
3Campo Experimental Rosario Izapa, Instituto Nacional de Investigaciones Forestales, Agrícolas y Pecuarias,
Tuxtla Chico, Chiapas, Mexico
ABSTRACT
Cacao trees have been cultivated in Mesoamerica for at least 4,000 years. In this study, we analyzed sequence variation in the chloroplast DNAtrnH-psbAintergenic spacer from 28 cacao trees from different farms in the Soconusco region in southern Mexico. Genetic relationships were established by two analysis approaches based on geographic origin (five populations) and genetic origin (based on a previous study). We identified six polymorphic sites, including five insertion/deletion (indels) types and one transversion. The overall nucleotide diversity was low for both approaches (geographic =0.0032 and genetic=0.0038). Conversely, we obtained moderate to high haplotype diversity (0.66 and 0.80) with 10 and 12 haplotypes, respectively. The common haplotype (H1) for both networks included cacao trees from all geographic locations (geographic approach) and four genetic groups (genetic approach). This common haplotype (ancient) derived a set of intermediate haplotypes and singletons interconnected by one or two mutational steps, which suggested directional selection and event purification from the expansion of narrow populations. Cacao trees from Soconusco region were grouped into one cluster without any evidence of subclustering based on AMOVA (FST=0) and SAMOVA (FST=0.04393) results. One population (Mazatán) showed
a high haplotype frequency; thus, this population could be considered an important reservoir of genetic material. The indels located in thetrnH-psbAintergenic spacer of cacao trees could be useful as markers for the development of DNA barcoding.
SubjectsEcology, Evolutionary Studies, Food Science and Technology, Genetics, Plant Science
Keywords Chloroplast DNA, Indels,trnH-psbA, Haplotype, Nucleotide diversity
INTRODUCTION
The Neotropical cacao tree (Theobroma cacaoL.) is widely cultivated in Central and South America, Africa, Indonesia and Malaysia. It is considered an economically important crop because its seeds are used in the chocolate industry (Wood, 2001). Trees can be traditionally classified based on agromorphological traits as Criollo, Forastero and Trinitario (Cheesman, 1944;Toxopeus, 1985). In Mesoamerica, the Criollo cacao has been widely used as food and other purposes as well for nearly 4,000 years (De la Cruz et al., 1995;Whitkus et al., 1998;
Motamayor et al. (2008)proposed 10 cacao genetic groups based on simple sequence repeat (SSR) analysis. Under this genetic classification, only the traditional group of Criollo has been retained as an accepted genetic group. Forastero contains members of the other nine genetic groups from South America (Motamayor et al., 2008) while Trinitarios are believed to be hybrids of various groups (Yang et al., 2013). South America has been reported to contain the highest genetic diversity of cacao trees.
Conversely, the genetic diversity of cacaos in southern Mexico was reported to be moderate to low in natural populations (Whitkus et al., 1998 using RAPD markers) and cultivated forms (Vázquez-Ovando et al., 2014using microsatellite markers), although a wide diversity in cacao pod (fruit smooth, rugose, very rugose; apex blunt, apex point; cylindrical and oblate form; basal constriction slight/absent to very pronounced; colours green, red), and seed (elliptics and oblate forms; colour white, slightly pigment and purple intense) morphologies was observed and reported byAvendaño-Arrazate et al. (2010). In the Soconusco farms (Chiapas, Mexico),Vázquez-Ovando et al. (2014)found moderate to high allelic richness and high levels of homozygosity. The authors reported the presence of trees sharing genetic identity with those considered ‘‘Ancient Criollo’’ but also reported the presence of private alleles. These alleles may be associated with commercially relevant phenotypic traits that preserve their relationship with other polymorphic regions of the DNA.
The chloroplast DNA (cpDNA) and its markers have been increasingly used for studies of genetic population structure, evolution, gene flow, haplotype frequency and phylogenetic relationships. Due to its high conservation due to maternal uniparental inheritance, cpDNA is the main data source used for the construction of phylogenetic relationships in plants (Shaw & Small, 2005). In addition, the cpDNA contains variable DNA regions, which makes them useful for studies of population genetics and conservation issues (Shaw & Small, 2005;Shaw et al., 2007). These regions have been widely used to establish phylogeography patterns in alpine species (Wang et al., 2008), to gain insight into the center of origin of cultivated grape populations in Europe (Arroyo-García et al., 2006) and to explain the diversity and population structure of cultivated Chinese cherries (Chen et al., 2013).
Although cpDNA has not been commonly used in cocoa studies, the technique was employed to analyze population genetic variability and to elucidate the complex origins of cocoa varieties.Yang et al. (2011)developed cpSSRs that were subsequently used together with cpSNP markers (developed byKane et al., 2012) to untangle the genetic origins of the Trinitario cultivar in Trinidad and Tobago (Yang et al., 2013).
The most commonly used cpDNA intergenic spacer istrnH-psbA,which has shown high variability and can be used to elucidate genetic relationships at the intraspecific level (Azuma et al., 2001;Hamilton, Braverman & Soria-Hernanz, 2003). The trnH-psbA
of insertions or deletions (indels), although indels are probably a common feature in the
trnH-psbAspacer (Aldrich et al., 1988).
Nonetheless, the use of indels for diversity and phylogenetic analysis has been questioned (Bieniek, Mizianty & Szklarczyk, 2015;Whitlock, Hale & Groff, 2010) because the mechanism causing indels remains unclear. However, indels are informative characteristics because genetic variability detected using polymorphism due to indels or substitutions can be studied without distinction (Nei, 1987). Therefore, indels are useful markers. Moreover, the inclusion of indels in diversity and phylogenetic analyses enhances the discriminant power between species (Raymúndez et al., 2002;Hamilton, Braverman & Soria-Hernanz, 2003;Kress & Erickson, 2007;Sun et al., 2012) and even between conspecific individuals (Pérez-Jiménez et al., 2013). Therefore, the aim of this study was to evaluate the genetic diversity and describe the relationship between individuals of theTheobroma cacaoL. Criollo type of the Soconusco region (Chiapas, Mexico) using the variations in chloroplast DNA revealed by thetrnH-psbAspacer sequence.
MATERIAL & METHODS
Plant material and sample collection
A total of 45 cacao samples were included in this study. Thirty-eight trees were sequenced for thetrnH-psbAspacer and analyzed, and seven sequence accessions were downloaded from GenBank as references. A total of 28 of the 38 sequenced trees were selected from plantations in Soconusco (Chiapas, Mexico) based on a previous characterization (Vázquez-Ovando et al., 2014) using 10 SSR molecular markers. The individuals were selected based on fruit (pod) and seed traits that resembled those of the Criollo variety. The pods were elongated, deeply grooved and pointed at the apical end and had a lumpy surface with a warty exterior appearance. The seeds had white or slightly pigmented cotyledons that were enveloped in sweet pulp. In agreement with the report byVázquez-Ovando et al. (2014), the individuals were classified as 12 trees with high Criollo ancestry, 11 Non-Criollo group trees and five admixtures (Table 1). Additionally, 10 accessions were sequenced and included as references: two Forastero variety (Catongo and EET 399), one Trinitario variety (RIM 24) and seven wild Criollo (one collected in the Lacandon rainforest (SL01) and six obtained from the germplasm of the Instituto Nacional de Investigaciones Forestales, Agrícolas y Pecuarias, México (Yaxcabá, Xocen, Lacandón 06, Lacandón 28, Lagarto and Carmelo); Table 1).Theobroma bicolor was used as the outgroup. Leaves were collected from trees aged approximately 30 years and placed in plastic bags, taken to the laboratory (4 ◦C) and
stored at−20 ◦C prior to processing.
DNA extraction, amplification and sequencing
The total DNA extraction was performed by modifying the method described byDoyle & Doyle (1990). The leaves were washed with sterile water and 70% ethyl alcohol. Approximately 200 mg of cacao leaves were ground with liquid nitrogen with 60 mg polyvinyl pyrrolidone and 1 mL of CTAB buffer (2% CTAB (w/v), 20 mM ethylenediaminetetraacetic acid (EDTA), 1.4 M NaCl, 100 mM TrizmaR base, pH adjusted
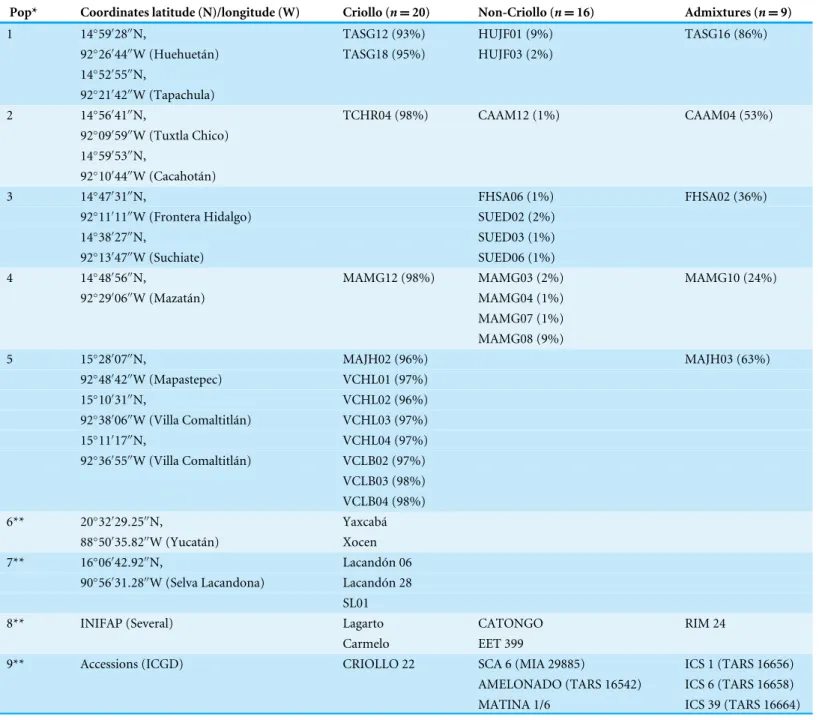
Table 1 Geographic populations* and genetic classification of the analyzedTheobroma cacaotrees. For populations 1–5 (from farms in So-conusco, Mexico) genetic clustering was based on membership to the Criollo group (%) described byVázquez-Ovando et al. (2014)using SSR mark-ers. For the reference trees** (populations 6–9), the genetic grouping was suggested byAvendaño-Arrazate et al. (2010)and the database accessions (ICGD;Turnbull & Hadley, 2016).
Pop* Coordinates latitude (N)/longitude (W) Criollo (n=20) Non-Criollo (n=16) Admixtures (n=9)
1 14◦59′28′′N, TASG12 (93%) HUJF01 (9%) TASG16 (86%)
92◦26′44′′W (Huehuetán) TASG18 (95%) HUJF03 (2%)
14◦52′55′′N,
92◦21′42′′W (Tapachula)
2 14◦56′41′′N, TCHR04 (98%) CAAM12 (1%) CAAM04 (53%)
92◦09′59′′W (Tuxtla Chico)
14◦59′53′′N,
92◦10′44′′W (Cacahotán)
3 14◦47′31′′N, FHSA06 (1%) FHSA02 (36%)
92◦11′11′′W (Frontera Hidalgo) SUED02 (2%)
14◦38′27′′N, SUED03 (1%)
92◦13′47′′W (Suchiate) SUED06 (1%)
4 14◦48′56′′N, MAMG12 (98%) MAMG03 (2%) MAMG10 (24%)
92◦29′06′′W (Mazatán) MAMG04 (1%)
MAMG07 (1%) MAMG08 (9%)
5 15◦28′07′′N, MAJH02 (96%) MAJH03 (63%)
92◦48′42′′W (Mapastepec) VCHL01 (97%)
15◦10′31′′N, VCHL02 (96%)
92◦38′06′′W (Villa Comaltitlán) VCHL03 (97%)
15◦11′17′′N, VCHL04 (97%)
92◦36′55′′W (Villa Comaltitlán) VCLB02 (97%)
VCLB03 (98%) VCLB04 (98%) 6** 20◦32′29.25′′N, Yaxcabá
88◦50′35.82′′W (Yucatán) Xocen
7** 16◦06′42.92′′N, Lacandón 06
90◦56′31.28′′W (Selva Lacandona) Lacandón 28
SL01
8** INIFAP (Several) Lagarto CATONGO RIM 24
Carmelo EET 399
9** Accessions (ICGD) CRIOLLO 22 SCA 6 (MIA 29885) ICS 1 (TARS 16656) AMELONADO (TARS 16542) ICS 6 (TARS 16658) MATINA 1/6 ICS 39 (TARS 16664)
Notes.
ICGD, International Cocoa Germplasm Database; TARS, Tropical Agriculture Research Station; INIFAP, Instituto Nacional de Investigaciones Forestales, Agrícolas y Pecuarias.
chloroform-isoamyl alcohol and precipitated with isopropanol. The extracted DNA was then purified with a mixture of phenol:chloroform:isoamyl alcohol (25:24:1). The DNA was dissolved in 60µL of Milli-Q water and its integrity verified on 0.8% agarose gels.
estimated from absorbances at 260 nm. Absorbance readings were performed on Jenway, Genova Spectrophotometer (Krackeler Scientific Incorporation, Albany, NY, USA).
The cpDNA amplification of thetrnH-psbAintergenic spacer was conducted using the forward primer 5′-CGCGCATGGTGGATTCACAATCC-3′ and reverse primer 5′
-GTTATGCATGAACGTAATGCTC-3′(Shaw & Small, 2005). The PCR conditions were
modified fromShaw & Small (2005). The PCR was performed in a 25µL reaction mixture
containing 100 ng of genomic DNA, 4µL of 10x PCR ViBuffer A (VivantisTMOceanside
CA, USA), 1µL of MgCl2(50 mM), 0.5µL of dNTP Mix (10 mM, Promega), 0.05 mM of
each primer and 2.5 U of Taq DNA polymerase (VivantisTM). Following one cycle of 5 min at 94 ◦C, 35 PCR cycles of 30 s at 94 ◦C, 30 s at 53 ◦C and 1 min at 72 ◦C and a 10 min 72◦C
final extension were performed in a TC3000 thermal cycler (Techne, Cambridge, UK). To verify the presence of amplicons, the PCR products were separated on 6% polyacrylamide gels using 0.5X TBE buffer at 110 V for 210 min, stained with ethidium bromide (0.6 ng/µL) for 15 min, visualized under UV light and photographed with a Gel DocTM EZ
Imager gel documentation system (Bio-Rad, USA). Fragment sizes were estimated using Image Lab (v. 4.0.1, Bio-Rad Laboratories) and integrating the GeneRulerTM100 bp DNA Ladder Plus (FermentasR) as a molecular weight marker.
The PCR products were directly sequenced using the Dye Terminator Cycle Sequencing with Quick Start Kit (GenomeLabTM) on a CEQTM 8000 automatic DNA sequencer (Beckman CoulterTM). To validate the results, the DNA was extracted twice and amplified independently. The sequences were verified by comparison with their forward and reverse sequences when applicable.
Sequence alignment and data analysis
The sequence quality was checked and the electropherograms were edited using BioEdit c
(Hall, 1999). Sequences were limited at the ends to avoid the presence of variable sites due to the introduction of sequencing artifacts by the polymerase (approx. 40 bp) and aligned with ClustalW 1.81 (Thompson, Higgins & Gibson, 1994). Visual inspection and manual editing of the sequences was performed to confirm the variable sites. We used two different analytical approaches based on the geographic origin and the genetic origin of the samples (Table 1). In both approaches, molecular diversity indices including the number of segregating sites (S), the number of haplotypes, the haplotype diversity (Hd) and the nucleotide diversity (πd) were estimated following the methods ofNei (1987)in DnaSP c5.1 (Rozas et al., 2010).
To infer evolutionary relationships at the intraspecific level, we produced a network. The method used was median-joining (MD) based on parsimony criteria (Bandelt, Forster & Röhl, 1999;Polzin & Daneshmand, 2003) and was performed with the software Network c4.6.1.3 (Bandelt et al., 1995).
Analysis of molecular variance (AMOVA), pairwiseFstvalues and statistical analyses of molecular variance (FCT (test performed by permuting individuals within populations), FST (test performed by permuting genotypes among populations but within groups)
andFSC (test performed by permuting genotypes among groups)) were estimated using
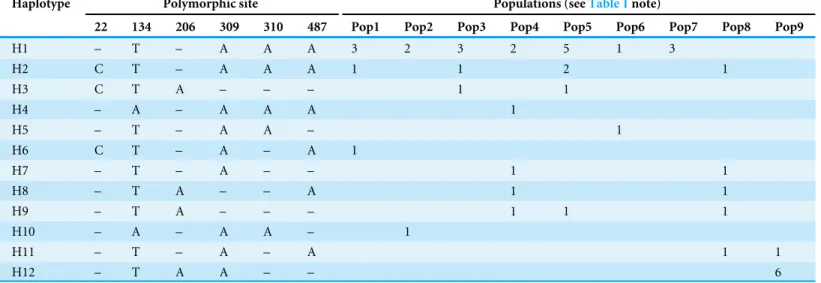
Table 2 Nucleotide polymorphic sites and cpDNA haplotypes in cacao populations based on variation in the intergenictrnH-psbAspacer re-gion.
Haplotype Polymorphic site Populations (seeTable 1note)
22 134 206 309 310 487 Pop1 Pop2 Pop3 Pop4 Pop5 Pop6 Pop7 Pop8 Pop9
H1 – T – A A A 3 2 3 2 5 1 3
H2 C T – A A A 1 1 2 1
H3 C T A – – – 1 1
H4 – A – A A A 1
H5 – T – A A – 1
H6 C T – A – A 1
H7 – T – A – – 1 1
H8 – T A – – A 1 1
H9 – T A – – – 1 1 1
H10 – A – A A – 1
H11 – T – A – A 1 1
H12 – T A A – – 6
by 99,999 random sequence permutations. To determine whether sample sites clustered on a population level, a spatial analysis of variance (SAMOVA) was conducted (Dupanloup, Schneider & Excoffier, 2002) using haplotype data and the geographic coordinates of each of the 5 sample sites. The SAMOVA was run forK=2–5 putative populations to determine the maximumFST value and the highest proportion of differences between populations
due to genetic variation.
The neutral evolution of chloroplast DNA was evaluated to examine whether any population had experienced historic demographic changes using Tajima’sDtest (Tajima, 1989) with Arlequinc version 3.0 (
Excoffier, Laval & Schneider, 2005). It was computed for all seven geographic populations and overall withouta prioripopulations designation;
p-value were generated using 1,000 simulations under a model of selective neutrality. Seven accessions from the NCBI database were included as references in the genetic origin approach analysis: MATINA 1/6 (HQ336404.2), CRIOLLO-22 (JQ228379.1) AMELONADO (JQ228380.1) SCA 6 (JQ228382.1), ICS 1 (JQ228381.1), ICS 6 (JQ228383.1) and ICS 39 (JQ228387.1).
RESULTS
Sequence characterization and genetic diversity
Figure 1 Location of indels (blue arrows) and the transversion (red arrow) in a sequenced fragment of the chloroplast DNAtrnH-psbA inter-genic spacer fromTheobroma cacaotrees. SeeTable 1for sample details.
Table 3 Genetic diversity in cacaos from Soconusco (Chiapas, Mexico) grouped by the geographic ap-proach (Pop) and genetic origin apap-proach.
Pop Locality N S Sn H Hd πd
1 Huehuetán, Tapachula 5 2 1 3 0.70±0.21 0.0019±0.0017 2 Cacahoatán, Tuxtla Chico 3 2 1 2 0.67±0.31 0.0026±0.0026 3 Frontera Hidalgo, Suchiate 5 5 0 3 0.70±0.21 0.0042±0.0032 4 Mazatán 6 5 3 5 0.93±0.12 0.0048±0.0035 5 Mapastepec, Villa Comaltitlán 9 5 0 4 0.69±0.14 0.0039±0.0027 6 Yucatán 2 1 1 2 1.00±0.50 0.0019±0.0027
7 Selva Lacandona 3 0 0 1 0 0
Total 33 – 6 –
Mean±sd 0.66±0.08 0.0032±0.0021
Genetic origin approach*
‘‘Criollo’’ 12 6 1 4 0.64±0.13 0.0025±0.0019 ‘‘Non-Criollo’’ 11 5 1 5 0.62±0.16 0.0030±0.0021 ‘‘Admixtures’’ 5 5 1 5 1.00±0.12 0.0060±0.0041 Criollo-referencea 8 4 1 5 0.79±0.15 0.0033±0.0025
Forastero-referencea 5 3 0 3 0.80±0.16 0.0031±0.0025
Trinitario-referencea 4 4 0 2 0.50±0.27 0.0038±0.0032
Total 45 – 4 –
Mean±sd 0.80±0.05 0.0038±0.0024
Notes.
N, Samples sizes;S, Number of segregating;Sn, Singletons;H, Number of haplotypes;Hd, Haplotype diversity;πd, Nu-cleotide diversity;sd, standard deviation.
aIncluding sequences GenBank (Criollo-referencen=1, Forastero-referencen=3, Trinitario-referencen=3).
*Classification based on membership (>90%) to Criollo type, seeTable 1(Vázquez-Ovando et al., 2014).
5 (two trees) formed the second most common haplotype (H2). Overall, 60% of the haplotypes (six of the ten) were singletons (Fig. 1). The analysis showed that most of the genetic diversity was found in Population 4 (Mazatán), which contained the highest values for the most informative indices (Table 3); Population 4 included 50% of the identified haplotypes (Fig. 1). The other populations maintained moderate Hd and lowπdvalues that were similar for each population (Table 3). The Yucatán and Selva Lacandona populations (wild) exhibited Hd values of 1 and 0, respectively, although these data like those of Pop 2, would be influenced by the low numbers of reference individuals.
Figure 2 Median joining network for chloroplast DNAtrnH-psbAintergenic spacer haplotypes of Theobroma cacaotrees from Soconusco, Mexico, and the outgroup haplotype (Theobroma bicolor).
The map indicates the geographic distribution of the haplotypes. The colored portions represent the pro-portions of the same haplotype occurring in each sampling locality. Trees employed as the references (Pop 6 and Pop 7) are shown outside the map. The population code and details are shown inTable 1.
Intraspecific relationships
Figures 2and3show the haplotype networks built with data from the geographic (Fig. 2) and genetic approaches (Fig. 3). The individuals belonging to each haplotype are also included. The general base has a common haplotype for the two networks (H1) that includes cacao trees from all geographic populations (Fig. 2) and four of six groups based on the genetic approach (Fig. 3). A unique set of intermediate haplotypes are derived from this common haplotype (H1) and are interconnected by one or two mutational steps in both networks. The H4–H6 haplotypes were farthest from the central clade (i.e., newly created haplotypes;Figs. 2and3). Haplotypes H3–H6 were singletons.
Population genetic structure
The analysis of molecular variance (AMOVA) was not significant and had a value ofFST=0.
In the spatial analysis of molecular variance (SAMOVA), the valueK=2 extended theFST
to 0.0439 and generated two groups: the first contained only Population 4 (Mazatán) and the second grouped the other geographic populations (Table 4).
Figure 3 Median joining network for the chloroplast DNAtrnH-psbAintergenic spacer haplotypes of Theobroma cacaotrees cultivated in Soconusco, Mexico, and the reference accessions.The circle sizes are proportional to the haplotype frequencies, and the color represents the proportions of the same haplo-type occurring in each genetic group. For genetic group details, seeTable 1.
Table 4 Spatial analysis of molecular variance (K=2) for cacao populations and the statistical analysis of molecular variance fixation indices corresponding to the groups.
Source of variation df SS VC Variation (%) Fixation indices Pvalue
Among groups 1 1.61 0.1282 13.98 FSC= −0.1115 0.7341
Among populations within groups 5 2.51 −0.0879 −9.59 FST=0.0439 0.0068
Within populations 26 22.80 0.8765 95.61 FCT=0.1398 0.1496
Total 32 26.91 0.9168
Notes.
df, degrees of freedom; SS, Sum of squares; VC, Variance components.
DISCUSSION
In this study, high haplotype variation was found in the chloroplast DNA from cacao trees grown in the Soconusco region. No inversions or transitions were found, although they were reported to be common in other plants (Whitlock, Hale & Groff, 2010;Zeng et al., 2012). However, we found five insertions or deletions (indels) in three poly-A regions and one A ↔T transversion (Fig. 1). This result agreed with the findings reported by
Aldrich et al. (1988) that indels were a presumably common feature in thetrnH-psbA
region. In the data analysis, we included the indels as informative character states, and the high interspecific divergence of the spacer region allowed their use as a marker for DNA barcoding (Kress & Erickson, 2007). The molecular diversity indices determined in the present study were similar to the results of Zeng et al. (2012) using the same intergenic spacer, which revealed 11 haplotypes for 35Thinopyrum intermediumsamples, low nucleotide diversity (πd=0.00473) and moderately high haplotype diversity (Hd=0.7331) (our results for the geographic populations were πd=0.0032 and
Hd =0.66). The results of those authors supported the use of one intergenic spacer to reveal nucleotide polymorphisms similar to our findings.
Our haplotype diversity results are contrary to those reported byVázquez-Ovando et al. (2014). These authors reported low genetic diversity in individuals from the same region (in particular Population 4 in Mazatán) using microsatellite markers. One reason for the discrepancy may be that a larger number of individuals with Criollo ancestry was included in that study, resulting in a higher degree of homozygotes and lower population genetic diversity. Our study also included individuals from other cacao varieties that possessed greater genetic diversity, at least at the nuclear DNA level. However, the low nucleotide diversity found in this study was supported by the low genetic variability found using nuclear microsatellites. Individuals included in both studies showed great morphological pod variability that resembled the Criollo type (e.g., different degrees of roughness, color and deep grooves) reported previously byAvendaño-Arrazate et al. (2010). This finding could reveal a greater association between the morphological variability of the cacao pod with the reported allelic richness (Vázquez-Ovando et al., 2014) and the presence of polymorphic sites in several trees found in our study.
The number of haplotypes was higher than the number of polymorphic sites (Table 2). This feature is associated with ancestral species that have sufficiently diverged to accumulate mutations among different haplotypes (Roger, 1995). The haplotype number detected in the present study is unusually striking compared with other works. For example,Yang et al. (2013)found only three haplotypes based on three cpSNP markers. However, that study exclusively analyzed nucleotide substitutions, whereas in this study five indel regions were included; this difference may explain the high haplotype diversity found here. Indels have been reported to have a high mutation rate compared with other regions of the cpDNA (Ingvarsson, Ribstein & Taylor, 2003), especially when they are repeated locally (Yamane, Yano & Kawahara, 2006) such as in region 309–310 of our sequences (Fig. 1).
Criollo. Finally, heteroplasmy and haplotype polymorphisms of plastid genomes within and among individuals were documented in Malvaceae (Wolfe & Randle, 2004). These phenomena could be present in Theobroma cacao. To test those hypotheses, additional studies are needed using high-throughput sequencing of chloroplast genomes.
Population 7 (Selva Lacandona) exhibited no haplotype diversity (Hd=0). However, haplotype H1 located in this population is considered the common ancestor because it is shared by all populations (Fig. 2). In contrast, the two individuals belonging to Population 6 (Yucatán), which exhibited different haplotypes (H1 and H5) from one another, were interrelated by only a mutational step (Fig. 2). This result shows that an individual tree belonging to a Yucatán population (as well as all other haplotypes) eventually descended from other individuals in this region where the Maya people grew cacao.
The low nucleotide polymorphism levels could be explained by rapid population expansion events in the distribution range, whereas high haplotype diversity might be due to the continuous introduction of individuals from different locations. However, these results should be interpreted with caution because, as stated above, they are limited by the sample’s size. Populations recently introduced or expanded from a small number of founders would have a common haplotype shared by most individuals and many rare haplotypes connected to the main population by a few independent mutations (Slatkin & Hudson, 1991;Avise, 2000) such as observed in the present study (Fig. 2). A similar argument was proposed based on the use of microsatellite markers (Vázquez-Ovando et al., 2014).
The relatively low variability in the cultivated cacao populations was supported by the lack of neutrality revealed by the global Tajima test. Specifically, the negative Tajima’sD
value (−0.93302) in Population 4 (Mazatán) could be related to a ‘‘bottleneck’’ event, which would indicate population expansion and not natural expansion because it was a cultivated population. The occurrence of unclear events in the past (disease, volcanic eruptions or other natural events) may have caused the almost complete disappearance of populations established by the people in the Mesoamerican region (De Sahagún, 2009,
Overall, cacao trees with high Criollo ancestry were located in the center of the haplotype network. This result was supported by the coalescence theory that predicted that the ancient haplotype should be the most common and most distributed among the populations. In concordance, derived haplotypes would be less frequent and in many cases would be private; these haplotypes would be located in regions containing the latest cultivated cacao populations. The H10 and H9 haplotypes may have been recently created because they are located at the ends of the network, possibly due to germplasm exchange with traits of interest to cacao farmers. These anthropogenic activities may have had a strong impact on the levels of variation observed in the cpDNA sequences, which explains the observed lack of differentiation. Additionally, migration over long distances and the exchange by farmers contributed to the colonization of new regions founded by a few individuals, thereby establishing different alleles via mutation and genetic drift.
Furthermore, theFST=0 value determined by AMOVA revealed that all of the molecular
variance occurred within populations. Indeed, the SAMOVAFST value (Table 4) was not
sufficient to show at least moderate differentiation between populations (FST ≥0.05).
This finding provides some explanations regarding the demographic history ofT. cacao
trees, indicating that the populations formeda prioriand experienced gene flow, resulting in population homogenization. The spatial analysis revealed the highest differentiation between groups whenK=2 was tested;K=3 (FST=0.00088) grouped trees from the
Yucatán, Selva and Cacahoatán in the same genetic population. This grouping is unusual because the geographic distance is longer among the three localities and may be associated with the distribution of trees in the past (i.e., the ancestral haplotype (H1) grouped individuals from Selva; one mutational step resulted in the origination of the individuals from the Yucatán, which in turn originated the individuals at Cacahoatán by the same event (Fig. 3)). Following this criterion, H4 and the non-Criollo trees belonging to H1 have a greater correspondence with the Criollo genotype, although it was previously reported to be an Admixture and non-Criollo, respectively (Vázquez-Ovando et al., 2014).
CONCLUSIONS
Indels and one transversion located in the chloroplast DNAtrnH-psbAspacer region of cacao trees can distinguish individuals that are indistinguishable in other marker systems or separated by only few SSR markers, and further support use of these cpDNA markers.The molecular analysis showed low nucleotide diversity but high haplotype diversity possibly due to population bottleneck events. These results were confirmed by the negative Tajima’s
influence. Increasing sampling numbers would go a long way in establishing whether a true sub-structure of maternal origin exists. One geographic population (Pop 4, Mazatán) consisted of high frequency haplotypes, which makes this zone an important reservoir of genetic material at the chloroplast and possibly phenotypic levels because an abundance of pod morphology was also observed in this population. The genetic differentiation between populations was zero, suggesting that gene flow homogenized the populations.
ACKNOWLEDGEMENTS
The authors thank Nancy Gálvez-Reyes for her advice on data analysis and comments on the manuscript. The authors also thank the three referees for their exhaustive revisions, which helped to improve the manuscript.
ADDITIONAL INFORMATION AND DECLARATIONS
Funding
This work was partly funded by SEP-Mexico through the program PROFOCIE-2014-07MSU0001H-11 and by Consejo Estatal de Ciencia y Tecnología del Estado de Chiapas, Mexico. The funders had no role in study design, data collection and analysis, decision to publish, or preparation of the manuscript.
Grant Disclosures
The following grant information was disclosed by the authors: SEP-Mexico: PROFOCIE-2014-07MSU0001H-11.
Consejo Estatal de Ciencia y Tecnología del Estado de Chiapas, Mexico.
Competing Interests
The authors declare there are no competing interests
Author Contributions
• Nidia Gutiérrez-López performed the experiments, analyzed the data, wrote the paper, prepared figures and/or tables.
• Isidro Ovando-Medina conceived and designed the experiments, contributed reagents/ materials/analysis tools, wrote the paper, reviewed drafts of the paper.
• Miguel Salvador-Figueroa conceived and designed the experiments, contributed reagents/materials/analysis tools, reviewed drafts of the paper.
• Francisco Molina-Freaner and Carlos H. Avendaño-Arrazate contributed reagents/ma-terials/analysis tools, reviewed drafts of the paper.
• Alfredo Vázquez-Ovando conceived and designed the experiments, analyzed the data, contributed reagents/materials/analysis tools, wrote the paper, prepared figures and/or tables, reviewed drafts of the paper.
DNA Deposition
Data Availability
The following information was supplied regarding data availability: The research in this article did not generate any raw data.
Supplemental Information
Supplemental information for this article can be found online athttp://dx.doi.org/10.7717/ peerj.1855#supplemental-information.
REFERENCES
Aldrich J, Cherney BW, Merlin E, Christopherson L. 1988.The role of
insertion/dele-tions in the evolution of the intergenic region betweenpsbAandtrnH in the chloroplast genome.Current Genetics14:137–146DOI 10.1007/BF00569337.
Arroyo-García R, Ruiz-García L, Bolling L, Ocete R, López MA, Arnold C, Ergul A, Söylemezoğlu G, Uzun HI, Cabello F, Ibáñez J, Aradhya MK, Atanassov A, Atanassov I, Balint S, Cenis JL, Costantini L, Goris-Lavets S, Grando MS, Klein BY, McGovern PE, Merdinoglu D, Pejic I, Pelsy F, Primikirios N, Risovannaya V, Roubelakis-Angelakis KA, Snoussi H, Sotiri P, Tamhankar S, This P, Troshin L,
Malpica JM, Lefort F, Martinez-Zapater JM. 2006.Multiple origins of cultivated
grapevine (Vitis viniferaL. ssp.sativa) based on chloroplast DNA polymorphisms.
Molecular Ecology 15:3707–3714DOI 10.1111/j.1365-294X.2006.03049.x.
Avendaño-Arrazate CH, Ogata-Aguilar N, Gallardo-Méndez RA, Mendoza-López
A, Aguirre-Medina JF, Sandoval-Esquivez A. 2010.Cacao Diversidad en México.
Publicación Especial No. 1, Tuxtla Chico, Chiapas: Instituto de Investigaciones Forestales, Agrícolas y Pecuarias. Centro de Investigación Pacífico Sur. Campo Experimental Rosario Izapa, 86 pp.
Avise CJ. 2000.Phylogeography: the history and formation of species. Cambridge: Harvard
University Press, 228 pp.
Azuma H, García-Franco JG, Rico-Gray V, Thien LB. 2001.Molecular phylogeny of
themagnoliaceae: the biogeography of tropical and temperate disjunctions.American Journal of Botany88(12):2275–2285DOI 10.2307/3558389.
Bandelt HJ, Forster P, Röhl A. 1999.Median-joining networks for inferring intraspecific
phylogenies.Molecular Biology and Evolution16(1):37–48 DOI 10.1093/oxfordjournals.molbev.a026036.
Bandelt HJ, Forster P, Sykes BC, Richards MB. 1995.Mitochondrial portraits of human
populations using median networks.Genetics141:743–753.
Bieniek W, Mizianty M, Szklarczyk M. 2015.Sequence variation at the three chloroplast
loci (matK,rbcL,trnH-psbA) in the Triticeae tribe (Poaceae): comments on the relationships and utility in DNA barcoding of selected species.Plant Systematics and Evolution301:1275–1286DOI 10.1007/s00606-014-1138-1.
Chen T, Wang X-R, Tang H-R, Chen Q, Huang X-J, Chen J. 2013.Genetic diversity and
Cheesman E. 1944.Notes on the nomenclature, classification and possible relationships of cacao populations.Tropical Agriculture21:144–159.
Crandall KA, Templeton AR. 1993.Empirical test of some predictions from coalescent
theory with applications to intraspecific phylogeny reconstruction.Genetics
134(3):959–969.
De la Cruz M, Whitkus R, Gómez-Pompa A, Mota-Bravo L. 1995.Origins of cacao
cultivation.Nature 375:542–543DOI 10.1038/375542a0.
De Sahagún B. 2009.Historia general de las cosas de la Nueva España II. Madrid:
Editorial Dastin Export, cap. III and XII.
Doyle JJ, Doyle JL. 1990.A rapid total DNA preparation procedure for fresh plant tissue.
Focus12:13–15.
Dupanloup I, Schneider S, Excoffier LG. 2002.A simulated annealing approach to
define the genetic structure of populations.Molecular Ecology 11:2571–2581 DOI 10.1046/j.1365-294X.2002.01650.x.
Excoffier L, Laval G, Schneider S. 2005.Arlequin Ver. 3.0: an integrated software
package for population genetics data analysis.Evolutionary Bioinformatics Online
1:47–50. Available athttp://www.ncbi.nlm.nih.gov/pmc/articles/PMC2658868/.
Hall TA. 1999.BioEdit: a user-friendly biological sequence alignment editor and analysis
program for Windows 95/98/NT.Nucleic Acids Symposium Series41:95–98.
Hamilton MB, Braverman JM, Soria-Hernanz DF. 2003.Patterns and relative rates of
nucleotide and insertion/deletion evolution at six chloroplast intergenic regions in new world species of the Lecythidaceae.Molecular Biolology and Evolution
20(10):1710–1721DOI 10.1093/molbev/msg190.
Hedrick PW. 2005.Genetics of populations. Sudbury: Jones and Bartlett Publishers, 737
pp.
Ingvarsson PK, Ribstein S, Taylor DR. 2003.Molecular evolution of insertions and
deletion in the chloroplast genome ofSilene.Molecular Biology and Evolution
20(11):1737–1740DOI 10.1093/molbev/msg163.
Jansen RK, Saski C, Lee SB, Hansen AK, Daniell H. 2011.Complete plastid genome
sequences of three rosids (Castanea,Prunus,Theobroma): evidence for at least two independent transfers ofrpl22to the nucleus.Molecular Biolology and Evolution
28(1):835–847DOI 10.1093/molbev/msq261.
Kane N, Sveinsson S, Dempewolf H, Yang JY, Zhang D, Engels M, Cronk JM. 2012.
Ultra-barcoding in cacao (Theobromaspp.; Malvaceae) using whole chloroplast genomes and nuclear ribosomal DNA.American Journal of Botany 99(2):320–329 DOI 10.3732/ajb.1100570.
Kress WJ, Erickson DL. 2007.A two-locus global DNA barcode for land plants: the
codingrbcLgene complements the non-codingtrnH-psbAspacer region.PLoS ONE
2:e508DOI 10.1371/journal.pone.0000508.
Motamayor JC, Lachenaud P, Da Silva e Mota JW, Loor R, Kuhn DN, Brown
JS, Schnell RJ. 2008.Geographic and genetic population differentiation of
Motamayor JC, Risterucci AM, Lopez PA, Ortiz CF, Moreno A, Lanaud C. 2002.
Cacao domestication I: the origin of the cacao cultivated by the Mayas.Heredity
89:380–386DOI 10.1038/sj.hdy.6800156.
Nei M. 1987.Molecular evolutionary genetics. New York: Columbia University Press, pp.
512.
Pérez-Jiménez M, Besnard G, Dorado G, Hernandez P. 2013.Varietal tracing of
virgin olive oils based on plastid DNA variation profiling.PLoS ONE8(8):e70507 DOI 10.1371/journal.pone.0070507.
Polzin T, Daneshmand SV. 2003.On Steiner trees and minimum spanning trees in
hypergraphs.Operation Research Letters31:12–20.
Powis T, Cyphers A, Gaikwad N, Grivetti L, Cheong K. 2011.Cacao use and the San
Lorenzo Olmec.Proceedings of the National Academy of Sciences of the United States of America108(21):8595–8600DOI 10.1073/pnas.1100620108.
Raymúndez MB, Mathez J, Xena de Enrech N, Dubuisson JY. 2002.Coding of
insertion–deletion events of the chloroplastic intergeneatp-rbcLfor the phylogeny of the Valerianeae tribe (Valerianaceae).Comptes Rendus Biologies325:131–139 DOI 10.1016/S1631-0691(02)01416-6.
Roger RA. 1995.Genetic evidence for Pleistocene population explosion.Evolution
49(4):608–615DOI 10.2307/2410314.
Rozas J, Librado P, Sánchez-Del Barrio JC, Messeguer X, Rozas R. 2010.DNA sequence
polymorphism. Ver. 5.10.1 Universidad de Barcelona.Available athttp:// www.ub.edu/ dnasp/ (accessed 20 July 2015).
Shaw J, Lickey EB, Edward E, Schilling EE, Small RL. 2007.Comparison of whole
chloroplast genome sequences to choose noncoding regions for phylogenetic studies in angiosperms: the tortoise and the hare III.American Journal of Botany
94(3):275–288DOI 10.3732/ajb.94.3.275.
Shaw J, Small RL. 2005.Chloroplast DNA phylogeny and phylogeography of the
North American plums (PrunussubgenusPrunussectionPrunocerasus, Rosaceae).
American Journal of Botany 92:2011–2030DOI 10.3732/ajb.92.12.2011.
Slatkin M, Hudson RR. 1991.Pairwise comparisons of mitochondrial DNA sequences in
stable and exponentially growing populations.Genetics129:555–562.
Sun XQ, Zhu YJ, Guo JL, Peng B, Bai MM, Hang YY. 2012.DNA Barcoding the
dioscorea in china, a vital group in the evolution of monocotyledon: use ofmatK
gene for species discrimination.PLoS ONE 7(2):e32057 DOI 10.1371/journal.pone.0032057.
Tajima F. 1989.Statistical method for testing the neutral mutation hypothesis by DNA
polymorphism.Genetics123:585–595.
Thompson JD, Higgins DG, Gibson TJ. 1994.CLUSTAL W: improving the sensivity
of progressive multiple sequence alignment through sequence weighting, position-specific gap penalties and weight matrix choise.Nucleic Acids Research22:4673–4680 DOI 10.1093/nar/22.22.4673.
Toxopeus H. 1985. Botany, types and populations. In: Wood GAR, Lass RA, eds.Cocoa.
Turnbull CJ, Hadley P. 2016.International Cocoa Germplasm Database (ICGD). [Online Database] Reading: CRA Ltd./ICE Futures Europe/University of Reading.
Available athttp:// www.icgd.reading.ac.uk(accesed 11 January 2016).
Vázquez-Ovando JA, Molina-Freaner F, Nuñez-Farfán J, Ovando-Medina I,
Salvador-Figueroa M. 2014.Genetic identification ofTheobroma cacaoL. trees with high
Criollo ancestry in Soconusco, Chiapas, Mexico.Genetic and Molecular Research
13(4):10404–10414DOI 10.4238/2014.December.12.2.
Wang FY, Gong X, Hu CM, Hap G. 2008.Phytogeography of an alpine speciesPrimula
secundiflorainferred from the chloroplast DNA sequence variation.Journal of Systematics and Evolution46:13–22.
Whitkus R, De la Cruz M, Mota-Bravo L, Gómez-Pompa A. 1998.Genetic diversity and
relationships of cacao (Theobroma cacaoL.) in southern Mexico.Theoretical and Applied Genetics96(1–2):621–627DOI 10.1007/s001220050780.
Whitlock BA, Hale AM, Groff PA. 2010.Intraspecific inversions pose a challenge for the
trnH-psbAplant DNA barcode.PLoS ONE 5(7):e11533 DOI 10.1371/journal.pone.0011533.
Wolfe AD, Randle CP. 2004.Recombination, heteroplasmy, haplotype polymorphism,
and paralogy in plastid genes: implications for plant molecular systematics. System-atic Botany29:1011–1020DOI 10.1600/0363644042451008.
Wood GAR. 2001. Consumption and manufacture. In: Wood GAR, Lass RA, eds.Cocoa.
4th edition. Oxford: Blackwell Science Ltd, 587–597.
Yamane K, Yano K, Kawahara T. 2006.Pattern and rate of indel evolution inferred from
whole chloroplast intergenic regions in sugarcane, maize and rice.DNA Research
13:197–204DOI 10.1093/dnares/dsl012.
Yang JY, Motilal LA, Dempewolf H, Maharaj K, Cronk QC. 2011.Chloroplast
microsatellite primers for cacao (Theobroma cacao).American Journal of Botany
98(12):e372–e374DOI 10.3732/ajb.1100306.
Yang JY, Scascitelli M, Motilal LA, Sveinsson S, Engels JMM, Kane NC, Dempewolf
H, Zhang D, Maharaj K, Cronk QCB. 2013.Complex origin of Trinitario-type
Theobroma cacao(Malvaceae) from Trinidad and Tobago revealed using plastid genomics.Tree Genetics & Genomes9(3):829–840DOI 10.1007/s11295-013-0601-4.
Zeng J, Fan X, Sha LN, Kang HY, Zhang HQ, Liu J, Wang XL, Yang RW, Zhou
YH. 2012.Nucleotide polymorphism pattern and multiple maternal origin in
Thinopyrum intermediuminferred bytrnH-psbAsequences.Biologia Plantarum