Printed in Brazil - ©2007 Sociedade Brasileira de Química 0103 - 5053 $6.00+0.00
Article
*e-mail: [email protected]
Sample Optimization for Rapid Identification of Nucleosides and Bases from Ascidian
Extracts using ESI-MS/MS
Renata Takeara,a Paula C. Jimenez,b Letícia V. Costa-Lotufo,b João L. C. Lopesa and Norberto P. Lopes*,a
a
Departamento de Física e Química, Faculdade de Ciências Farmacêuticas de Ribeirão Preto, Universidade de São Paulo, Av. do Café, s/n, 14040-903 Ribeirão Preto-SP, Brazil
b
Departamento de Fisiologia e Farmacologia, Faculdade de Medicina, Universidade Federal do Ceará, CP 3157, 60430-270 Fortaleza-CE, Brazil
Um método de espectrometria de massas sequencial com ionização por electrospray
(IES-EM/EM) foi desenvolvido para identificação dos nucleosídeos e bases em extratos de ascídias. Para este fim realizamos um estudo sistemático de preparo de amostra associado à análise de fragmentação de uma série de nucleosídeos e bases em IES-EM/EM. Estas abordagens constituem
ferramentas analíticas importantes para screening rápido e determinação estrutural de
nucleosídeos e bases em extratos de ascídias, os quais podem auxiliar nos estudos ecológicos do gênero.
Electrospray ionization tandem mass spectrometry (ESI-MS/MS) method was developed for identification of nucleosides and bases in extracts of ascidians. For this study a systematic sample preparation associated with the fragmentation pattern of a series of nucleosides and bases using ESI-MS/MS was done. These approaches constitute powerful analytical tools for rapid screening and structural assignment of nucleosides and bases in ascidian extracts.
Keywords: natural products, ESI-MS/MS, ascidian, nucleosides, glycosylamines
Introduction
Nucleosides are part of the nucleic acid compound family. They are glycosylamines made by attaching a nucleobase to a ribose or deoxyribose ring. Examples of these include cytidine, uridine, adenosine, guanosine, thymidine and inosine. Nucleosides are involved in the regulation and modulation of various physiological processes in the central nervous system (CNS). Adenosine can depress the excitability of CNS neurons and inhibit the release of various neurotransmitters presynaptically.1,2
There is growing pharmacological evidence based on studies with several animal models of seizure disorder that adenosine possesses anticonvulsivant activity.3
Inosine, the major biochemical metabolite of adenosine derived from oxidative deamination, stimulates axon growth in vitro and on the adult central nervous system.4
In addition, nucleosides also play an important role in growth and differentiation of the gastrointestinal tract, as
well as in the maintenance of the immune response.5,6
Other closely related compounds are adenine arabinoside (Ara-A), an antiviral compound synthesized and commercialized by Burroughs Wellcome (now Glaxo Smith-Kline) and later found in the Mediterranean gorgonian Eunicella cavolini, and cytosine arabinoside (ARA-C), a potent antileukemic agent commercialized by Upjohn (now Pharmacia). These compounds are derived from spongothymidine and spongouridine isolated in the early 1950s from the Caribbean sponge Criptotethya crypta.7
Nucleosides are present in several species of ascidians. Thymidine was isolated from Trididemnum cereum,8
Aplidium pantherinum,9Didemnum voeltzkowi,10Eudistoma
sp.,11 and Atriolum robustum.12 Uridine was reported in
Aplidium pantherinum,9Botryllus schlosseri,13 and Atriolum
robustum.12 2’-deoxyuridine and 2’-deoxyinosine were
identified in the ascidians Trididemnum cereum8 and Aplidium
pantherinum.9 Hypoxanthine was isolated from Trididemnum
cereum8 and adenosine was present in Eudistoma sp.11 Based
et al.
sources for nucleosides, which can also serve as a chemical taxonomic marker.
In recent years, it has been shown that liquid chromatography (LC) coupled to electrospray ionization mass spectrometry (ESI-MS) is a powerful tool to separate and identify natural products.14-16
Structure elucidation of natural compounds in complex mixtures has also been possible by use of direct injections of crude extracts into the electrospray ionization tandem mass spectrometry (ESI-MS/MS) followed by isolation into the analyzer, even using small quantities of plant material or other biological samples.17,18 More recently, systematic investigation on
ionization processes and gas phase chemistry involved in natural products fragmentation for fingerprint analysis has been useful from plants,19,20 algae,21 and
microorganisms.22 The literature reports several
examples of this approach for alkaloids,19 sesquiterpene
lactones,20 carotenoids,21 polyketides,22-23 quinones,24
retinoids25 and β-carbolines.26
The present paper proposes a sample optimization for rapid identification of nucleosides and bases using electrospray ionization tandem mass spectrometric (ESI-MS/MS) screening method in ascidian extracts. In this study, we report several fast techniques of sample preparation followed by a direct ESI-MS/MS spectrometric method for characterization of the nucleosides.
Experimental
Materials, standards and sample preparation
Colonies of the ascidian E. vannamei (1460 g, wet weight) were collected on the intertidal zone of the beach rocks at Taiba Beach (São Gonçalo do Amarante, Ceará State, Brazil) and frozen. The material was extracted with MeOH (1/5, m/v) at room temperature and the solvent was evaporated in vacuum to afford 46.10 g of the crude extract. The nucleosides adenosine and guanosine were isolated from the methanolic extract of the ascidian E. vannamei and were used as standards.
2’-deoxyguanosine, 2’-deoxyinosine, 2’-deoxyuridine, uridine, thymidine, and hypoxanthine isolated from the methanolic extract of the ascidian Didemnum psammatodes were also used as standards.
Standards of uracil, thymine, guanine, and adenine were purchased from Sigma. A solution of each nucleoside and base (0.1 mg mL-1) was prepared in MeOH/H
2O 1:1
and stored in refrigerator.
The studied compounds are listed in Table 1 and their respective structures are shown in Figure 1.
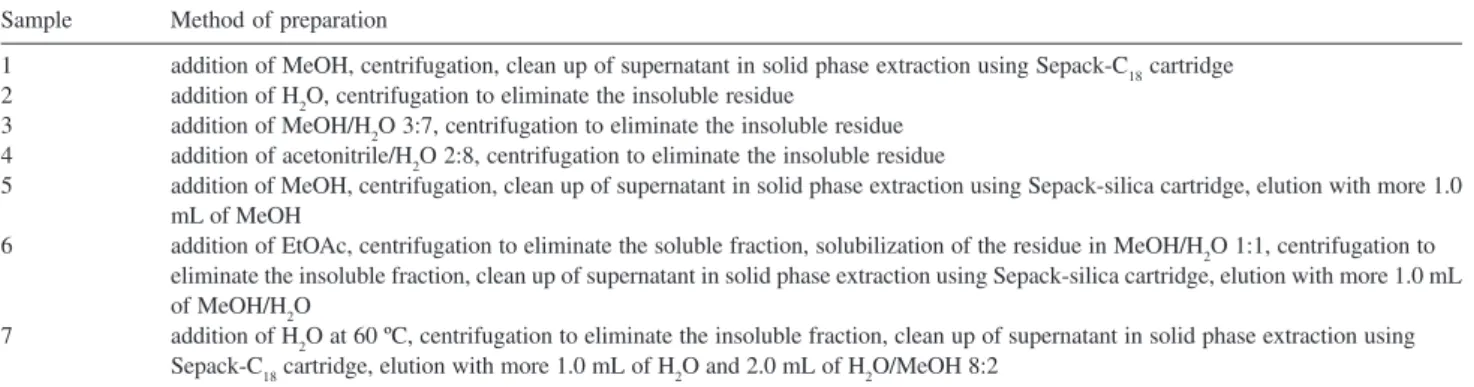
Several samples from the extracts were prepared to analyze the presence of nucleosides and bases. The methods of preparation for each sample are listed in Table 2.
Mass spectrometry
Methanol (HPLC grade) and de-ionized water (Milli-Q) were used throughout the whole study. ESI mass spectra, precursor and product ions scans were acquired in positive ion mode and recorded on a quadrupole-time of flight instrument (UltrOTOF-Q, Bruker Daltonics, Billerica, MA). Conditions: capillary voltage 3400 V; dry gas temperature, 180 °C; dry gas flow, 4 L h-1; nebulizer gas, nitrogen. NaTFA
10 mmol L-1 was used as standard for internal and external
calibration. For tandem mass spectrometry analysis (ESI-MS/MS) nitrogen was used as collision gas.
Results and Discussion
Analysis of standards by ESI-MS
The mass spectra of the guanine and adenine obtained from scan mode showed an intense protonated molecule signal [M + H]+ in addition to the cationized
molecules. However, [M + Na]+ of hypoxanthine,
thymine, 2’-deoxyuridine and thymidine and [M + K]+
Table 1. Substituents of pyrimidine and purine derivatives
Pyrimidines (Figure 1, structure A) R1 R2 R3
(1) Uracil H H H
(2) Thymine CH3 H H
(3) Uridine H H Ribosyl
(4) 2’-Deoxyuridine H H 2’-Deoxyribosyl (5) Thymidine CH3 H 2’-Deoxyribosyl Purines (Figure 1, structure B)
(6) Adenine NH2 H H
(7) Hypoxanthine OH H H
(8) Guanine OH NH2 H
(9) Adenosine NH2 H Ribosyl
(10) 2’-Deoxyadenosine NH2 H 2’-Deoxyribosyl (11) 2’-Deoxyinosine OH H 2’-Deoxyribosyl
(12) Guanosine OH NH2 Ribosyl
(13) 2’-Deoxyguanosine OH NH2 2’-Deoxyribosyl
Figure 1. Structures of pyrimidine (A) and purine (B) derivatives (for substituents, see Table 1).
N NH O
O R
R
R
1
2
3
N N
N N R
R
R
1
2
3
of 2’-deoxyinosine, guanosine and adenosine proved to have a more intense peak than its [M + H]+. The
intensity of [M + Na]+ and [M + K]+ ions will depend
on the quality of the water, solvent and other conditions, but the balance of [M + Na]+ and [M + K]+ ion may
also be used to confirm the molecular mass.
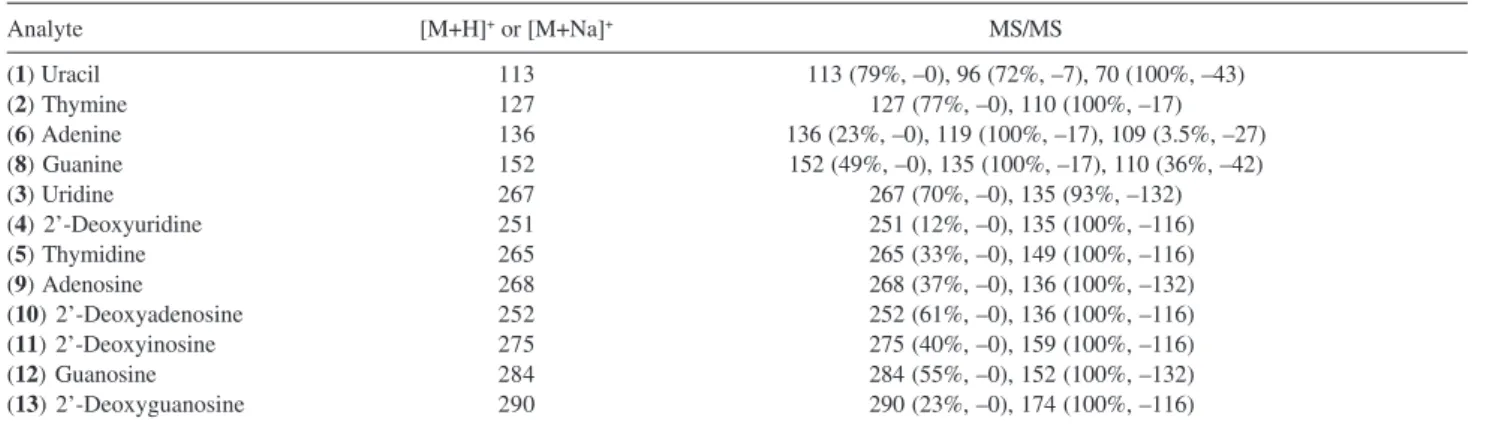
ESI-MS/MS data of the protonated and cationized nucleosides and bases are shown in Table 3. Small neutral losses corresponding to the molecules NH3 (-17), HCN (-27), H2NCN (-42) and HNCO (-43) are the major pathways. The elimination of masses 116 and 132 indicates the presence of deoxyribosyl and ribosyl, respectively, in the molecule. This cleavage, connected with hydrogen transfer, is depicted in Figure 2.
Analysis of the extracts obtained from the ascidians E. vannamei and D. psammatodes by ESI-MS
Figure 3A shows the ESI mass spectrum of the first sample obtained from the extract derived from the ascidian E. vannamei. This sample was prepared by solubilization of the extract in MeOH and cleans up using Sepack-C18. The presence of the nucleoside adenosine (9) was confirmed by the ion of m/z 268 from the [M + H]+ (see Table 4). However, other ions were
present in the mass spectra, and the accuracy mass
indicate the absence of nitrogen on their molecular formula. The addition of MeOH in the extract may have solubilized other constituents less polar than the nucleosides.
In the second, third and fourth sample obtained by solubilization of the extract from E. vannamei in H2O, MeOH/H2O and acetonitrile/H2O, respectively, the nucleosides were not extracted in high amount compared with other compounds (see Figures 3B, 3C and 3D). It is possible that the clean up process of the extract using a Sepack-C18 cartridge is necessary to retain these compounds that are not nucleosides, and also confirm the less polar characteristic of those.
Figure 3E shows the ESI mass spectrum of the fifth sample obtained from the extract of E. vannamei. This sample was prepared by solubilization of the extract in MeOH and cleans up using Sepack - silica followed by elution with MeOH. The nucleosides were not extracted by this method yet. Only the ion of m/z 136 from the [M + H]+ of the adenine base (6) was present in the mass spectra
of this sample obtained from scan mode (see Figure 3E). Maybe the nucleosides, by their polarity (presence of sugar in the molecule), retained in the silica cartridge and the elution with MeOH was not enough to remove them.
The sixth sample was obtained by solubilization of the extract from E. vannamei in EtOAc, elimination of the soluble fraction, solubilization of the residue in MeOH/ H2O 1:1 and clean up using Sepack - silica followed by elution with MeOH/H2O. The presence of the nucleoside adenosine (9), ions of m/z 268 and m/z 290 from the [M + H]+ and [M + Na]+, respectively, was confirmed in the
mass spectra (see Figure 3F). However, other ions were present. The process of extract solubilization in EtOAc was not enough for remove the low polarity impurities that were in the extract as those ions were observed in the mass spectra. In the following stage, the use of MeOH/ H2O 1:1 to dissolve the sample was adequate to get the nucleoside adenosine and the elution with another 1.0 mL
Figure 2. Cleavage of glycosidic C-N bond. N
N
N N
R R
O OH
OH OH
1
2
+ H+or + Na+
---H
Table 2. Sample preparation for identification of nucleosides from ascidian Eudistoma vannamei
Sample Method of preparation
1 addition of MeOH, centrifugation, clean up of supernatant in solid phase extraction using Sepack-C18 cartridge 2 addition of H2O, centrifugation to eliminate the insoluble residue
3 addition of MeOH/H2O 3:7, centrifugation to eliminate the insoluble residue 4 addition of acetonitrile/H2O 2:8, centrifugation to eliminate the insoluble residue
5 addition of MeOH, centrifugation, clean up of supernatant in solid phase extraction using Sepack-silica cartridge, elution with more 1.0 mL of MeOH
6 addition of EtOAc, centrifugation to eliminate the soluble fraction, solubilization of the residue in MeOH/H2O 1:1, centrifugation to eliminate the insoluble fraction, clean up of supernatant in solid phase extraction using Sepack-silica cartridge, elution with more 1.0 mL of MeOH/H2O
et al.
Figure 3. ESI mass spectra in the positive ion mode. (A) Sample 1 of extract from E. vannamei, (B) Sample 2 of extract from E. vannamei, (C) Sample 3 of extract from E. vannamei, (D) Sample 4 of extract from E. vannamei, (E) Sample 5 of extract from E. vannamei, (F) Sample 6 of extract from E. vannamei, (G) Sample 7 of extract from E. vannamei, (H) Sample 7 of extract from D. psammatodes.
118.0860 140.0676 169.0260 203.0524 217.0678 252.1077 284.3289 335.3039 365.1037 393.2956413.2649 441.2961 497.1800 301.1404 268.1029
150 200 250 300 350 400 450 m/z
0.0 0.5 1.0 1.5 2.0 2.5 3.0 Intensity x 10 4 Intensity x 10 4 Intensity x 10 4 Intensity x 10 4 Intensity x 10 4
9[M + H]+
109.9812 123.9959 169.9655 190.1065 203.0194 217.0564 239.0615 261.0932 279.1260 301.1097 162.0821
100 150 200 250 300 m/z
0 1000 2000 3000 4000 Intensity 123.9985 142.9921 169.9679 190.1070 203.0199 217.0507 239.0647 301.1133 162.0810
100 150 200 250 300 350m/z
0 1000 2000 3000 4000 5000 6000 Intensity 136.0613 169.9857 203.0532 217.0685 256.8195 288.2884 301.1412 316.3199 335.2552
150 200 250 300 350m/z
0 1 2 3 4 5
6[M + H]+
109.9820 123.9989 140.0367 169.9609 203.0225 217.0530 239.0613 256.7951 284.3016 301.1118 162.0819 176.0887
100 150 200 250 300 350m/z
0 1000 2000 3000 4000 5000 Intensity 140.0664 169.9857 198.8621 217.0680 274.0887 290.0848 323.8636 350.7421 365.1065 379.1225 268.1032 301.1385 256.8195
100 150 200 250 300 350 m/z
0.0 0.5 1.0
1.5 9[M + H]
+9[M + Na] + 135.0034 176.0684 196.8669 213.9273 234.8269 265.0804 292.7867 314.7814 350.7465 372.7391 397.2380 251.0650
100 150 200 250 300 350 m/z
0.0 0.5 1.0 1.5 2.0 2.5
4[M + Na]+
5[M + Na]+
136.0612 174.0404 239.0896 268.1045 290.0863 301.1416 323.1461 349.1845 252.1101 274.0916 140.0675
150 200 250 300 350 m/z
0 1 2 3 4 5
6[M + H]+
10[M + H]+
9[M + H]+
13[M + Na]+
A) B)
C) D)
E) F)
Figure 4. ESI-MS/MS. (A) ion of m/z 136 ([M + H]+) of adenine from the sample 7 of extract of E. vannamei, (B) ion of m/z 252 ([M + H]+) of 2-deoxyadenosine from the sample 7 of extract of E. vannamei, (C) ion of m/z 268 ([M + H]+) of adenosine from the sample 7 of extract of E. vannamei, (D) ion of m/z 290 ([M + Na]+) of 2'-deoxyguanosine from the sample 7 of extract of E. vannamei, (E) ion of m/z 251 ([M + Na]+) of 2'-deoxyuridine from the obtained sample of extract of D. psammatodes, (F) ion of m/z 265 ([M + Na]+) of thymidine from the obtained sample of extract of D. psammatodes.
67.0304 109.0537
119.0382
136.0652
50 60 70 80 90 100 110 120 130 140 m/z
0.0 0.2 0.4 0.6 0.8 1.0 1.2
Intensity
x
10
4
93.6772 136.0699
160.2976 200.2778
252.1249
25 50 75 100 125 150 175 200 225 250 m/z
0 500 1000 1500 2000
Intensity
98.9897 136.0642
268.1130
75 100 125 150 175 200 225 250 275 m/z
0.0 0.2 0.4 0.6 0.8 1.0
Intensity
x
10
5
174.0403
233.0923
290.0878
100 125 150 175 200 225 250 275 300m/z
0 500 1000 1500 2000 2500
Intensity
117.0594 135.0201
150.9847
251.0719
75 100 125 150 175 200 225 250 m/z
0 1000 2000 3000 4000 5000 6000
Intensity
117.0641 149.0470
183.0275
265.1068
50 75 100 125 150 175 200 225 250 275m/z
0 1000 2000 3000
Intensity
A) B)
C) D)
E) F)
of MeOH/H2O was enough to remove that and other impurities of the silica, as other ions that were not nucleosides were present in the mass spectra.
Figure 3G shows the ESI mass spectrum of the seventh sample obtained by solubilization of the extract from E. vannamei in H2O at 60 ºC, clean up using Sepack-C18 followed by elution with H2O and H2O/MeOH. This method proved to be the best to get the nucleosides and eliminate the impurities. The use of H2O at 60 °C was adequate to solubilize only more polar compounds, like
nucleosides. The elution of the sample with H2O removed impurities like salts, sugars and other compounds of high polarity. Then, the elution with H2O/MeOH 8:2 removed the nucleosides of the C18 cartridge (see Figure 3G). The presence of nucleoside 2’-deoxyadenosine (10) was confirmed by the ion of m/z 252 from the [M + H]+,
adenosine (9) by the ion of m/z 268 from the [M + H]+ and
2’-deoxyguanosine (13)by the ion of m/z 290 from the [M + Na]+ (see Table 4), and the base adenine (6) was
et al.
ESI tandem mass spectrometric experiments of these compounds were also obtained (see Figures 4A, 4B, 4C and 4D) and the losses are showed in Table 3.
With the aim to confirm the efficiency of the method of sample preparation the extract of the ascidian Didemnum psammatodes was submitted to the same technique of the seventh sample. From the previous fractionation and purification of this extract were isolated the nucleosides 2’-deoxyguanosine (13), 2’-deoxyinosine (11), 2’-deoxyuridine (4) and thymidine (5) in small quantities. Figure 3H shows the ESI mass spectrum of the sample obtained from ascidian D. psammatodes. The presence of the nucleoside thymidine (5) was confirmed by the ion of m/z 265 from the [M + Na]+ and
2’-deoxyuridine (4) by the ion of m/z 251 from the [M + Na]+ (see Table 4). The ESI tandem mass spectrometric
experiments of these compounds were also obtained (see Figures 4E and 4F) and the losses are showed in Table 3.
Conclusions
In this paper, we report the development of a simple and rapid technique of sample preparation followed by a direct ESI-MS/MS spectrometric method for characterization of nucleosides and bases from ascidian extracts. Three nucleosides and one base in a methanolic extract from the ascidian E. vannamei and two nucleosides in the methanolic
extract from the ascidian D. psammatodes were identified. The successful determination of the nucleosides in E. vannamei and D. psammatodes shows that MS and ESI-MS/MS can serve as powerful analytical tools for rapid screening of nucleosides in ascidian extracts, avoiding time and material-consuming efforts in chemical characterization of marine organisms.
Acknowledgments
The authors acknowledge FAPESP, CAPES and CNPq (Instituto do Milênio) for financial support and fellowships.
References
1. Coradetti, R.; Lo Conte, G.; Moroni, F.; Passani, M.B.; Pepeu, G.; Eur. J. Pharmacol.1984, 104, 19.
2. Schmidt, C.; Bellingham, M.C.; Richter, D.W.; J. Physiol.1995,
483, 769.
3. Ballarin, M.; Herrera-Marschitz, M.; Cassa, M.; Ungerstedt, U.; Neurosci. Lett.1987, 83, 338.
4. Benowitz, L.I.; Goldberg, D.E.; Irwin, N.; Prog. Brain Res.
2002, 137, 389.
5. Uady, R.; Stringel, G.; Thomas, R.; Quan, R.; J. Pediatr. Gastroenterol. Nutr.1990, 10, 497.
6. Carver, J.D.; J. Nutr. 1994, 129, 144.
7. Bergmann, W.; Feeney, R.J.; J. Am. Chem. Soc. 1950, 72, 2809.
Table 3. Collision-induced dissociation of the molecules of the anaytesa
Analyte [M+H]+ or [M+Na]+ MS/MS
(1) Uracil 113 113 (79%, –0), 96 (72%, –7), 70 (100%, –43)
(2) Thymine 127 127 (77%, –0), 110 (100%, –17)
(6) Adenine 136 136 (23%, –0), 119 (100%, –17), 109 (3.5%, –27)
(8) Guanine 152 152 (49%, –0), 135 (100%, –17), 110 (36%, –42)
(3) Uridine 267 267 (70%, –0), 135 (93%, –132)
(4) 2’-Deoxyuridine 251 0251 (12%, –0), 135 (100%, –116)
(5) Thymidine 265 0265 (33%, –0), 149 (100%, –116)
(9) Adenosine 268 0268 (37%, –0), 136 (100%, –132)
(10) 2’-Deoxyadenosine 252 0252 (61%, –0), 136 (100%, –116)
(11) 2’-Deoxyinosine 275 0275 (40%, –0), 159 (100%, –116)
(12) Guanosine 284 0284 (55%, –0), 152 (100%, –132)
(13) 2’-Deoxyguanosine 290 0290 (23%, –0), 174 (100%, –116)
aNeutral losses leading to the formation of the product ions from [M+H]+ or [M+Na]+ ions are given in parentheses
Table 4. Accurate mass measurements and formula assignments for 4, 6, 9, 10 and 13
Ion Formula Exact mass Actual mass Mass error/(ppm)
[4 + Na]+ C
9H12N2NaO5
+ 251.0643 251.0650 + 2.7
[5 + Na]+ C
10H14N2NaO5
+ 265.0800 265.0804 + 1.5
[6 + H]+ C
5H6N5
+ 136.0617 136.0612 – 3.6
[9 + H]+ C
10H14N5O4
+ 268.1040 268.1045 + 1.8
[10 + H]+ C
10H14N5O3
+ 252.1091 252.1101 + 3.9
[13 + Na]+ C
10H13N5NaO4
8. Demattè, N.; Guerriero, A.; De Clauser, R.; De Stanchina, G.; Lafargue, F.; Cuomo, V.; Pietra, F.; Comp. Biochem. Physiol.
1985, 81B, 479.
9. Kim, J.; Pordesimo, E.O.; Toth, S.I.; Schmitz, F.J.; Altena, I.V.;
J. Nat. Prod.1993, 56, 1813.
10. Mitchell, S.S.; Pomerantz, S.C.; Concepción, G.P.; Ireland, C.M.; J. Nat. Prod.1996, 59, 1000.
11. Schupp, P.; Pochner, T.; Edrada, R.; Ebel, R.; Berg, A.; Wray, V.; Proksch, P.; J. Nat. Prod.2003, 66, 272.
12. Kehraus, S.; Gorzalka, S.; Hallmen, C.; Iqbal, J.; Müller, C.E.; Wright, A.D.; Wiese, M.; König, G.M.; J. Med. Chem.2004,
47, 2243.
13. Usov, A.I.; Slanchev, K.I.; Smirnova, G.P.; Ivanova, A.P.; Stefanov, K.L.; Popov, S.S.; Andreev, S.N.; Russ. J. Bioorg. Chem.2002, 28, 147.
14. Albert, K.; Krucker, M.; Glaser, T.; Schefer, A.; Lienau, A.; Zeeb, D.; Anal. Bioanal. Chem.2002, 372, 25.
15. Pinto, A. C.; Silva, D. H. S.; Bolzani, V. S.; Lopes, N. P.; Epifanio, R. A.; Quim. Nova2002, 25 suppl. 1, 45.
16. Crotti, A.E.M.; Vessecchi, R.L.; Lopes, J.L.C.; Lopes, N.P.;
Quim. Nova2006, 29, 287.
17. Fredenhagen, A.; Derrien, C.; Gassmann, E.; J. Nat. Prod.2005,
68, 385.
18. Maurin, A.J.M.; Iamamoto, Y.; Lopes, N.P.; Lindsay-Smith,
J.R.; Bonato, P.S.; J. Braz. Chem. Soc.2003, 14, 322. 19. Pivatto, M.; Crotti, A.E.M.; Lopes, N.P.; Castro-Gamboa, I.;
De Rezende, A.; Viegas Jr., C.; Young, M.C.M.; Furlan, M.; Bolzani, V.S.; J. Braz. Chem. Soc.2005, 16, 1431.
20. Crotti, A.E.M.; Lopes, J.L.C.; Lopes, N.P.; J. Mass Spectrom.
2005, 40, 1030.
21. Guaratini, T.; Lopes, N.P.; Pinto, E.; Colepicolo, P.; Gates, P.J.;
Chem. Commun.2006, 39, 4110.
22. Fonseca, T.; Lopes, N.P.; Gates, P.J.; Staunton, J.; J. Am. Soc. Mass Spectrom.2004, 15, 325.
23. Lopes, N.P.; Gates, P.J.; Wilkins, J.P.G.; Staunton, J.; Analyst
2002, 127, 1224.
24. Vessecchi, R.L.; Nascimento, P.G.B.D.; Lopes, J.N.C.; Lopes, N.P.; J. Mass Spectrom.2006, 41, 1219.
25. Guaratini, T.; Gates, P.J.; Cardozo, K.H.M.; Campos, P.M.B.G.M.; Colepicolo, P.; Lopes, N.P.; Eur. J. Mass Spectrom.
2006, 12, 71.
26. Lopes, N.P.; Fonseca, T.; Wilkins, J.P.G.; Staunton, J.; Gates, P.J.; Chem. Commun. 2003, 1, 72.
Received: December 7, 2006
Web Release Date: August 20, 2007


![Figure 4. ESI-MS/MS. (A) ion of m/z 136 ([M + H] + ) of adenine from the sample 7 of extract of E](https://thumb-eu.123doks.com/thumbv2/123dok_br/18991996.460972/5.892.123.750.98.817/figure-esi-ms-ms-ion-adenine-sample-extract.webp)