International Journal for Quality research UDK- 658.8.027.5/658.7/.8
Short Scientific Paper (1.03)
Vol.4, No. 1, 2010 51
K.Jeyakumar1) T. Paul Robert2)
1) 1Assistant Professor, Department of Mechanical
Engg., Francis Xavier Engineering College, Tirunelveli – 627 003, India.
2)Professor, Department of Industrial Engineering, Anna
University - Chennai, Chennai – 600 025, India.
jeyakitcha@yahoo.co.in
JOINT DETERMINATION OF PRICE, WARRANTY LENGTH
AND PRODUCTION QUANTITY FOR NEW PRODUCTS
UNDER FREE RENEWAL WARRANTY POLICY
Abstract: An optimal business strategy which integrates the decisions, such as pricing, production quantity, and customer service, in order to maximize profit is vital for any manufacturing industry. Post sale factors like warranty, spare parts availability, maintenance, service and cost play an important role in the sale of a product. As better warranty signals higher product quality which provides greater assurance to customers, warranty is an important factor in marketing new products. In this paper, a decision model with the price, warranty length and production quantity of a product as decision variables to maximize profit based on the pre-determined product life cycle is presented. The study considers free renewal warranty policy for producers in the static sales market. The expected number of renewals based on the warranty length is derived for lognormally distributed products. The effect of model parameters on the profit is studied.
Keywords: Price, Warranty length, Production quantity, Free Renewal Warranty, Profit maximization.
1. INTRODUCTION
Now-a-days consumers make their purchasing decisions in the market on the basis of perceptual product attributes which can be influenced by various factors under the producer’s control, such as product quantity, product price and marketing mix of the product (Wu et al. 2006). Promoting sales volume is always an effective course of increasing profits, which is the major goal for the producers. The producers must determine a reasonable selling price for their products in order to stimulate consumers’ willingness to purchase the product.
Product pricing is a major decision for manufacturers (or sellers) and has become a challenging issue in today’s marketplace, where the conditions change rapidly over time (Raman and Chatterjee 1995). For the same class of products in the market, lower price usually tends to enhance sales volume, but leads to a decrease in the unit profit. Pricing must be based on cost to yield profit; meanwhile, the price of a product should not be too high to dissuade consumers from purchasing. Therefore, producers have to treat product pricing as a competitive tool in their marketing strategy (Yao and Liu 2005).
Consumers are more quality-sensitive today than ever. Consumers are willing to pay a premium for superior quality (Raman and Chatterjee 1995; Padmanabhan 1996). It is strongly believed that provision of warranty has a definite persuasive effect on purchase decision. In addition to price, consumers may predict the quality of a product based on its warranty, which is considered as the assurance that the producer
provides after evaluating the strength of products (Chih-Chiang and Yeu-Shiang 2008; Jeyakumar and Robert 2009). Warranty is an important element of marketing new products, as better warranty signals higher product quality and provides greater assurance to customer. In the purchase decision of a product, buyers typically compare characteristics of comparable model of competing brands.
When competing brands are nearly identical, it is very difficult in many instances to choose a particular product solely on the basis of the product related characteristics such as product price, special features, perceived product quality and reliability, financing offered by the manufacturer and so on. In such situations, post-sale factors like warranty, parts availability and cost, service, maintenance, and so forth take on added importance in product choice (Lele and Karmarkar 1983).
Of these, warranty is one that is known (or at least potentially known) to the buyer at the time of purchase. Besides being a protection mechanism for customers, product warranty increasingly serves as a marketing tool to differentiate from competitors for durable products like automobiles and high-tech goods (DeCroix 1999). It is therefore the endeavor of every producer to design an attractive warranty for higher sales so as to maximize profit.
The machine production quantity may be easily adjusted to satisfy the market demand. That is, different levels of demand can be satisfied with appropriate production quantity.
This implies that production quantity is very
important from the producer’s point of view. Figure 1 shows the relationship among price, warranty, product demand and sale of the product towards the influence of attaining total profit (Chih-Chiang and Yeu-Shiang 2008).
Fig.1 Influence Diagram of Price, Warranty and Production to Profit.
2. CONCEPT OF WARRANTY
Warranty is a contractual agreement incurred by a manufacturer (vendor or seller) in connection with the sale of a product. Warranties are an integral part of nearly all commercial and many government transactions that involve product purchases.
The buyer individual, corporation, or government agency) point of view of a warranty is different from that of the manufacturer (or distributor, retailer, and so forth).
2.1 Buyers point of view
From the buyer’s point of view, the main role of a warranty in these transactions is protectional – it provides a means of redress if the item, when properly used, fails to perform as intended or as specified by the seller (Murthy et al. 2004).
Specifically, the warranty assures the buyer that a faulty item will either be repaired or replaced at no cost or at reduced cost. A second role is informational. Many buyers infer that a product with a relatively longer warranty period is more reliable and long lasting than one with a shorter warranty period.
2.2 Manufactures Point of view
One of the main roles of warranty from the manufacturer’s point of view is also protectional. The
manufacturer may be provided further protection by specification of requirements for care and maintenance of the product.
A second important purpose of warranties for the manufacturer is promotional. Since buyers often infer a more reliable product when a long warranty is offered, this has been used as an effective advertising tool.
This is often particularly important when marketing new and innovative products, which may be viewed with a degree of uncertainty.
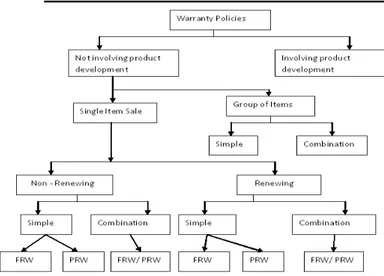
2.3 Classification of Warranty policies
The Taxonomy of warranty policies is given in Figure 2. The warranty policies can be divided into two groups based on whether or not a policy involves product development after sale.
Fig. 2 Taxonomy of Warranty Policies.
Thus for renewing policies, the warranty period begins new with each replacement, while for non-renewing policies, the replacement item assumes the remaining time of the item it replaced. A further subdivision comes about in that warranties may be classified as 'simple' or 'combination'. The simple policies are Free Replacement Warranty policies (FRW) and Pro-Rata Warranty policies (PRW). A combination policy is a simple policy combined with some additional features or a policy which combines FRW and PRW (Murthy and Djamaludin 2002). In FRW policy the manufacturer agrees to repair or provide replacements for failed items free of charge up to a warranty length ‘t’ from the time of the initial purchase. The failed products are renewed before the end of warranty length at no cost to consumers. FRW is widely applied for consumer products (such as automobiles, refrigerators, TVs, electronic components) and industrial/ commercial products (such as pumps, trucks, office equipment. In PRW policy the manufacturer agrees to refund a fraction of the purchase price when the item fail before warranty length ‘t’ from the time of the initial purchase and the buyer is not constrained to buy a replacement item. The refund depends on the age of the item at failure and it can be either linear or a nonlinear function of the time remaining in the original warranty period. Under combined FRW and PRW policy, the manufacturer agrees to provide a replacement or repair free of charge up to time ‘t1’ from the initial purchase and any failure in the interval ‘t1 to t (t > tl) results in a pro-rated refund. The warranty does not renew (Murthy et. al., 2004).
3.
BACKGROUND
Warranty is an important factor of marketing products because better warranty products usually signal
the higher product quality and provide greater assurance to buyers. Glickman and Berger (1976) proposed an early model for this important research area. The model assumed homogeneous customers, with their demand determined by an exponential function of price and warranty length. The optimal price and warranty length were obtained by maximizing the manufacturer’s profit function. The expected sales volume, or demand, is represented by a displaced log-linear function of the form q (p,w) = k1 p -a (w+k2). A model to jointly determine the price, warranty length, and product reliability to maximize the total expected profit of a new product for a manufacturer is proposed (Murthy 1990). A methodology to aid the manufacturer in selecting the price and warranty time of its products. The model considers the case where the products are assumed to be complements of each other. A multi-objective model is formulated where it is assumed that the decision maker is able to prioritize his goals. A goal programming approach is used and the effects of the chosen parameters on the optimal solution (Patnakar 1990). Menezes and Currim (1992) considered the optimal price and warranty length for particular classes of failure rate, demand, and competitor-response functions.
Mitra and Patankar (1997) investigated the selection of product price, total warranty length, and initial warranty length for warranty programs involving options for extended warranty periods. DeCroix (1999) considered an oligopoly market and proposed a game-theoretic model for determining the optimal product price, reliability, and warranty length. Since then there has been an increased research attention on the joint determination of optimal product pricing and warranty policy. Optimal strategies that link engineering issues (such as reliability improvement through redundancy and development, maintenance, testing policies, burn-in, etc.) with warranty to either maximize the manufacturers’ profit or minimize the total cost have been reported in the literature (Nat and Frank 2000; Wu et al. 2006). Ruey Sheng-TsaingTseng (2000) considered the optimal production length for deteriorating production system in which the products are sold with free minimal repair warranty. The deteriorate process of system is characterized by a two state continuous time markov chain. Pal and Manna (2003) deals with a marketing decision problem in the classical single period stochastic inventory model, where the level of marketing effort decides on the extent of demand. Especially it is assumed that demand is an increasing concave function of the level of marketing effort. However, warranty always involves additional costs to the seller and these costs depend on the product reliability (Noll 2004). Lin and Shue (2005); Wu et al. (2006); Huang et al. (2007) extended the model proposed by Teng and Thompson (1996). Warranty length is considered instead of quality, assuming that the demand is determined by product price and warranty length. Optimal paths of price and warranty length of free replacement policy are derived in a pre-determined life cycle of the product. There has been an increased research attention on warranty models. Chun and Tang (1995) reported that the issue of warranty (both compensation and length) gets fixed by government regulation or competitor's warranty terms, and consumers are confident enough to make stipulations on the product quality and reliability. The problem of warranty price determination to maximize producer's profit when consumers are permitted to purchase product with or without warranty is addressed. The optimal warranty length in order to maximize producer's utility, a function of economic benefit, warranty servicing cost, and cost of customer dissatisfaction connected to warranty failure (Gutierrez and Aguirre 2006). Ladany and Shore (2007) considered the problem of profit maximization to determine the optimal warranty length by using the response modeling methodology, assuming that the demand follows a Cobb – Douglas type function. Market dynamics has also been incorporated into the pricing and warranty decisions. Manna (2008) considered the joint determination of product price and warranty length to maximize the profit of manufacturer and analyzed the
decision model of Glickman and Berger with power law failure process in the case of one-dimensional warranty and proposed a methodology to extend the model for two-dimensional warranty. Profit maximization problems with price and warranty length under Free Replacement policy have been reported in the literature (Wu et al. 2006; Huang et al. 2007; Manna 2008). However, the production quantity as a decision variable in the profit maximization models and the influence of salvage price for the saturated demand product are scarcely reported in the literature. The profit maximization model proposed in this study considers price, warranty length and production quantity as the decision variables to maximize the overall profit.
4.
PROBLEM FORMULATION
The profit maximization model consider price, warranty length and product quantity as the decision variables that are to be determined to maximize the overall profit. Models presented by Glickman and Berger (1976) and Teng and Thomson (1996) were referred in investigating the maximum market value of products. Thus, in particular, utilize the Log Normal Distribution, because it is one of the most widely used lifetime distribution. Thus demand function as being related to, not only price and warranty, but also quantity to be produced. Total expected Profit, π, as a function of the unit price (p), quantity (q) and the length of the warranty period (t), may be expressed by multiplying the expected profit derived from the sales of each unit by number of units sold. The expression for unit profit will be formulated in a general fashion as an expectation in order for the model to be applicable to products requiring random, possibly multiple repairs under warranty, where the cost per repair is constant. A numerical illustration is provided to show the theoretical prediction and applicability of the decision model. The Free Renewal Warranty policy under static sales market is considered in the study. Under this policy, the seller agrees to repair or provide replacements of failed items free of charge up to a time‘t’from the time of the initial purchase. The static demand market characterizes the market that word of mouth is not important and represents the case that demand function exhibits no learning or saturation. The static market is for non-durable products where diffusion effect is not important e.g. inexpensive products. The impact of the cumulative production volume, scrap volume and market effects on the optimal solution of the price, warranty length and production quantity is studied.
a. Assumptions made
¾ Units sold on salvage price are covered by warranty for a period of length.
¾ Demand does not vary with respect to cumulative sales volume.
¾ The demand of the product follows log normal distribution.
¾ Unit salvage price will be less than unit selling price but always greater than unit manufacturing cost.
¾ Failure times of the product follow exponential distribution.
b. Notations
p - Unit selling price in rupees t - Warranty length in months q - Quantity produced C - Unit manufacturing cost w - Warranty repair cost per failure
– Failure rate of the product
ρ(t) - Expected number of warranty failures per unit =( t)β
β – Shape parameter x - Quantity of demand
fx (.) – Probability density function of x
υ - Unit salvage price
Π - Profit in Rupees
a - Price elasticity of the product
b - Warranty length elasticity of the product Total expected Profit (π), as a function of the unit price (p), quantity (q), and the length of the warranty period (t), may be expressed by multiplying the expected profit derived from the sales of each unit by number of units sold.
When the quantity of demand, X = x, the total profit considering price, warranty length and production quantity with respect to demand ‘x’ is expressed as
Π (p, t, q / x) =
⎪⎩ ⎪ ⎨ ⎧
≥q x if twq -Cq px
q < x if twq -Cq -x) -(q + px
λ λ
ν
--- (1)
Then the expected total profit can be computed as
Π (p, t, q) =
∫
∞
0
π
( p, t, q /x) fx (x) dx=
∫
q
0
[ px + υ (q –x) – Cq -
λ
twq] fx (x) dx +∫
∞
q
[
pq – Cq -
λ
twq] fx (x) dx =∫
q
0
(p- υ)xfx (x) dx + (υ – C -
λ
tw) q∫
q
0
fx (x) dx
+ ( p – C -
λ
tw)q∫
∞
q
fx (x) dx
= (p- υ)
∫
q
0
x fx (x) dx + (υ – C -
λ
tw) q∫
q
0
fx (x)
dx + ( p – C -
λ
tw)q∫
∞
q
fx (x) dx
The derivation of the profit function is given in the Appendix A and Appendix B
Π= ( p-υ) (e+σ2/2 Ф[(lnq – – σ2)/σ]) + (υ – C – tw ) q
Ф (lnq – )/σ) + ( p – C – tw ) q - (p – C – tw ) q Ф (lnq – )/σ)
Π= (p - υ) e+σ2/2 Ф[(lnq – – σ2)/σ] + (υ – C – tw ) q
Ф[(lnq – – σ2)/σ] + (p – C – tw) q [1- Ф (lnq – )/σ] ---- (2)
The objective function considered in this profit maximization problem is as follows
Expected Profit (Π) = ( p – C – tw ) q + ( p-υ) [e+σ2/2
Ф[(lnq – – σ2)/σ] – q Ф (lnq – )/σ) ] ---- (3)
5.
NUMERICAL ILLUSTRATION
The Free replacement policy is considered by warranty service because the FRW is the economic policy and mostly used by many producers.
The model parameters under study include the price elasticity (a), the warranty length elasticity (b) and the unit cost of the product (C). In this study , =1.5 per year, the price elasticity value ranging from 0.25 to -2.5, the warranty period elasticity value ranging from 0.1 to 0.9 and warranty period between 6 to 24 months ( Wu (2006); Manna (2008)) are considered.
The effect of model parameters for the various price elasticity and warranty period elasticity has been summarized in the Table i. The cell value in the Table i represents the profit in rupees.
Table 1 Sensitivity Analysis for Static Demand Market The profit value obtained for p = 5, t=12, q= 100
b a
0.15 0.25 0.35 0.50 0.90
0 124.03 125.23 126.79 130.05 148.88
-0.10 123.42 124.44 125.76 128.53 144.46
-0.25 122.68 123.47 124.50 126.67 139.07
-0.30 122.47 123.20 124.15 126.14 137.56
-0.86 121.00 121.29 121.67 122.44 126.97
-0.87 220.00 121.27 121.64 122.42 126.86
-1.00 220.00 121.03 121.33 121.96 125.54
-1.05 220.00 220.00 121.23 121.81 125.11
-1.10 220.00 220.00 121.13 121.67 124.71
-1.25 220.00 220.00 220.00 121.31 123.68
-1.40 220.00 220.00 220.00 121.02 122.88
-1.45 220.00 220.00 220.00 220.00 122.66
-1.50 220.00 220.00 220.00 220.00 122.45
-1.90 220.00 220.00 220.00 220.00 121.28
-2.00 220.00 220.00 220.00 220.00 121.09
-2.10 220.00 220.00 220.00 220.00 220.00
-2.50 220.00 220.00 220.00 220.00 220.00
profit increases as well and if the warranty length is increased with increase in production quantity there increase in profit, but which is less than for the fixed warranty length.
An analysis is employed to show how the optimal price, warranty length, production quantity and salvage price on a very limited scale for the parameter of elasticity ‘a’ and ‘b’. By substituting the values in the Equation 3 the values in the Table i is obtained. The observation is summarized as below.
(i) An increase in price elasticity leads to a declining profit, however price can be declining or unchanged, warranty length can be increasing or unchanged and product quantity can be changed. An increase in warranty length elasticity leads to an increase in profit.
(ii) The figure 3 shows the effect of warranty length to profit.
Fig. 3 Effect of Warranty Length to Profit
From the Figure 3, it is inferred that increase in warranty length leads to reduction in profit for higher price elasticity with constant warranty period elasticity and production quantity.
(iii) Figure iv shows the effect of warranty period elasticity to profit.
Fig. 4 Effect of Warranty period Elasticity to Profit
In Figure 4, with lower price elasticity and with change in warranty period elasticity and product quantity changed or unchanged will leads to a constant profit, but at the same time change in profit for changed or unchanged production quantity with higher price elasticity.
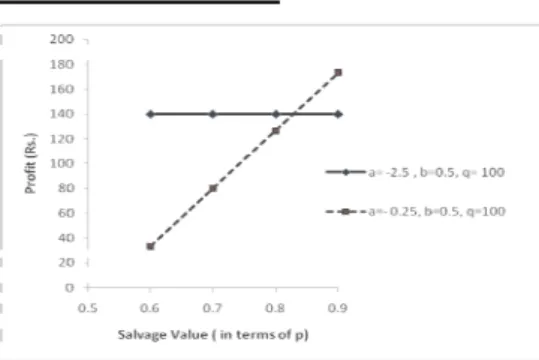
(iv) Figure 5 shows the effect of salvage value to profit.
Fig. 5 Effect of Salvage value to Profit
From figure v, it is observed that higher price elasticity and with constant warranty period elasticity, decrease in salvage value leads to decrease in profit, but at the same time for the lower price elasticity change in salvage value will won’t affect the profit.
6.
CONCLUSION
In this paper a decision model which integrates marketing, quality and production is presented. The problem of joint determination of the optimal selling price of a product is studied. Optimal warranty period and the production quantity offered at no extra charge with the product as an incentive to the customer. The expected demand in the proposed model has taken to be a displaced log-linear function of price, length of protection period, production quantity and expected time between break down was written as general function of the length of the protection period. An numerical example to highlight the application of the model is given. Analysis is then employed to show changes in the composition of the optimum follow from variation in the various parameters of the model. The model has generated some very interesting empirical insights. In many cases it is found that this model performs better when the decision model is implemented. The product quantity that is showed as an important element, may well impact the sales uncertainty associated with product and influence consumer choices.
APPENDIX A
I1 =
x
dx
q
x
f
(
)
0∫
= dx x q x ⎥ ⎥ ⎦ ⎤ ⎢ ⎢ ⎣ ⎡ ⎟ ⎠ ⎞ ⎜ ⎝ ⎛ − − Π∫
2 0 ln 2 1 exp 2 1 σ μ σSince x < q, u =
σ
μ
− x ln u e x u x u x σ μ σ μ σ μ + = + = = − ln ln ue
dx
=
μ+σ .σ
du
=du e e e u u q
u π σ
σ σ μ σ μ σ μ . 2 . . 1 . 2 ln 2 + − − ∞ −
∫
+=
e
du
u q
.
2
1
. 2 ln 2 − − ∞ −∫
σ μπ
=⎟
⎠
⎞
⎜
⎝
⎛
−
Φ
σ
μ
q
ln
I1 + I2 = f
( )
xdx f( )
xdxq x q x
∫
∫
+∞ 0 =( )
x
dx
f
( )
x
f
x1
,
x 0=
∫
∞
is p,d,f and 0 < x < ∞ I2 =1 - I1 = ⎟
⎠ ⎞ ⎜ ⎝ ⎛ − Φ −
σ
μ
q ln 1 APPENDIX B dx x q xxf
( )0
∫
= dx x x q x ⎥ ⎥ ⎦ ⎤ ⎢ ⎢ ⎣ ⎡ ⎟ ⎠ ⎞ ⎜ ⎝ ⎛ − − Π∫
2 0 ln 2 1 exp 2 1 σ μ σNote: u =
σ
μ
− x ln ue
x
=
μ+σdu
e
dx
=
μ+σu.
σ
= e e u duu q
σ
π
σ
σ μ σ μ . 2 . 1 . 2 ln 2 + − − ∞ −∫
=du
e
e
u u q.
2
.
1
. 2 ln 2 σ σ μ μπ
σ
+ − − ∞ −∫
Note: u σu
[
u 2σu]
2 1 2 2 2 − − = + −=
[
2 2 2]
2
2
1
−
σ
+
σ
−
σ
−
u
u
=
[
(
)
2 2]
2
1 −σ −σ
−
u
=
(
)
2 2
1 −
σ
2+σ
2− u ( ) du e e u q . 2
1 21 2
ln 2 2 σ σ σ μ μ
π
+ − − − ∞ −∫
Note: s = u –σ ds = du
= ds e e s u q u . . 2 1 2 . ln 2 2
2 − −
− ∞ − +
∫
σ σ σ π = ⎟ ⎠ ⎞ ⎜ ⎝ ⎛ − − Φ + σ σ μ σ μ qe 2 ln
2
REFERENCES:
[1] Blischke, W.R., Murthy, D.N.P., (1992). Product warranty management – I: A taxonomy for warranty policies. European Journal of Operational Research, 62, 127–148.
[2] Chih-Chiang Fang., Yeu-Shiang Huang., (2008). A Bayesian decision analysis in determining the optimal policy for pricing, production, and warranty of repairable products. Expert Systems with Applications, 35, 1858–1872.
[3] Chun, Y.H., Tang, K., (1995). Determining the optimal warranty price based on the producer’s and customers’ risk preferences. European Journal of Operational Research, 85, 97–110.
[4] DeCroix, G.A., (1999). Optimal warranties, reliabilities and prices for durable goods in an oligopoly. European Journal of Operational Research, 112, 554–569.
[5] Giri, BC., Yun, WY., Dohi, T., (2005). Optimal design of unreliable production-inventory systems with variable production rate. European Journal of Operational Research, 162, 372–386.
[7] Gutierrez Pulido H., Aguirre-Torres V. and Christen J.A., (2006). A Bayesian Approach for the Determination of Warranty Length. Journal of Quality Technology, 38(2), 180-189.
[8] Huang, H.Z., Liu, Z.J., Murthy, D.N.P., (2007). Optimal reliability, warranty and price for new products. IIE Transactions, 39, 819–827.
[9] Jeyakumar, K., Paul Robert, T., (2009). Experimental analysis on interrelating quality and warranty towards new product promotion. Journal of Manufacturing Engineering, 4(2), 119-125.
[10]Ladany, S.P., Shore, H., (2007). Profit maximizing warranty period with sales expressed by a demand function. Quality and Reliability Engineering International, 23, 291–301.
[11]Lee, W., (2005). A joint economic lot size model for raw material ordering, manufacturing setup, and finished goods delivering. Omega—The International Journal of Management Science, 33, 163–174. [12] Lele M.M, Karmarkar U.S. (1983): “Good product support is smart marketing”, Harvard Business
Review,Vol. 61 ,pp. 124–132.
[13]Lin, P.C., Shue, L.Y., (2005). Application of optimal control theory to product pricing and warranty with free replacement under the influence of basic lifetime distributions. Computers and Industrial Engineering, 48, 69–82.
[14]Manna, D.K., (2008). Price - warranty length decision with Glickman-Berger model. International Journal of Reliability and Safety, 2(3), 221-233.
[15]Menezes, M.A.J., Currim, I.S., (1992). An approach for determination of warranty length. International Journal of Research in Marketing, 9, 177–195.
[16]Mesak, H.I., (1996). Modeling monopolist pricing and protection period decisions for new products under warranty. Optimal Control Applications and Methods, 17, 231–252.
[17]Mitra, A., Patanakar, J.G., (1990). A Multi objective model for warranty estimation. European Journal of Operational Research, 45, 347 – 355.
[18]Mitra, A., Patankar, J.G., (1997). Market share and warranty costs for renewable warranty programs. International Journal of Production Economics, 50, 155– 168.
[19]Murthy, D.N.P., (1990). Optimal reliability choice in product design. Engineering Optimization, 15, 281–294.
[20]Murthy, D.N.P., Djamaludin, I., (2002). New product warranty: A literature review. International Journal of Production Economics, 79, 231–260.
[21]Murthy, D.N.P., Solem, O., Roren, T., (2004). Product warranty logistics: Issues and challenges. European Journal of Operationa Research, 156, 110-126.
[22]Nat Jack., Frank V.D. Schouten., (2000). Optimal repair - replace strategies for a warranted product. International Journal of Production Economics, 67, 95 - 100.
[23]Noll, J., (2004). Comparing quality signals as a tool of consumer protection; as warranty always better than advertisements to promote higher product quality? International Review of Law and Economics, 24, 227 – 239.
[24]Padmanabhan, V., (1996). Marketing and Warranty. In Blischke W.R. and Murthy D.N.P. (Ed.), Product Warranty Handbook, (pp 393 - 407). New York: Marcel Dekker.
[25]Polatoglu, H., Sahin, I., (1998). Probability distributions of cost, revenue and profit over a warranty cycle. European Journal of Operational Research, 108, 170–183.
[26]Raman, K., Chatterjee, R., (1995). Optimal monopolist pricing under demand uncertainty in dynamic markets. Management Science, 41 (1), 144–162.
[27]Teng, J.T., Thompson, G.L., (1996). Optimal strategies for general price—Quality decision models of new products with learning production costs. European Journal of Operational Research, 93, 476–489. [28]Wu, C.C., Lin, P.C., Chou, C.Y., (2006). Determination of price and warranty length for a normal
lifetime distributed product. International Journal of Production Economics, 102, 95–107.
[29]Yao, DQ., Liu, JJ., (2005). Competitive pricing of mixed retail and e-tail distribution channels. Omega — The International Journal of Management Science, 33, 235–247