INTEGRATED ECOLOGICAL-ECONOMIC
MODELLING AND ASSESSMENT APPROACH FOR
COASTAL ECOSYSTEM MANAGEMENT
Thesis submitted to the Faculty of Sciences and Technology, New University of Lisbon, for the degree of Doctor of Philosophy in Environmental Sciences.
Dissertação apresentada para obtenção do Grau de
Doutor em Ciências do Ambiente, pela Universidade
Nova de Lisboa, Faculdade de Ciências e Tecnologia.
LISBOA
I am grateful to all the people that direct and indirectly contributed to this work:
I am particularly thankful to my supervisor, J.G. Ferreira for guidance and support; above all, I cannot express my gratitude for his mentoring since early stage of my work at his research group.
To João Nunes, for being always a step ahead, sharing his experience and critical opinion; and most of all for initiating me into the research work.
Suzanne Bricker, for being so supportive of my ideas, for manuscript revision; and specially for inspiring me about what an assessment methodology should be.
To the SPEAR team, for the collaboration and integrated modelling work. In particular, I thank to Josephine K. Musango and Martin de Wit, for collaboration, insights and valuable comments on the economics of aquaculture.
I am grateful to Amir Neori and Deborah Robertson-Andersson, for being so receptive about developing the integrative work for quantifying an ecologically balanced view of mariculture and for collaboration to further develop the case study. Additionally, I thank Amir Neori for discussions and for valuable comments that improved the work presented in this thesis. To Lia Vasconcelos and her discussion group for participation in their multidisciplinary sessions and for the valuable comments they provided about key presentations of my work in particular the preparation of my defence.
To Robert Grove for valuable information about kelp restoration project.
I thank all manuscript co-authors for contributing to the work that is presented herein. I am also thankful to the anonymous reviewers and Gavin Maneveldt for valuable comments that considerably improved the manuscripts which are part of this thesis.
To colleagues and friends from FCT especially for the healthy day-to-day companionship over the years: Jota, Andrea, Changbo, Teresa, Micas, Camille, Yongjin, Grosso, Norma, Lourenço, Sol, Pacheco, Akli and Maria João.
To Filomena Gomes for the kind support on the administrative issues.
The coastal ecosystem modelling work presented in this thesis was developed in the context of the European Union, Sixth Framework Programme FP6-2002-INCO-DEV-1 SPEAR (INCO-CT-2004-510706) project, which provided the means, such as data and modelling tools, for developing the integrated model.
Over the past few decades, policy-makers have defined new instruments to address coastal ecosystem degradation. Emerging coastal management frameworks highlight the use of the best available knowledge about the ecosystem to manage coastal resources and maintain ecosystem’s services. Progress is required, however, in translating data into useful knowledge for environmental problem solving. This thesis aims to contribute to research assessing changes in coastal ecosystems and benefits generated due to management actions (or to the lack thereof). The overall objectives are to assess the ecological and economic impacts of existing management programmes, as well as future response scenarios and to translate the outcomes into useful information for managers.
To address these objectives, three different approaches were developed:
A multilayered ecosystem model
A multilayered ecosystem model was developed to simulate management scenarios that account for the cumulative impacts of multiple uses of coastal zones. This modelling field is still at an early stage of development and is crucial, for instance, to simulate the impacts of aquaculture activities on the ecosystem, accounting for multiple farms and their interactions with other coastal activities. The multilayered ecosystem model is applied in this thesis to test scenarios designed to improve water quality and manage aquaculture.
An ecological-economic assessment methodology (∆DPSIR approach)
The Differential Drivers-Pressure-State-Impact-Response (∆DPSIR) approach further develops the integrated approach by providing an explicit link between ecological and
economic information related to the use and management of coastal ecosystems. Furthermore, the ∆DPSIR approach provides a framework to synthesise scientific data into useful
A dynamic ecological-economic model (MARKET model)
One of the missing links in ecosystem modelling is with economics. The MARKET model was developed to simulate the feedbacks between the ecological-economic components of aquaculture production. This model was applied to simulate shellfish production in a given ecosystem under different assumptions for price and income growth rates and the maximum available area for cultivation. Further application of the MARKET model at a wider scale might be useful for understanding the ecological and economic limitations on global aquaculture production.
This integrated ecological-economic modelling and assessment approach can be further applied to address new coastal management issues, such as coastal vulnerability to natural catastrophes. It can also support implementation of current legislation and policies, such as the EU Integrated Coastal Zone Management recommendation or the development of River Basin Management Plans following the EU Water Framework Directive requirements. On the other hand, the approach can address recurring coastal management needs, such as the
Ao longo das últimas décadas, os decisores políticos têm definido novos instrumentos para combater a degradação dos ecossistemas costeiros. Abordagens emergentes de gestão de ecossistemas costeiros salientam o uso do melhor conhecimento disponível sobre o ecossistema para a gestão dos recursos costeiros. Desenvolvimentos são necessários para sintetizar dados em informação relevante para a resolução de problemas ambientais. Esta tese visa contribuir para a investigação sobre a avaliação de alterações nos ecossistemas costeiros e nos benefícios que estes geram devido a medidas de gestão (ou a falta delas). Os objectivos gerais são avaliar os impactes ecológicos e económicos de medidas de gestão adoptadas anteriormente, bem como, de cenários de resposta; e traduzir os resultados em informações úteis para os gestores.
Para atingir os objectivos definidos foram desenvolvidas três metodologias:
Um modelo de ecossistema multicamadas
O modelo de ecossistema multicamadas é desenvolvido para simular cenários de gestão que integram os impactes cumulativos dos múltiplos usos das zonas costeiras. Esta é uma área da modelação do ecossistema ainda numa fase inicial de desenvolvimento e crucial para, por exemplo, simular os impactos das actividades aquícolas no ecossistema de forma a incluir a interacção entre diversas unidades de produção e com outras actividades costeiras. O modelo de ecossistema multicamadas é aplicado para testar cenários concebidos para melhorar a qualidade da água e gestão da aquacultura.
Uma metodologia de avaliação ecológica-económica (∆DPSIR)
A metodologia ‘Differential Drivers-Pressure-State-Impact-Response’ (∆DPSIR) adiciona uma vantagem à abordagem integrada através da ligação explícita entre informação ecológica e económica relacionada com o uso e gestão de sistemas costeiros. Adicionalmente, o
ecossistema para a aquacultura.
Um modelo ecológico-económico dinâmico (MARKET)
Uma das limitações dos modelos de ecossistema é a ligação com a economia. O modelo MARKET foi desenvolvido para simular o feedback entre as componentes ecológica e económica da produção aquícola. Foi aplicado para simular a produção de bivalves num determinado ecossistema, considerando diferentes pressupostos para as taxas de crescimento de preço e de salários, e para a área máxima disponível para o cultivo. A aplicação do modelo MARKET à escala mais ampla pode ser útil para compreender as limitações ecológicas e económicas da produção de aquacultura a nível mundial.
Esta abordagem integrada ecológico-económica de modelação e avaliação pode ser utilizada para responder a novas questões de gestão das zonas costeiras; tais como a vulnerabilidade a catástrofes naturais. Pode também ser usada para a implementação de legislação e políticas, tais como a recomendação Europeia sobre a Gestão Integrada das Zonas Costeira, ou o
desenvolvimento dos Planos de Gestão de Bacia Hidrográfica conforme indicado na Directiva Quadro da Água. Por outro lado, a abordagem desenvolvida pode também responder a
∆DPSIR, Differential Drivers-Pressures-State-Impact-Response
ASSETS, Assessment of Estuarine Trophic Status model
BOD5, Five-day biochemical oxygen demand
Chl-a, Chlorophyll-a
CZM, Coastal Zone Management
DIN, Dissolved Inorganic Nitrogen
DO, Dissolved oxygen
DPSIR, Drivers-Pressures-State-Impact-Response
DSS, Decision Support Systems
EAA, Ecosystem Approach to Aquaculture
EBM, ecosystem-based management
EC, Eutrophic Condition index of the ASSETS model
EU, European Union
EBM, Ecosystem-Based Management
FO, Future Outlook index of the ASSETS model
GES, Good Environmental Status
GHG, Greenhouse gas
GIS, Geographic Information System
GNP, Gross National Product
GPP, Gross Primary Production
HAB, Harmful algal bloom
ICM, Integrated Coastal Management
ICZM, Integrated Coastal Zone Management
IEA, Integrated Environmental Assessment
IF, Influencing Factors index of the ASSETS model
IMF, International Monetary Fund
IMTA, Integrated Multi-Trophic Aquaculture
LCA, Life-Cycle Assessment
MARKET, Modeling Approach to Resource economics decision-maKing in EcoaquaculTure
MSFD, Marine Strategy Framework Directive
N, Nitrogen
NEEA, USA National Estuarine Eutrophication Assessment
NEP, USA National Estuary Program
NPP, Net Primary Production
PEV, Partial Ecosystem Value
POM, Particulate Organic Matter
PPP, Purchasing Power Parity
RS, Remote Sensing
SAV, Submerged Aquatic Vegetation
SCI, Science Citation Index
SPM, Suspended Particulate Matter
SWAT, Soil and Water Assessment Tool model
TEV, Total Economic Value
TFW, Total Fresh Weight
USA, United States of America
USD, U.S. dollar
UWWTD, Urban Waste Water Treatment Directive
WFD, European Water Framework Directive
WWTP, Wastewater treatment plant
Symbols
∆
DPSIR – economic quantification
VDrivers, Value of the drivers
VDriversEcosyst, Value of the drivers in the coastal ecosystem
VDriversExternal, economic value of the activities both in the catchment
VEcosystem, Value of the ecosystem
VImpact, Value of the impact on the ecosystem
VManagement, Economic value of management
VResponse, Value of the response
VDirectUse, Direct use value of the ecosystem
VIndirectUse, Indirect use value of the ecosystem
VNonUse, Non-use value of the ecosystem
VExternalities, Value of the environmental externalities
Simple nutrient mass balance model
Fsea, nutrient source - nutrients from seawater
Falgae, nutrient sink - nutrient sinks include seaweed nutrient uptake
Feffluent, nutrient sink - nutrient discharge to the sea
ruptake, nutrient uptake rate
Frecirculation, is the nutrient mass in seaweed effluents that re-enters into the system
Fabalone2algae, is the nutrient mass outflow from the abalone tanks to the seaweed ponds.
euptake, is the seaweed nutrient removal efficiency (%) that corresponds to the proportion of
nutrients removed relative to the available nutrients
MARKET model
SimP, Simulation period
ts, Simulation timestep
tsecol, Ecological timestep
tsecon, Economic timestep
Ecological system
µ, Mortality rate
A, Cultivation area
G, Annual growth rate
g, Scope for growth
HB, Harvestable biomass
MaxA, Maximum cultivation area
N, Number of individuals
nseed, Seeding density
s, Weight class
sp, Seeding period
tp, Cultivation cycle
w, Ecosystem model seed weight
Economic system
DK, Depreciation of capital
DQ, Desired production
FC, Fixed costs
IKL, Interest on capital loan
K, Capital
L, Labour
LD, Local demand
MC, Marginal costs
MR, Marginal revenue
NP, Net profit
P, Price
Q, Shellfish production
TCQ, Total cost of shellfish production
TCQ+1, Total cost of producing one more unit
UVCL Unit labour cost
VC, Variable costs
VCL, Labour costs
VCM, Maintenance costs
VCO, Other variable costs
df, Depreciation fraction
dp, Depreciation period
ed, Price elasticity of demand
ey, Income elasticity of demand
mf, Maintenance Fraction
r, Interest rate
RCQ, Desired change in production
rd, Demand growth rate
RK, Changes in labour inputs
RL, Changes in labour inputs
rcq, annual change rate in production
rp, Price growth rate
ry, Per capita income growth rate
αK, Elasticity of capital
Part of the work presented in this dissertation was previously published/submitted as articles in peer-reviewed International journals:
Nobre, A., 2009. An ecological and economic assessment methodology for coastal ecosystem management. Environmental Management, 44(1): 185-204.
Nobre, A.M., Ferreira, J.G., 2009. Integration of ecosystem-based tools to support coastal zone management. Journal of Coastal Research, SI 56: 1676-1680.
Nobre, A.M., Musango, J.K., de Wit M.P., Ferreira, J.G. 2009. A dynamic ecological-economic modeling approach for aquaculture management. Ecological Economics, 68(12): 3007-3017.
Nobre, A.M., Ferreira, J.G., Nunes, J.P., Yan, X., Bricker, S., Corner, R., Groom, S., Gu, H., Hawkins, A.J.S., Hutson, R., Lan, D., Lencart e Silva, J.D., Pascoe, P., Telfer, T., Zhang, X., Zhu, M., Assessment of coastal management options by means of multilayered ecosystem models. Estuarine Coastal and Shelf Science, In Press. Nobre, A.M., Robertson-Andersson, D., Neori, A., Sankar, K., Ecological-economic assessment of aquaculture options: comparison between monoculture and integrated multi-trophic aquaculture. Submitted to Aquaculture.
Nobre, A.M., Bricker, S.B., Ferreira, J.G., Yan, X., de Wit, M., Nunes, J.P., Integrated environmental modelling and assessment of coastal ecosystems, application for
aquaculture management. Submitted to Coastal Management.
Acknowledgments i
Abstract iii
Resumo v
Abbreviations vii
Symbols viii
List of figures xvii
List of tables xix
Índice de figuras xxi
Índice de quadros xxiii
CHAPTER 1. INTRODUCTION 1
1.1 Background 2
1.1.1 Coastal management challenge: addressing emerging coastal zone problems 2 Integrated Coastal Zone Management (ICZM) 2
Ecosystem-Based Management (EBM) 5
Ecosystem Approach to Aquaculture (EAA) 7 1.1.2 Role of science for coastal management 8 Increase of knowledge about complex coastal processes 9 Tools to communicate science to managers 9 Interaction of coastal environment and socio-economics 10
1.2 Thesis overview 11
1.2.1 Objectives 11
1.2.2 Study sites 13
1.2.3 Thesis outline 15
CHAPTER 2. MULTILAYERED ECOSYSTEM MODELLING 19
Assessment of coastal management options by means of multilayered ecosystem models 21
INTRODUCTION 21
METHODOLOGY 25
Study site and data 25
Multilayered ecosystem model 28
Catchment sub-model 33
Hydrodynamic sub-model 35
Aquatic resource sub-model 36
Biogeochemical sub-model 37
Coastal management options simulation 38
Definition of scenarios 38
Ecosystem simulation 40
Development scenarios 46
DISCUSSION 49
CONCLUSIONS 51
CHAPTER 3. INTEGRATED ECOLOGICAL-ECONOMIC ASSESSMENT 53
An ecological and economic assessment methodology for coastal ecosystem management 55
INTRODUCTION 55
METHODOLOGY 57
DPSIR framework 57
Characterization stage 58
Quantification stage 58
Overview stage 59
Case Study: site and data description 60
Data collection and analysis 61
Characterization stage of the ∆DPSIR 62
Ecological assessment of the ∆DPSIR 64
Pressure 64
State 65
Pressure, ∆State and Impact State 67
Economic assessment of the ∆DPSIR 68
Value of the drivers 71
Value of the ecosystem 71
Value of the response 72
Value of the impact on the ecosystem 72
Economic value of management 73
Spatial and Temporal Scope 74
RESULTS AND DISCUSSION 74
Characterization stage 74
Quantification stage 76
Drivers 76
Pressure 77
State 78
Response 79
Impact 79
Overview stage 81
CONCLUSIONS 83
CHAPTER 4. ECOSYSTEM APPROACH TO AQUACULTURE 85
4.1 Waterbody/watershed level assessment: evaluation of model scenarios 86 Integrated environmental modelling and assessment of coastal ecosystems, application for aquaculture
management 87
INTRODUCTION 87
METHODOLOGY 89
General approach 89
Case study site and data 90
Data description and analysis 91
Scenarios 93
ASSETS model application 93
Influencing factors - IF 94
Eutrophic condition - EC 94
Future outlook - FO 94
ASSETS application to ecosystem model outputs 94 Differential Drivers-Pressure-State-Impact-Response application 95
Drivers 95
Pressures 96
Response 98
Overview 98
RESULTS AND DISCUSSION 99
Eutrophication assessment of Xiangshan Gang 99
Data-based application 99
Assessment of simulated scenarios 101
Integrated ecological-economic assessment 103
Drivers 103
Pressures 103
State and Impact 104
Response 108
Overview of the integrated environmental-economic assessment 108
CONCLUSIONS 111
4.2 Farm level assessment: IMTA evaluation using real farm data 113 Ecological-economic assessment of aquaculture options: comparison between monoculture and integrated
multi-trophic aquaculture 115
INTRODUCTION 115
METHODOLOGY 117
General approach 117
Case study site and data 119
Differential Drivers-Pressure-State-Impact-Response application to the case study 120
Drivers 121
Pressures 122
State 124
Impact 124
Response 125
A Nutrient mass balance model for the recirculating system 125
RESULTS AND DISCUSSION 128
Drivers 129
Pressures 130
Nutrient discharge 130
Harvesting of natural kelp beds 131
CO2 balance 131
State and Impact 131
Response 133
Managing nutrient limitation due to seaweed expansion 133 Nutrient mass balance in I & J, Cape Cultured Abalone Pty, Ltd. farm 133 Nutrient mass balance in Seaor Marine Ltd. farm 133 Insights from the nutrient mass balance model 134
DISCUSSION 134
Social relevance 135
CONCLUSION 136
CHAPTER 5. ECOLOGICAL-ECONOMIC DYNAMIC MODELLING 137
A dynamic ecological-economic modeling approach for aquaculture management 139
INTRODUCTION 139
METHODOLOGY 141
Conceptual approach 141
Ecological and economic limits 142
Case study: site and data description 143
Model implementation 145
Ecological component 146
Economic component 149
Decision component 154
Model assessment and scenario definition 156
RESULTS 157
DISCUSSION 160
Integration of ecosystem-based tools to support coastal zone management 165
INTRODUCTION 165
GENERAL APPROACH 166
Integration of ecosystem-based tools 166
Case study 167
REMOTE SENSING 167
GEOGRAPHIC INFORMATION SYSTEMS 168
CATCHMENT MODELING 169
COASTAL ECOSYSTEM MODELING 169
ECONOMIC VALUATION 170
ASSESSMENT METHODOLOGIES 171
CONCLUDING REMARKS 173
CHAPTER 7. GENERAL DISCUSSION 175
7.1 Integrated ecological-economic modelling and assessment approach 176
7.2 Concluding remarks about the study sites 179
7.3 Conclusions 183
FIGURE 1.1. STUDY SITES. 13
FIGURE 1.2. THESIS ORGANISATION. 15
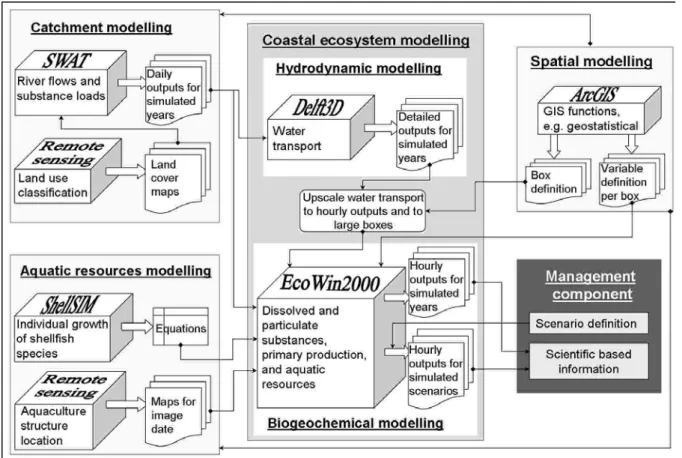
FIGURE 2.1. XIANGSHAN GANG AND CATCHMENT AREA CHARACTERISATION. 26 FIGURE 2.2. INTEGRATED CATCHMENT-BAY MODELLING APPROACH FOR COASTAL ECOSYSTEM MANAGEMENT:
MODEL COMPONENTS AND ECOSYSTEM-BASED TOOLS. 28
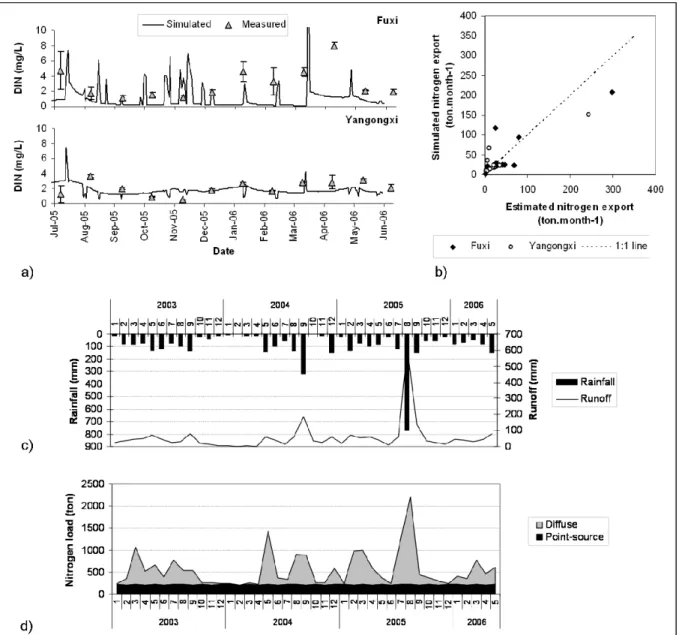
FIGURE 2.3. CATCHMENT MODEL OUTPUTS AND COMPARISON WITH DATA: A) MEASURED AND SIMULATED DISSOLVED INORGANIC NITROGEN (DIN) FOR FUXI AND YANGONGXI RIVERS; B) ESTIMATED AND SIMULATED NITROGEN EXPORT; C) SIMULATED MONTHLY RUNOFF COMPARED WITH RAINFALL; AND D)
NITROGEN LOADS FROM DIFFUSE AND POINT SOURCES. 34
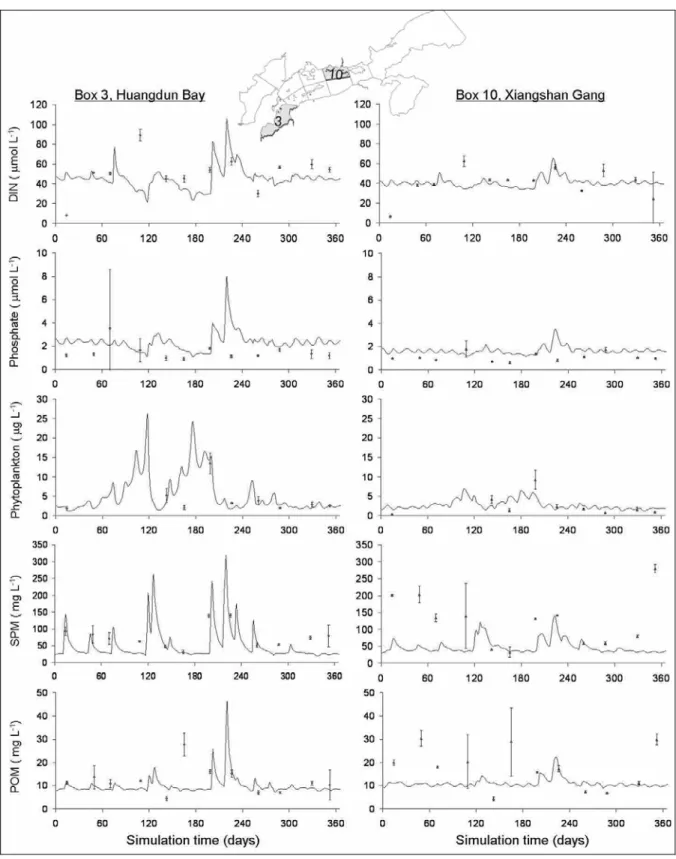
FIGURE 2.4. STANDARD SIMULATION OUTPUTS FOR AN INNER BOX (BOX 3, HUANGDUN BAY) AND A MIDDLE BOX (BOX 10), PLOTTED WITH AVERAGE DAILY DATA (JUNE2005/JUNE2006) AND CORRESPONDING STANDARD DEVIATION: PHYTOPLANKTON BIOMASS, DISSOLVED INORGANIC NITROGEN (DIN), PHOSPHATE, SUSPENDED PARTICULATE MATTER (SPM) MATTER AND PARTICULATE ORGANIC MATTER (POM). 41 FIGURE 2.5. STANDARD SIMULATION OUTPUTS FOR PHYTOPLANKTON PLOTTED WITH AVERAGE DAILY DATA
(JUNE2005/JUNE2006) AND CORRESPONDING STANDARD DEVIATION FOR BOXES 1, 3, 4, 6, 7, 9, 10. 42 FIGURE 2.6. STANDARD SIMULATION OUTPUTS FOR BOX 3 (IN GREY) AND BOX 11 (IN BLACK) FOR: OYSTER
PRODUCTION (STANDING STOCK, TOTAL BIOMASS); MASS LOSS DUE TO REPRODUCTION, FAECES AND EXCRETION; AND KEY ENVIRONMENTAL VARIABLES AFFECTING OYSTER GROWTH, I.E. PHYTOPLANKTON BIOMASS, PARTICULATE ORGANIC MATTER (POM) AND WATER TEMPERATURE. PEAKS ARE INDICATED WITH LETTERS P#, POM#, ML# FOR PHYTOPLANKTON, POM AND MASS LOSS, RESPECTIVELY. THE STRIPES SUPERIMPOSED IN THE SHELLFISH PRODUCTION PLOTS INDICATE THE TIME SNAPSHOTS THAT CORRESPOND
TO THE PEAKS, HARVESTING AND SEEDING. 43
FIGURE 2.7. STANDARD SIMULATION OUTPUTS FOR SHELLFISH HARVEST AND COMPARISON WITH DATA (IN T YEAR
-1
). 44
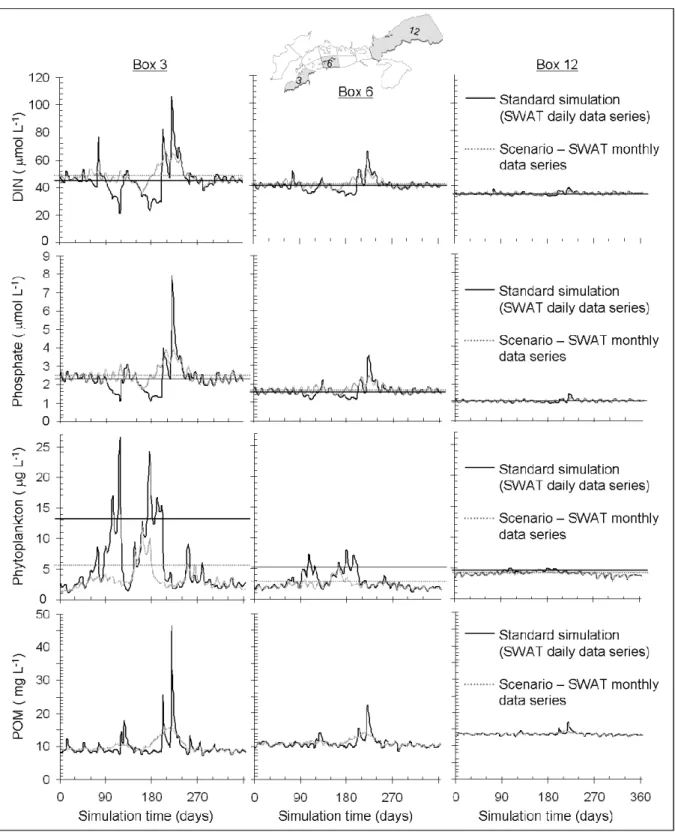
FIGURE 2.8. SENSITIVITY ANALYSIS OF THE COASTAL ECOSYSTEM TO THE TEMPORAL RESOLUTION OF THE CATCHMENT MODEL OUTPUTS FOR AN INNER BOX (BOX 3, HUANGDUN BAY), A MIDDLE BOX (BOX 6), AND AN OUTER BOX (BOX 12): DISSOLVED INORGANIC NITROGEN (DIN), PHOSPHATE, PHYTOPLANKTON BIOMASS AND PARTICULATE ORGANIC MATTER (POM). (STRAIGHT LINES IN THE PLOTS INDICATE AVERAGE VALUE FOR DIN AND PHOSPHATE, AND 90-PERCENTILE FOR PHYTOPLANKTON). 45 FIGURE 2.9. SCENARIO SIMULATION OUTPUTS FOR AN INNER BOX (BOX 3, HUANGDUN BAY), A MIDDLE BOX (BOX
6), AND AN OUTER BOX (BOX 12): DISSOLVED INORGANIC NITROGEN (DIN), PHOSPHATE, PHYTOPLANKTON BIOMASS, HARVESTED SHELLFISH AND SHELLFISH PRODUCTIVITY (CALCULATED AS THE RATIO OF TOTAL WEIGHT OF SHELLFISH HARVESTED TO TOTAL WEIGHT OF SEEDING). 47 FIGURE 2.10. SHELLFISH PRODUCTIVITY, CALCULATED AS THE RATIO OF TOTAL WEIGHT OF SHELLFISH HARVESTED
TO TOTAL WEIGHT OF SEEDING. 49
FIGURE 3.1. ∆DPSIR CONCEPTUAL MODEL: CHARACTERIZATION (STAGE 1), QUANTIFICATION (STAGE 2), AND
OVERVIEW (STAGE 3) STAGES. 57
FIGURE 3.2. SCHEMATIC REPRESENTATION OF THE CHARACTERIZATION STAGE OF THE ∆DPSIR APPROACH. 58 FIGURE 3.3. SCHEMATIC PRESENTATION OF THE QUANTIFICATION STAGE OF THE ∆DPSIR APPROACH. A)
ASSESSMENT IN A GIVEN YEAR AND B) ASSESSMENT OF THE CHANGES IN A GIVEN PERIOD. 58 FIGURE 3.4. SCENARIOS FOR THE EVOLUTION OF ECOLOGICAL AND ECONOMIC INDICATORS: A) SUSTAINABLE
SCENARIO, B) OVEREXPLOITATION SCENARIO, C) RESTORATION/REMEDIATION SCENARIO, D) NO
MANAGEMENT SCENARIO. 60
FIGURE 3.5. LAND USE AND OCCUPATION IN RIA FORMOSA AND ITS CATCHMENT AREA. 61 FIGURE 3.6. RIA FORMOSA ECOLOGICAL MODEL RESULTS FROM NOBRE ET AL. (2005). A) MODEL BOXES, B)
MACROALGAL GROWTH AS FUNCTION OF NUTRIENT LOADS, C) DISSOLVED OXYGEN CONCENTRATION 67 FIGURE 3.7. ∆DPSIR ECONOMIC ASSESSMENT. 69 FIGURE 3.8. DRIVER PRODUCTION, LABOR FORCE AND OCCUPIED AREA IN RIA FORMOSA AND ITS CATCHMENT. 76 FIGURE 3.9. PRESSURE QUANTIFICATION: A) NITROGEN (N) AND PHOSPHORUS (P) LOADS GENERATED BY THE
DRIVERS, AND B) BIOCHEMICAL OXYGEN DEMAND (BOD5) AND POPULATION EQUIVALENTS (PEQ) OF THE
DRIVERS’ WASTEWATER. 77
FIGURE 3.10. DATA USED FOR STATE QUANTIFICATION OF BIVALVE PRODUCTION: A) ESTIMATED PRODUCTION RATES GIVEN BY A LOCAL AQUACULTURE ASSOCIATION AND B) CLASSIFICATION OF BIVALVE PRODUCTION AREAS BASED ON ANNUAL AVERAGE VALUES OF FAECAL COLIFORMS. 78 FIGURE 3.11 ∆DPSIR RESULTS IN ∆T: VIMPACT FOR THE THREE SCENARIOS CONSIDERED FOR THE CALCULATION
OF VEXTERNALITIES AS DEFINED IN TABLE 3.11. 80
FIGURE 3.12. ∆DPSIR RESULTS IN ∆T: VMANAGEMENT FOR THE THREE SCENARIOS CONSIDERED FOR THE
FIGURE 4.2. XIANGSHAN GANG CHARACTERIZATION: BATHYMETRY; SAMPLING STATIONS; AQUACULTURE STRUCTURES AND PRODUCTION; WATERSHED SUB-BASIN LIMITS AND LAND USE; AND MODEL BOXES. 91 FIGURE 4.3. DIFFERENTIAL DPSIR APPLICATION TO EVALUATE SIMULATED SCENARIOS. 95 FIGURE 4.4. PRESSURE CHANGE: A) NUTRIENT LOAD (RESEARCH LEVEL); B) CATCHMENT-AQUACULTURE SOURCES
CONTRIBUTION USING IF INDEX OF THE ASSETS MODEL (MANAGEMENT LEVEL). 104 FIGURE 4.5. SHELLFISH PRODUCTIVITY PER BOX EXPRESSED AS THE AVERAGE PHYSICAL PRODUCT (APP: RATIO OF
TOTAL WEIGHT OF SHELLFISH HARVESTED TO TOTAL WEIGHT OF SEEDING), FOR CHINESE OYSTER, RAZOR
CLAM, MANILA CLAM AND MUDDY CLAM. 105
FIGURE 4.6. ECOSYSTEM STATE CLASSIFICATION OF NUTRIENTS AND CHL-A PER BOX FOR STANDARD SIMULATION AND INDICATION OF CHANGES AS SIMULATED IN EACH SCENARIO. 106 FIGURE 4.7. APPLICATION OF THE DIFFERENTIAL DPSIR TO EVALUATE THE SEAWEED ROLE IN IMTA. 119 FIGURE 4.8. NUTRIENT MASS BALANCE MODEL FOR SETTING 3 (RECIRCULATING IMTA SYSTEM WITH 12 SEAWEED
PONDS TO BE IMPLEMENTED IN THE I & J FARM). 126 FIGURE 4.9. NUTRIENT MASS BALANCE MODEL ESTIMATES OF % OF FERTILIZER REQUIRED FOR SEAWEED
PRODUCTION IN THE I & J FARM AS A FUNCTION OF TARGET YIELD. 133 FIGURE 5.1. MARKET CONCEPTUAL MODEL: ECOLOGICAL-ECONOMIC INTERACTIONS IN MARICULTURE. 141 FIGURE 5.2. XIANGSHAN GANG MAP AND PHYSICAL DATA. 143 FIGURE 5.3. DECISION MODEL IMPLEMENTATION: LOGICAL TEST FOR DECISION ABOUT INCREASE, DECREASE OR
MAINTAINING CURRENT PRODUCTION. 155
FIGURE 5.4. SIMULATION RESULTS FOR STANDARD SCENARIO, SCENARIO 1 AND SCENARIO 2 FOR: A) LOCAL DEMAND (LD), B) SHELLFISH PRODUCTION (Q), C) MARGINAL COST AND REVENUE (MC AND MR) AND D)
NET PROFIT (NP). 158
FIGURE 5.5. SIMULATION RESULTS FOR STANDARD SCENARIOS, SCENARIO 3 AND SCENARIO 4 FOR: A) LOCAL DEMAND (LD), B) SHELLFISH PRODUCTION (Q), C) MARGINAL COST AND REVENUE (MC AND MR) AND D)
NET PROFIT (NP). 159
TABLE 1.1. OVERVIEW OF MAJOR ICZM INITIATIVES WORLDWIDE. 3 TABLE 1.2. EXAMPLES OF EVALUATION OF THE EFFECTIVENESS OF ICZM PROGRAMMES. 5 TABLE 1.3. KEY STAGES OF THE INTEGRATED ECOLOGICAL-ECONOMIC MODELLING AND ASSESSMENT
METHODOLOGY DEVELOPMENT. 12 TABLE 2.1. EXAMPLES OF MODELLING TOOLS USED FOR THE APPLICATION OF LEGISLATION AND MANAGEMENT
PROGRAMMES WORLDWIDE. 23 TABLE 2.2. SYNTHESIS OF DATASET USED IN THE INTEGRATED MODELLING APPROACH FOR THE XIANGSHAN
GANG. DATA SOURCE: SPEAR PROJECT (FERREIRA ET AL., 2008B) UNLESS INDICATED. 27 TABLE 2.3. MAIN EQUATIONS FOR CATCHMENT, HYDRODYNAMIC, AQUATIC RESOURCES AND BIOGEOCHEMICAL
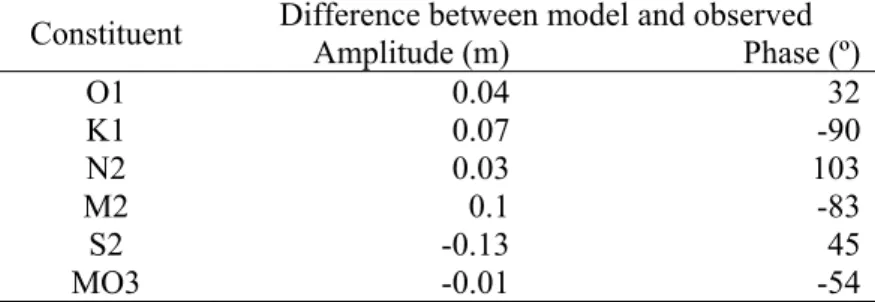
SUB-MODEL STATE VARIABLES. 29 TABLE 2.4. ECOSYSTEM MODEL FORCING FUNCTIONS FOR XIANGSHAN GANG STANDARD SIMULATION. 31 TABLE 2.5. ECOSYSTEM MODEL PARAMETERS FOR XIANGSHAN GANG STANDARD SIMULATION. 32 TABLE 2.6. AMPLITUDE AND PHASE OF THE HARMONIC CONSTITUENTS: COMPARISON BETWEEN OBSERVED AND
SIMULATED VALUES. 35
TABLE 2.7. CORRELATION BETWEEN MEASUREMENTS AND SIMULATION OF SHELLFISH INDIVIDUAL WEIGHT AND LENGTH, USING PEARSON PRODUCT-MOMENT CORRELATION COEFFICIENT (R). 37 TABLE 2.8. SCENARIO DEFINITION (PERCENTAGE CHANGES COMPARED WITH STANDARD SIMULATION ARE SHOWN
IN BRACKETS AND ITALICS). 46 TABLE 3.1. LEGISLATIVE AND POLICY INSTRUMENTS ADOPTED WORLDWIDE FOR COASTAL ECOSYSTEM
MANAGEMENT. 56
TABLE 3.2. DATA DESCRIPTION. 62 TABLE 3.3. CORRESPONDENCE BETWEEN MOST COMMON DRIVERS WITH RESPECTIVE PRESSURE INDICATORS AND
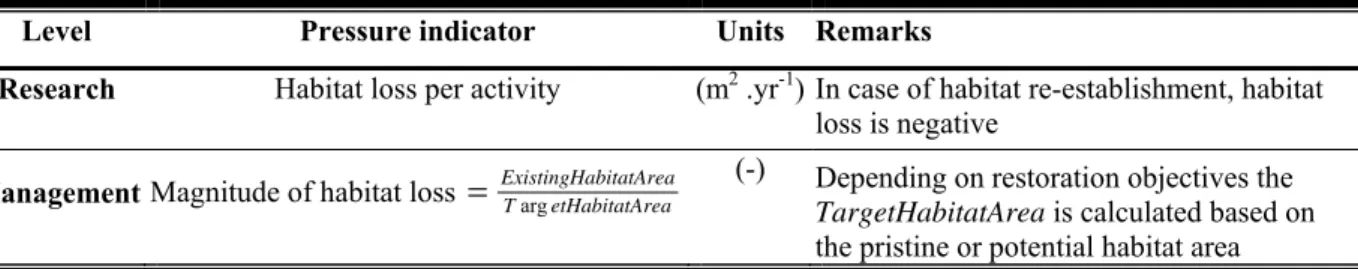
WITH ECOLOGICAL STATE INDICATORS. 63 TABLE 3.4. EXAMPLE OF PRESSURE INDICATORS AT THE RESEARCH AND MANAGEMENT LEVELS FOR THE LOSS OF
NATURAL HABITAT AREAS. 65 TABLE 3.5. STATE CLASSIFICATION TOOLS USED TO INFORM MANAGERS 66 TABLE 3.6. ECONOMIC ASSESSMENT VARIABLES OF THE ∆DPSIR 68 TABLE 3.7. ∆DPSIR COMPLEX ECONOMIC APPROACH. 70 TABLE 3.8. ∆DPSIR SIMPLE ECONOMIC APPROACH. 70 TABLE 3.9. CHARACTERIZATION OF THE DRIVERS, STATE INDICATORS AND PRESSURE INDICATORS IN RIA
FORMOSA 75
TABLE 3.10. QUANTIFICATION OF DRIVERS IN RIA FORMOSA AND ITS CATCHMENT (CHANGES BETWEEN 1985 AND
1995). 76
TABLE 3.11. POSSIBLE MANAGEMENT ACTION COSTS NECESSARY TO AVOID ABNORMAL CLAM MORTALITY. 80 TABLE 4.1. SYNTHESIS OF DATASET USED IN THE INTEGRATED MODELLING AND ASSESSMENT APPROACH. DATA
COMPILED FROM CHAPTER 2 WORK, OTHERWISE REFERENCE IS PROVIDED. 92 TABLE 4.2. SCENARIO DEFINITION. 93 TABLE 4.3. XIANGSHAN GANG EUTROPHIC CONDITION (EC) CLASSIFICATION, BASED ON DATA. 100 TABLE 4.4. EXAMPLE OF HAB EVENTS IN XIANGSHAN GANG (ZOFB, 2008). 101 TABLE 4.5. SYNTHESIS OF ASSETS APPLICATION TO MODEL OUTPUTS AND COMPARISON WITH DATA-BASED
APPLICATION. 102
TABLE 4.6. DRIVERS QUANTIFICATION: FISH AND SHELLFISH AQUACULTURE PRODUCTION (TONNAGE AND NET
PROFIT). 103
TABLE 4.7. VALUE OF ENVIRONMENTAL EXTERNALITIES: AVOIDED COSTS DUE TO FISH CAGE REDUCTION (IN SCENARIOS 1 AND 3) AND WWTP COSTS (IN SCENARIOS 2 AND 3). 107 TABLE 4.8. ECONOMIC IMPACTS OF THE SHIFT FROM THE STANDARD SIMULATION TO EACH SCENARIO. 108 TABLE 4.9. SYNTHESIS OF THE ECOLOGICAL AND ECONOMIC VARIABLES OF THE DIFFERENTIAL DPSIR ANALYSIS
FOR THE SHIFT FROM STANDARD SIMULATION TO EACH SCENARIO. 109 TABLE 4.10. SETTINGS ADOPTED FOR THE APPLICATION OF THE DIFFERENTIAL DPSIR TO THE I & J FARM. 120 TABLE 4.11. RUNNING COSTS OF I & J FARM WHEN PRODUCING ABALONE IN MONOCULTURE USING A
FLOW-THROUGH SYSTEM (SETTING 1) (COMPILED FROM ROBERTSON-ANDERSSON (2007)). 121 TABLE 4.12. GENERAL INDICATORS OF PRESSURE EXERTED ON THE COASTAL ECOSYSTEM BY AQUACULTURE OF
ABALONE, SEAWEED AND FISH. 122 TABLE 4.13. WATER QUALITY AND WATER FLOW IN THE MONOCULTURE (SETTING 1) AND IMTA SYSTEM (SETTING
TABLE 4.17. ADDITIONAL COSTS ASSOCIATED WITH THE SEAWEED PONDS AND SAVINGS THAT RESULT FROM THE SHIFTING OF MONOCULTURE (SETTING 1) TO THE IMTA (SETTINGS 2 AND 3) IN THE I & J FARM. 130 TABLE 4.18. NUTRIENT SOURCES AND SINKS FOR THE I & J FARM IN (I) A FLOW-THROUGH 120 TON ABALONE
MONOCULTURE SYSTEM AND (II) A 120 TON ABALONE AND SEAWEED (FOUR PONDS) IMTA SYSTEM. 130 TABLE 4.19. NUTRIENT SOURCE AND SINK PREDICTIONS FOR I & J FARM: (I) FOR THE PROJECTED 120 TON
ABALONE FARM COMBINED WITH TWELVE SEAWEED PONDS (360 TON) IN A RECIRCULATING SYSTEM; AND (II) FOR A SENSITIVITY ANALYSIS FOR THE NUTRIENT REMOVAL EFFICIENCY, WHERE IS TESTED EUPTAKE
VALUES FROM THE LITERATURE (75% FOR N AND 12.5% FOR P) INSTEAD OF USING VALUES FROM SETTING 2 (53% FOR N AND 5% FOR P). 131 TABLE 4.20. NUTRIENT BUDGET IN SEAOR MARINE LTD IMTA FARM COMBINING FISH, SEAWEED AND ABALONE
FIGURA 1.1. LOCAIS DE ESTUDO. 13 FIGURA 1.2. ORGANIZAÇÃO DA TESE. 15 FIGURA 2.1. CARACTERIZAÇÃO DE XIANGSHAN GANG E SUA BACIA HIDROGRÁFICA. 26 FIGURA 2.2. ABORDAGEM INTEGRADA DE SIMULAÇÃO DA BACIA HIDROGRÁFICA E DO ECOSISTEMA
COSTEIRO.
28
FIGURA 2.3. RESULTADOS DO MODELO DE BACIA HIDROGRÁFICA E COMPARAÇÃO COM OS DADOS: A) AZOTO INORGÂNICO DISSOLVIDO PARA OS RIOS FUXI E YANGONGXI (DADOS E SIMULAÇAO); ESTIMATIVA E
SIMULAÇAO DA EXPORTAÇÃO DE AZOTO; C) ESCORRÊNCIA MENSAL EM COMPARAÇÃO COM A PRECIPITAÇÃO; E D) CARGAS DE AZOTO DE FONTES DIFUSAS E PONTUAIS.
34
FIGURA 2.4. RESULTADOS DO MODELO PARA UMA CAIXA INTERIOR (BOX 3, HUANGDUN BAY) E UMA CAIXA INTERMÉDIA (BOX 10), MÉDIA DIÁRIA CALCULADA A PARTIR DOS DADOS (JUN2005/JUL2006) E
CORRESPONDENTE DESVIO PADRÃO: BIOMASSA DE FITOPLÂNCTON, AZOTO INORGÂNICO DISSOLVIDO (DIN), FOSFATO, MATÉRIA PARTICULADA EM SUSPENSÃO (SPM) E MATÉRIA ORGÂNICA EM SUSPENSÃO (POM).
41
FIGURA 2.5. RESULTADOS DO MODELO PARA FITOLÂNCTON, MÉDIA DIÁRIA CALCULADA A PARTIR DOS DADOS (JUN2005/JUL2006) E CORRESPONDENTE DESVIO PADRÃO, PARA AS CAIXAS 1, 3, 4, 6, 7, 9, 10.
42
FIGURA 2.6. RESULTADOS DO MODELO PARA A CAIXA 3 (EM CINZENTO) E A CAIXA 11 (EM PRETO) PARA: PRODUÇÃO DE OSTRAS (STOCK, BIOMASSA TOTAL, COLHEITA), PERDA DE MASSA DEVIDO À REPRODUÇÃO, FEZES E EXCREÇÃO; E PRINCIPAIS VARIÁVEIS AMBIENTAIS QUE AFECTAM O CRESCIMENTO DA OSTRA (BIOMASSA DE FITOPLÂNCTON, MATÉRIA PARTÍCULADA ORGÂNICA E TEMPERATURA DA ÁGUA).
43
FIGURA 2.7. RESULTADOS DO MODELO: PRODUÇÃO DE BIVALVES E COMPARAÇÃO COM OS DADOS (EXPRESSO EM T ANO-1).
44
FIGURA 2.8. ANÁLISE DE SENSIBILIDADE DO ECOSSISTEMA COSTEIRO À RESOLUÇÃO TEMPORAL DOS OUTPUTS DO MODELO DE BACIA, PARA UMA CAIXA INTERIOR (BOX 3, HUANGDUN BAY), UMA CAIXA INTERMÉDIA (CAIXA 6), E UMA CAIXA EXTERIOR (BOX 12): AZOTO INORGÂNICO DISSOLVIDO (DIN),
FOSFATO, CONCENTRAÇÃO DE FITOPLÂNCTON E MATÉRIA ORGÂNICA PARTÍCULADA (POM). (LINHAS RECTAS NOS GRÁFICOS INDICAM O VALOR MÉDIO DE DIN E FOSFATO, E O PERCENTIL 90 PARA O FITOPLÂNCTON).
45
FIGURA 2.9. RESULTADOS DA SIMULAÇÃO DOS CENÁRIOS PARA UMA CAIXA INTERIOR (BOX 3, HUANGDUN BAY), UMA CAIXA INTERMÉDIA (CAIXA 6) E UMA CAIXA EXTERIOR (BOX 12): AZOTO INORGÂNICO
DISSOLVIDO (DIN), FOSFATO, MATÉRIA ORGÂNICA PARTICULADA (POM), BIOMASSA DE FITOPLÂNCTON, BIOMASSA DE BIVALVES COLHIDA E PRODUTIVIDADE DOS BIVALVES.
47
FIGURA 2.10. PRODUTIVIDADE DOS BIVALVES EXPRESSA COMO A RAZÃO ENTRE BIOMASSA COLHIDA E BIOMASSA SEMEADA.
49
FIGURA 3.1. MODELO CONCEPTUAL ∆DPSIR: CARACTERIZAÇÃO (ETAPA 1), QUANTIFICAÇÃO (ETAPA 2), E SÍNTESE (ETAPA 3).
57
FIGURA 3.2. REPRESENTAÇÃO ESQUEMÁTICA DA ETAPA DE CARACTERIZAÇÃO DO ∆DPSIR. 58 FIGURA 3.3. REPRESENTAÇÃO ESQUEMÁTICA DA ETAPA DE QUANTIFICAÇÃO DO ∆DPSIR. A) AVALIAÇÃO PARA UM DETERMINADO ANO, B) AVALIAÇÃO DAS ALTERAÇÕES NUM DADO PERÍODO.
58
FIGURA 3.4. CENÁRIOS DE EVOLUÇÃO ECOLÓGICA-ECONÓMICA: A) CENÁRIO SUSTENTÁVEL, B) CENÁRIO DE SOBRE-EXPLORAÇÃO, C) CENÁRIO DE REMEDIAÇÃO, D) CENÁRIO DE FALTA DE GESTÃO.
60
FIGURA 3.5. OCUPAÇÃO E USO DA SUPERFÍCIE NA RIA FORMOSA E BACIA HIDROGRÁFICA. 61 FIGURA 3.6. RESULTADOS DO MODELO ECOLÓGICO DA RIA FORMOSA A PARTIR DE NOBRE ET AL. (2005). A) CAIXAS DO MODELO, B) CRESCIMENTO DE MACROALGAS EM FUNÇÃO DAS CARGAS DE NUTRIENTES, C), CONCENTRAÇÃO DE OXIGÉNIO DISSOLVIDO.
67
FIGURA 3.7. ANÁLISE ECONÓMICA DO ∆DPSIR. 69 FIGURA 3.8. PRODUÇÃO DAS ACTIVIDADES ECONÓMICAS, TRABALHO E ÁREA OCUPADA NA RIA FORMOSA E BACIA HIDROGRÁFICA.
76
FIGURA 3.9. QUANTIFICAÇÃO DA PRESSÃO: A) CARGAS DE AZOTO (N) E FÓSFORO (P) GERADAS PELAS ACTIVIDADES; E B) CARÊNCIA BIOQUÍMICA DE OXIGÉNIO (BOD5) E POPULAÇÃO EQUIVALENTE (PEQ) DAS ÁGUAS RESIDUAIS.
77
FIGURA 3.10. DADOS UTILIZADOS PARA A QUANTIFICAÇÃO DA PRODUÇÃO DE BIVALVES. A) TAXAS DE PRODUÇÃO ESTIMADAS POR UMA ASSOCIAÇÃO LOCAL DE AQUACULTURA, E B) CLASSIFICAÇÃO DAS ZONAS DE PRODUÇÃO DE BIVALVES BASEADA EM VALORES MÉDIOS ANUAIS DE COLIFORMES FECAIS.
78
FIGURA 3.11. RESULTADOS DO ∆DPSIR EM ∆T: VIMPACT PARA OS TRÊS CENÁRIOS CONSIDERADOS PARA O CÁLCULO DE VEXTERNALITIES COMO DEFINIDO NA TABELA 3.11.
70
FIGURA 3.13. SÍNTESE DO ∆DPSIR: ALTERAÇÕES ECOLÓGICAS E ECONÓMICAS NAS ACTIVIDADES, PRESSÃO E ESTADO.
81
FIGURA 4.1. ESQUEMA DA ABORDAGEM INTEGRADA DE MODELAÇÃO E AVALIAÇÃO PARA ECOSSISTEMAS COSTEIROS.
90
FIGURA 4.2. CARACTERIZAÇÃO DE XIANGSHAN GANG: BATIMETRIA; ESTAÇÕES DE AMOSTRAGEM, ESTRUTURAS DE AQUACULTURA E PRODUÇÃO; LIMITES DAS SUB-BACIAS HIDROGRÁFICAS E USO DO SOLO; CAIXAS DO MODELO.
91
FIGURA 4.3. APLICAÇÃO DO ∆DPSIR PARA AVALIAR CENÁRIOS SIMULADOS. 95 FIGURA 4.4. ALTERAÇÕES NA PRESSÃO: A) CARGA DE NUTRIENTES (NÍVEL DE PESQUISA); B) ESTIMATIVA DA CONTRIBUIÇÃO DAS FONTES DE DA BACIA HIDROGRÁFICAS E AQUACULTURA USANDO O ÍNDICE IF DO MODELO ASSETS (NÍVEL DE GESTÃO).
104
FIGURA 4.5. PRODUTIVIDADE DOS BIVALVES POR CAIXA EXPRESSA COMO A RAZÃO ENTRE A BIOMASSA COLHIDA ANUALMENTE E SEMEADA ANUALMENTE PARA A OSTRA CHINESA, LINGUEIRÃO, AMEIJOA JAPÓNICA E ‘MUDDY CLAM’.
105
FIGURA 4.6. CLASSIFICAÇÃO DOS NUTRIENTES E CHL-A POR CAIXA PARA A SIMULAÇÃO STANDARD E INDICAÇÃO DAS ALTERAÇÕES SIMULADAS EM CADA CENÁRIO.
106
FIGURA 4.7. APLICAÇÃO DO ∆DPSIR PARA AVALIAR O PAPEL DAS MACROALGAS EM IMTA. 119 FIGURA 4.8. MODELO DE BALANÇO DE MASSA DE NUTRIENTES PARA O SISTEMA DE RECIRCULAÇÃO DO
CENÁRIO 3.
126
FIGURA 4.9. ESTIMATIVAS DO MODELO DE BALANÇO DE MASSA DE NUTRIENTES SOBRE A % DE
FERTILIZANTE NECESSÁRIA PARA A PRODUÇÃO DAS MACROALGAS EM FUNÇÃO DA COLHEITA PRETENDIDA. 133
FIGURA 5.1. MODELO CONCEPTUAL MARKET: INTERACÇÕES ECOLOGÍCAS-ECONÓMICAS EM AQUACULTURA MARINHA.
141
FIGURA 5.2. MAPA DE XIANGSHAN GANG E CARACTERIZAÇÃO FÍSICA. 143 FIGURA 5.3. TESTE LÓGICO PARA DECISÃO SOBRE AUMENTAR, DIMINUIR OU MANTER A PRODUÇÃO ACTUAL. 155 FIGURA 5.4. RESULTADOS DA SIMULAÇÃO PARA O CENÁRIO STANDARD, CENÁRIO 1 E CENÁRIO 2 PARA: A) PROCURA LOCAL (LD), B) PRODUÇÃO DE BIVALVES (Q), C) CUSTO E RECEITA MARGINAL (MC E MR) E D) LUCRO (NP).
158
FIGURA 5.5. RESULTADOS DA SIMULAÇÃO PARA O CENÁRIO STANDARD, CENÁRIO 3 E CENÁRIO 4 PARA: A) PROCURA LOCAL (LD), B) PRODUÇÃO DE BIVALVES (Q), C) CUSTO E RECEITA MARGINAL (MC E MR) E D) LUCRO (NP).
159
FIGURA 6.1. INTEGRAÇÃO DE FERRAMENTA PARA A GESTÃO DE ECOSSISTEMAS COSTEIROS. 166 FIGURA 6.2. RESULTADOS SOBRE A CLASSIFICAÇÃO DE USO DO SOLO DA BACIA DE DRENAGEM DA RIA
FORMOSA.
QUADRO 1.1. SÍNTESE DAS PRINCIPAIS INICIATIVAS DE ICZM A NÍVEL MUNDIAL. 3 QUADRO 1.2. EXEMPLOS DE AVALIAÇÃO DA EFICÁCIA DOS PROGRAMAS DE ICZM. 5 QUADRO 1.3. PRINCIPAIS ETAPAS DO DESENVOLVIMENTO DA METODOLOGIA INTEGRADA
ECOLÓGICA-ECONÓMICA DE MODELAÇÃO E AVALIAÇÃO.
12
QUADRO 2.1. EXEMPLOS DE FERRAMENTAS DE MODELAÇÃO UTILIZADAS NA APLICAÇÃO DA LEGISLAÇÃO E PROGRAMAS DE GESTÃO A NÍVEL MUNDIAL.
23
QUADRO 2.2. SÍNTESE DOS DADOS UTILIZADOS NA ABORDAGEM DE MODELAÇÃO INTEGRADA. FONTE DE DADOS: PROJECTO SPEAR (FERREIRA ET AL., 2008B) SALVO INDICAÇÃO.
27
QUADRO 2.3. PRINCIPAIS EQUAÇÕES PARA AS VARIÁVEIS DOS SUB-MODELOS DE BACIA HIDROGRÁFICA, HIDRODINÂMICO, RECURSOS AQUÁTICOS E BIOGEOQUÍMICO SUB-VARIÁVEIS MODELO DE ESTADO.
29
QUADRO 2.4. FUNÇÕES FORÇADORAS DO MODELO DE ECOSSISTEMA DE XIANGSHAN GANG. 31 QUADRO 2.5. PARÂMETROS DO MODELO DE ECOSSISTEMA DE XIANGSHAN GANG. 32 QUADRO 2.6. AMPLITUDE E FASE DAS CONSTANTES HARMÓNICAS: COMPARAÇÃO ENTRE VALORES
OBSERVADOS E SIMULADOS.
35
QUADRO 2.7. CORRELAÇÃO ENTRE VALORES MEDIDOS E SIMULADOS DE COMPRIMENTO E PESO INDIVIDUAL DE BIVALVES, UTILIZANDO O COEFICIENTE DE CORRELAÇÃO DE PEARSON (R).
37
QUADRO 2.8. DEFINIÇÃO DOS CENÁRIOS (PERCENTAGEM DE ALTERAÇÃO EM COMPARAÇÃO COM A SIMULAÇÃO STANDARD APRESENTADA ENTRE PARÊNTESIS E ITÁLICO).
46
QUADRO 3.1. INSTRUMENTOS LEGISLATIVOS E POLÍTICOS ADOPTADOS A NÍVEL MUNDIAL PARA GESTÃO DE ECOSSISTEMAS COSTEIROS.
56
QUADRO 3.2. DESCRIÇÃO DOS DADOS. 62 QUADRO 3.3. CORRESPONDÊNCIA ENTRE AS ACTIVIDADES MAIS COMUNS COM OS RESPECTIVOS
INDICADORES DE PRESSÃO E COM INDICADORES ECOLÓGICOS DE ESTADO.
63
QUADRO 3.4. EXEMPLO DE INDICADOR DE PRESSÃO, AOS NÍVEIS DE PESQUISA E DE GESTÃO, SOBRE PERDA DE ÁREAS DE HABITAT NATURAL.
65
QUADRO 3.5. FERRAMENTAS DE CLASSIFICAÇÃO DE ESTADO UTILIZADAS PARA INFORMAR OS GESTORES. 66 QUADRO 3.6. VARIÁVEIS DA AVALIAÇÃO ECONÓMICA DO ∆DPSIR. 68 QUADRO 3.7. ABORDAGEM COMPLEXA DE AVALIAÇÃO ECONÓMICA DO ∆DPSIR. 70 QUADRO 3.8. ABORDAGEM SIMPLES DE AVALIAÇÃO ECONÓMICA DO ∆DPSIR. 70 QUADRO 3.9. CARACTERIZAÇÃO DAS ACTIVIDADES, INDICADORES DE ESTADO E DE PRESSÃO NA RIA
FORMOSA.
75
QUADRO 3.10. QUANTIFICAÇÃO DAS ACTIVIDADES NA RIA FORMOSA E RESPECTIVA BACIA HIDROGRÁFICA (ALTERAÇÕES ENTRE 1985 E 1995).
76
QUADRO 3.11. POTENCIAIS CUSTOS DE ACÇÕES DE GESTÃO NECESSÁRIAS PARA EVITAR A MORTALIDDAE ANORMAL DE AMÊIJOAS.
80
QUADRO 4.1. SÍNTESE DOS DADOS UTILIZADOS. DADOS COMPILADOS A PARTIR DO CAPÍTULO 2 CASO CONTRÁRIO É INDICADA REFERÊNCIA.
92
QUADRO 4.2. DEFINIÇÃO DOS CENÁRIOS. 93 QUADRO 4.3. CLASSIFICAÇÃO DO ESTADO DE EUTROFIZAÇÃO DE XIANGSHAN GANG (EC), BASEADA EM DADOS.
100
QUADRO 4.4. EXEMPLO DE EVENTOS DE HAB’S EM XIANGSHAN GANG (ZOFB, 2008). 101 QUADRO 4.5. SÍNTESE DA APLICAÇÃO DO ASSETS AOS RESULTADOS DO MODELO E COMPARAÇÃO COM A APLICAÇÃO BASEADA EM DADOS.
102
QUADRO 4.6. QUANTIFICAÇÃO DAS ACTIVIDADES: PRODUÇÃO AQUÍCOLA DE PEIXES E BIVALVES (PESO E LUCRO).
103
QUADRO 4.7. VALOR DAS EXTERNALIDADES AMBIENTAIS: CUSTOS EVITADOS DEVIDO À REDUÇÃO DE JAULAS DE PEIXES (CENÁRIOS 1 E 3) E CUSTOS DA ETAR (CENÁRIOS 2 E 3).
107
QUADRO 4.8. IMPACTOS ECONÓMICOS RESULTANTES DA IMPLEMENTAÇÃO DE CADA CENÁRIO. 108 QUADRO 4.9. SÍNTESE DAS VARIÁVEIS ECOLÓGICAS E ECONÓMICAS DO ∆DPSIR. 109 QUADRO 4.10. CENÁRIOS ADOPTADOS PARA A APLICAÇÃO DO ∆DPSIR AO CASO DE ESTUDO. 120 QUADRO 4.11. CUSTO DE FUNCIONAMENTO DE UMA MONOCULTURA DE ABALONE (CENÁRIO 1)
(COMPILADO A PARTIR DE ROBERTSON-ANDERSSON (2007)).
121
QUADRO 4.13. QUALIDADE DA ÁGUA E CAUSAL DA MONOCULTURA (CENÁRIO 1) E DO SISTEMA DE IMTA (CENÁRIO 2) (COMPILADOS A PARTIR DE ROBERTSON-ANDERSSON (2007), ROBERTSON-ANDERSSON ET AL. (2008), SANKAR (2009)).
123
QUADRO 4.14. CUSTOS DE INVESTIMENTO DOS TANQUES DE MACROALGAS (COMPILADOS A PARTIR DE ROBERTSON-ANDERSSON (2007)).
125
QUADRO 4.15. SÍNTESE DA APLICAÇÃO DO ∆DPSIR AO CASO DE ESTUDO. 128 QUADRO 4.16. QUANTIFICAÇÃO DAS VARIÁVEIS ECOLÓGICAS E ECONÓMICAS DO ∆DPSIR. 129 QUADRO 4.17. CUSTOS ADICIONAIS ASSOCIADOS AOS TANQUES DE ALGAS E POUPANÇA QUE RESULTA DA PASSAGEM DE MONOCULTURA (CENÁRIO 1) PARA IMTA (CENÁRIOS 2 E 3).
130
QUADRO 4.18. FONTES E SUMIDOUROS DE NUTRIENTES NUMA (I) MONOCULTURA DE ABALONE E (II) A IMTA DE ABALONE E MACROALGAS.
130
QUADRO 4.19. ESTIMATIVAS DE FONTES E SUMIDOUROS DE NUTRIENTES PARA O IMTA PROJECTADO COM 120 TONELADAS DE ABALONE COMBINADA COM DOZE TANQUES DE MACROALGAS (360 TON).
131
QUADRO 4.20. BALANÇO DE NUTRIENTES NUM SISTEMA IMTA COM PEIXES, ALGAS E ABALONE (COMPILADO A PARTIR DE NEORI ET AL. (1998, 2004)).
134
QUADRO 5.1. INDICADORES SÓCIO-ECONÓMICOS DO CASO DE ESTUDO. COMPILADOS A PARTIR DA FAO (2005) E NBSC (2007).
144
Chapter 1.
Introduction
This chapter presents the frame of reference for the work developed and provides an overview of the thesis. The first part reviews the coastal management challenge and the role of science in addressing emerging coastal zone problems. The second part describes the thesis
1.1
Background
1.1.1 Coastal management challenge: addressing emerging coastal zone problems
Coastal zones comprise important ecosystems (MA, 2005), which generate goods and services with a high economic value (Ledoux and Turner, 2002). As a result, a strip 100 km wide along the coastline contains nearly 40% of the world population and 61% of the gross world product (MA, 2005). Anthropogenic pressures increasingly compromise, directly and indirectly, the important benefits generated by coastal systems (MA, 2005; Costanza and Farley, 2007). The main human threats to coastal areas include: loss of natural habitats, loss in biodiversity and cultural diversity, decline in water quality, vulnerability to global changes such as predicted sea level rise, increased negative impacts of coastal disasters, the diversity of human activities, competition for space and seasonal variations in pressure (Ehler et al., 1997; Fabbri, 1998; Humphrey et al., 2000; MA, 2005; Costanza and Farley, 2007).
Therefore, sustainable development of coastal zones constitutes a challenge for stakeholders with a role in coastal management.
Integrated Coastal Zone Management (ICZM)
Policy-makers worldwide have defined policy and legislative instruments to address the emerging coastal zone problems (Clark, 1996; Borja, 2006; Ducrotoy and Elliott, 2006). One of the more widely known and applied is the Integrated Coastal Zone Management (ICZM) approach. ICZM is defined as a dynamic management process that brings together the human and the ecological dimensions to promote the sustainable use, development and protection of coastal zones (Clark, 1996; Olsen, 2003; Forst, 2009). Managers worldwide have adopted ICZM within different contexts: 1) to address specific environmental problems emerged in coastal zones or to manage coastal vulnerability to natural hazards and climate change (Clark, 1996; Krishnamurthy et al., 2008); 2) either at national or local levels, as exemplified by NRMMC (2006) and Lewis III et al. (1999), respectively; 3) following a top-down approach or based on a community-based initiative (Cicin-Sain and Knecht, 1998; Lewis III, et al., 1999; Belfiore, 2000; Kearney et al., 2007). Table 1.1 presents an overview of worldwide coastal management initiatives. Although such synthesis is reductionist about coastal
Table 1.1. Overview of major ICZM initiatives worldwide.
First initiatives Recent initiatives
Date Programme Date Programme
Australia 2003 Framework for a National Cooperative Approach to ICZM
South Australia
1972 Coast Protection Act 1994 2000
Environ. Protection (Marine) Policy Environ. Protection (Water Quality) Policy
New South Wales
1979 Coastal Protection Act
Queensland 1995 Coastal Protection and Management Act
Tasmania 1996 State Coastal Policy
Victoria 1995 Coastal Management Act 1995
Western Australia
2001 CZM Policy
Brazil 1988 Law 7661, establishes the National CZM Plan
2004 Decree 5300, regulates the National CZM Plan and other instruments for ICZM
Canada 1991
1997 2002
Atlantic Coastal Action Program (ACAP) Oceans Act
Oceans Strategy
EU 1996 Demonstration programme on ICZM
2000 Water Framework Directive (2000/60/EC)
2002 ICZM Recommendation 2002/413/EC For member states to adopt a National strategy on ICZM.
2008 Marine Strategy Framework Directive (2008/56/EC)
Baltic Sea 2003
2007
HELCOM ICZM Recommendation 24/10 The HELCOM Baltic Sea Action Plan
France 1975 Coastal Conservancy (Law of 10 July)
2002 Reform of the Coastal Conservancy's mission (law of 27 February)
1983 Marine Area Zoning Plan (SMVM) (law of 7 January)
1986 Planning, protection, and development of Coastal Space
IOC member states
1997 Integrated Coastal Area Management (ICAM) programme adopted by the Intergovernmental Oceanographic Commission (IOC)
New Zealand
1994 2008
Coastal Policy Statement (NZCPS) Proposed review of NZCPS
USA 1972 1987
CZM Act
National Estuary Program (NEP), established by the Water Quality Act of 1987
programmes on a European scale are more recent (Humphrey et al., 2000; Shipman and Stojanovic, 2007). The various EU policies and directives emerged as complementary instruments the most important being (Borja, 2006; Ducrotoy and Elliott, 2006; 2008): the Water Framework Directive (WFD) of 2000, the ICZM recommendation of 2002 and the Marine Strategy Framework Directive (MSFD) of 2008. Table 1.1 shows only a brief sample of the programmes adopted within EU. The individual EU member states have different approaches to coastal management with a variety and complexity of coastal management initiatives and legislations (Gibson, 2003; Rupprecht Consult and IOI, 2006; Shipman and Stojanovic 2007). For detailed coastal management initiatives within and across member states refer to van Alphen (1995), Barragán (2003), Eremina and Stetsko (2003), Pickaver (2003), Veloso-Gomes et al. (2003), Anker et al. (2004), Taveira Pinto and Paskoff (2004), Astron (2005), Enemark (2005), Smith and Potts (2005), DOENI (2006), Rupprecht Consult and IOI (2006), WAG (2007), Deboudt et al. (2008), DEFRA (2008). Clark (1996), Kay et al. (1997), Cicin-Sain and Knecht (1998), Hale (2000) and Krishnamurthy et al. (2008) provide detailed ICZM case studies developed worldwide.
For individual ICZM programmes to evolve, comprehensive evaluations are required. It is important that ICZM program output evaluation is combined with ‘state-of-the-coast’
information to show, for instance, whether new program goals may be needed and to allow an ICZM program to evolve to an improved version (Olsen et al., 1997; Hershman et al., 1999; Stojanovic et al., 2004; Billé, 2007). However, most of the evaluation efforts focus on measuring the evolution of the ICZM process outputs (Olsen, 2003; Pickaver et al., 2004; Stojanovic et al., 2004; Billé, 2007). Worldwide and independently of maturity of the ICZM process, there is a lack of measurements of its effectiveness, i.e. of the consequent changes in the state of the coastal systems, its resources and associated benefits (Knecht et al., 1996, 1997; Kay et al., 1997; Olsen et al., 1997; Hershman et al., 1999; Humphrey et al., 2000; Billé, 2007; McFadden, 2007). Table 1.2 presents a synthesis of the few studies that evaluated the effectiveness of ICZM programmes. Among other reasons, the difficulty to select criteria to measure performance of the system stands out. The difficulty stems from (i) unclear set of objectives of ICZM, (ii) complexity of coastal ecosystems, and (iii) data requirements (Burbridge, 1997; Stojanovic et al., 2004). Problems for defining a specific set of indicators for all coastal systems are greater at the national or broader level due to different
Table 1.2. Examples of evaluation of the effectiveness of ICZM programmes.
Programme / Domain Description Source
Perceptions of the performance of 24 state CZM programmes in the USA, undertaken in 1993-1995.
Evaluation was based on a survey about perceived
performance on four major coastal management issues: (1) protection of coastal resources, (2) management of coastal development, (3) improved public access, and (4) reduction of losses due to coastal hazards.
Knecht et al., 1996
USA National CZM effectiveness study, undertaken in 1995-1997
Objective is to determine success of 5 of the core
objectives of the USA CZM Act of 1972: (1) protection of estuaries and coastal wetlands, (2) protection of beaches, dunes, bluffs and rocky shores, (3) provision of public access to the shore, (4) revitalisation of urban waterfronts, and (5) accommodation of seaport development.
Although based on limited data it evaluates programme success based “on-the-ground outcomes”.
Hershman et al., 1999
Tampa Bay Estuary Program (USA)
The programme includes the definition of specific goals to address the identified issues to be managed. Quantitative criteria were selected to evaluate the program outcomes. These include for instance areal extent of seagrasses and populations of birds.
Lewis III et al., 1999
The development of indicators and tools to evaluate ICZM at different levels is ongoing as analysed by Hoffmann (2009). For instance, Cordah Ltd (2001) and Belfiore et al. (2006) consolidated a suite of indicators developed worldwide for ICZM. At the European level assessment tools are also being developed in a collaboration between managers and the research community (Ducrotoy and Elliott, 2006). An important feature of this effort is the inclusion of measurable indicators as common tools to quantify both the progress of
implementation of ICZM and the sustainable development of the coastal zone (Breton, 2006). These worldwide efforts are valuable contributions for making the assessment about the evolution of coastal zones the standard rather than the exception in the ICZM process.
Ecosystem-Based Management (EBM)
Complementary to ICZM, ecosystem-based management (EBM) emerged recently as a scientific consensus that highlights the use of the best available knowledge about the ecosystem in the management of marine resources, with an emphasis on maintaining
ecosystem service functions (Browman and Stergiou, 2005; Murawski, 2007; Murawski et al., 2008; Forst, 2009). The EBM approach recognises the need to consider the cumulative
impacts of the range of activities that act on the coastal ecosystems for its sustainable
in the 1970’s, not specifically related with coastal zones (Slocombe, 1993). Grumbine (1994) and Slocombe (1998) review the origins and principles of EBM and provide lessons for implementing it. An important feature that both authors highlight is that EBM is about integrating environment and development. They emphasise that in the real systems humans are within rather than separated from nature. Slocombe (1998) suggests that an effective EBM (i) starts with a synthesis of information for future research and management, (ii) monitors features to follow changes, (iii) uses local knowledge, and (iv) is practical, and if resources are limited it needs to focus research on knowledge that is meaningful to management. The definition of operational goals is an important challenge for EBM implementation, according to Slocombe (1998). In one of the first references of EBM for coastal zones, Imperial and Hennessey (1996) identified the USA National Estuary Program (NEP) as a promising ecosystem-based approach to managing estuaries. The particularity of NEP is to focus on solutions for problems identified on each estuary (Imperial and Hennessey, 1996). For each estuary is implemented a comprehensive conservation and management plan which contains an action plan to address problems identified and a monitoring programme to measure
effectiveness of activities. Furthermore, the plan sets the funding and the institutional context to implement the estuarine programmes. At the European level, there are also several
Ecosystem Approach to Aquaculture (EAA)
Sustainable development of mariculture represents a particular challenge for coastal
ecosystem and resources managers for the combination of the following reasons (GESAMP, 2001):
Aquaculture relevance for food security (Ahmed and Lorica, 2002);
Rapid growth of aquaculture industry (Duarte et al., 2007a) estimated as about 8.8%
per annum since 1970 (FAO 2006);
Generalised concern that the increasing demand for aquaculture can drive coastal
degradation, such as habitat loss, pollution, overexploitation of fisheries for fishmeal and oil, due to unsustainable aquaculture practices (MA, 2005);
Some aquaculture solutions, including those of extractive species (Neori et al., 2004),
are advocated for mitigating some of aquaculture’s impacts on coastal ecosystems, for instance cultivation of seaweeds and shellfish (Ferreira et al., 2007a; Gren et al., 2009; Stephenson, et al., 2009);
Aquaculture aesthetic impacts cause conflicts with other users of coastal zones
(Dempster and Sanchez-Jerez, 2008; Gibbs, 2009);
Impacts of aquaculture activities are cumulative among farms and additive to the
impacts of other development pressures in the coastal zone, consequently aquaculture development must be addressed beyond the individual farm level, at the ecosystem level (GESAMP, 2001; Ferreira et al., 2008a; Soto et al., 2008);
The future of the aquaculture industry relies on sustainable coastal development
because ultimately it depends on healthy coastal waters (GESAMP, 2001).
For the above-mentioned reasons an ecosystem approach to aquaculture (EAA), integrated with management of other coastal developments, is required for sustaining aquaculture expansion (GESAMP, 2001; FAO, 2007; Soto et al., 2008). According to FAO, EAA is defined as: “An ecosystem approach to aquaculture (EAA) strives to balance diverse societal objectives, by taking account of the knowledge and uncertainties of biotic, abiotic and human components of ecosystems including their interactions, flows and processes and applying an integrated approach to aquaculture within ecologically and operationally meaningful
1.1.2 Role of science for coastal management
The complexity of the phenomena occurring in coastal ecosystems and their management requires the interaction among managers and researchers of a range of disciplines (Fabbri, 1998). The effective integration of science with management is important for better policy formulation and policy-making for achievement of both environmental and development needs and goals (Slocombe, 1993; Peirce, 1998; Turner, 2000; Cheong, 2008). Currently the role of applied environmental science to support coastal management and address legal requirements is increasing (Ducrotoy and Elliott, 2006). In order to communicate science to managers, researchers must follow a problem-oriented approach and distil the outputs into accessible and useful information for managers (Nobre et al., 2005; Dennison, 2008;
Hoffmann, 2009). Such an approach calls for the integration of scientific methodologies and disciplines across different scales (IMPRESS, 2003; McFadden, 2007). In particular, the adoption of an EAA poses several challenges to the scientific community (GESAMP, 2001; Soto et al., 2008). For instance, guidance about more sustainable aquaculture options at the farm level (Neori et al., 2004; Robertson-Andersson et al., 2008; Ayer and Tyedmers, 2009) and understanding of cumulative impacts within coastal ecosystem for determination of, for instance, carrying capacity with respect to aquaculture activity (Ferreira, et al. 2008a). Overall, ecosystem-based tools capable of providing insights about complex ecological processes and interaction with socio-economic systems are valuable to support the sustainable use of high demanded coastal zones. The most commonly applied tools include (Cicin-Sain and Knecht, 1998; Neal et al., 2003): spatial modelling tools, such as geographical
information systems (GIS) and remote sensing; catchment and coastal ecosystem modelling; participatory work with stakeholders; integrated environmental assessment, benefit-cost studies and economic valuation. The aim of these tools is to provide information to the
decision-making process or its evaluation and not to replace decision-makers (Van Kouwen et al., 2008). The enhanced understanding scientific methodologies provide can be particularly useful in conflict resolution processes inherent to ICZM (Fabbri, 1998; McCreary et al., 2001). The development of integrative tools requires the interaction of all stakeholders in order to ensure (Cicin-Sain and Knecht, 1998; Van Kouwen et al., 2008) that (i) tools address relevant issues for coastal management, and (ii) managers can use the tools and their outputs. The state-of-the-art about ecosystem-based tools is detailed in Chapter 6.
pressures, (ii) development of tools to communicate science to managers, and (iii) interaction of coastal environment and socio-economics. These research areas are discussed below.
Increase of knowledge about complex coastal processes
A knowledge gap highlighted as crucial for coastal management is to understand the
cumulative impacts of natural and anthropogenic pressures on coastal ecosystem state, and on the goods and services these areas provide (Halpern et al., 2008). Ecological modelling is recognised as an important tool for coastal management, which can contribute for
understanding coastal ecosystem processes including the above mentioned research gap (Turner, 2000; Fulton et al., 2003; Greiner, 2004; Hardman-Mountford et al., 2005;
Murawski, 2007; Forst, 2009). In particular, more recently the requirement for models at the ecosystem level capable of simulating the cumulative impacts of multiple uses has been highlighted (Fulton et al., 2003; Ferreira et al., 2008a). Nevertheless, modelling approaches that are able to simulate the cumulative impacts of coastal activities on these ecosystems are still at an early stage of development. Such developments are particularly important for determination of ecological carrying capacity required for the sustainable expansion of aquaculture (Ferreira et al., 2008a; Dempster and Sanchez-Jerez, 2008; Soto et al., 2008).
Chapter 2 provides further details about contributions of ecosystem modelling and state-of-the-art of relevant modelling approaches.
Tools to communicate science to managers
Integration and synthesis of complex knowledge from different disciplines into useful
information to coastal managers and the public at large is a progressing and challenging field to environmental scientists (Harris, 2002; McNie, 2007; Cheong, 2008). Integrated
methodologies with ecological models is presented in Chapter 4 (Section 4.1). Because it involves human interpretation, one of the IEA caveats is subjectivity and dependence on the analyst point of view (Tol and Vellinga, 1998). That is a criticism specifically pointed out to the DPSIR approach (Svarstad et al., 2008). Tol and Vellinga (1998) recommend that for the use of IEA full potential the methodologies for integrating knowledge need to improvement. Specifically for the DPSIR, Svarstad et al. (2008) suggest the expansion of the framework to incorporate social and economic concerns, rather than just report about the state of the environment.
At the EU level several tools are being developed, specifically to support implementation of coastal management related legislation and policy (Ducrotoy and Elliott, 2006). Specific examples include: (i) GIS as a decision support tool to be used in the development of the National Strategy for ICZM of the Catalan coast following the EU recommendation (Sardá et al., 2005), (ii) GIS use for division of ecosystems into homogenous management units as required by the WFD (Ferreira et al., 2006; Balaguer et al., 2008), (iii) tool to assist in the classification of marine angiosperms, one of the WFD biological elements for coastal and transitional waters (Best et al., 2007), (iv) benthic community-based biotic indices to evaluate ecosystem status and condition, in support of WFD implementation (Pinto et al., 2009). Borja et al. (2008) reviews at the worldwide level, existing integrative assessment tools capable to support recent legislation developed in several nations to address ecological quality or integrity.
A particular area where efforts need to be developed is the production of methodologies to assess the impacts of the ICZM initiatives on coastal ecosystems (Olsen et al., 1997), including the changes in the benefits these generate. Chapter 3 presents existing methodologies that aim to support sound-decision making.
Interaction of coastal environment and socio-economics
crucial to account for ecosystem goods and services in decision-making (Boissonnas et al., 2002; Lal, 2003; Farber et al., 2006; Costanza and Farley, 2007).
The DPSIR approach results of the effort to integrate the natural and anthropogenic systems, and to combine science with management (Cheong, 2008). DPSIR is a widely used
conceptual framework for integrated coastal management that provides a conceptual scheme of how socio-economic activities interact with the natural systems (Elliott, 2002; Ledoux and Turner, 2002; Bowen and Riley, 2003; IMPRESS, 2003; Bidone and Lacerda, 2004; GTOS, 2005; Hofmann et al., 2005; Scheren et al., 2004; Borja et al., 2006; Nobre, 2009). In simple terms, the DPSIR establishes the link between the human activities (‘Drivers’), corresponding loads (‘Pressures’), resulting changes of the ‘State’ of the ecosystem (i.e. the ‘Impact’) and the actions adopted by the coastal managers and decision-makers (Response). However, this IEA methodology lacks the formal definition of a consistent linkage between ecological and economic indicators over time (Nobre, 2009). The DPSIR approach and the interaction between the natural and anthropogenic systems is further analysed in Chapter 3.
Additionally, the inclusion of the economic component in dynamic ecological models is required in order to simulate the feedback between the ecological and socio-economic systems (Bockstael et al., 1995; Nobre et al., 2009). First attempts to integrate the ecological and economic models date back to the 1960’s (Westmacott, 2001). Currently integrated ecological-economic modelling is an evolving discipline that has increased recently (Drechsler et al., 2007). Several difficulties exist, such as the difference in scales at which normally these two systems are simulated or analysed (Nijkamp and van den Bergh 1997; Turner, 2000; Drechsler and Watzold, 2007; Nobre et al., 2009). Existing efforts for integration of ecological and economic models are detailed in Chapter 5.
1.2
Thesis overview
1.2.1 Objectives
useful knowledge for environmental problem solving, and this is also true with regards to coastal zones (Dennison, 2008). Managers and policy-makers require analytical and
assessment methodologies capable of (i) generating understanding about coastal ecosystems and their interaction with the socio-economic system, and (ii) synthesising research outcomes into useful information in order to define effective responses and evaluate previously adopted actions (McNie, 2007; Stanners et al., 2008).
This thesis aims to contribute to research on the assessment of changes in coastal ecosystems and in benefits generated due to management actions (or lack of actions). The overall
objectives are to (i) assess the ecological and economic impacts of previously adopted policies as well as future response scenarios, and (ii) translate the outcomes into useful information for stakeholders with a management role.
Table 1.3. Key stages of the integrated ecological-economic modelling and assessment methodology development.
Development stage
Methodology Discipline Spatial scale Event analysis
MD1 & A2 Multilayered ecosystem model (MEM)
Natural sciences Ecosystem (catchment-coastal)
Forecast
MD1 & A2 Ecological-economic assessment
methodology (EEAM)
Natural sciences and socio-economics
Ecosystem (catchment-coastal)
Hindcast
Ecosystem Approach to Aquaculture:
A2 MEM + EEAM Natural sciences and socio-economics
Ecosystem (catchment-coastal)
Hindcast / Forecast
A2 EEAM Natural sciences and
socio-economics
Individual farm Forecast
MD1 & A2 Dynamic ecological-economic model
Natural sciences and socio-economics
Ecosystem Forecast
1MD – methodology development; 2A – application of methodology.
model, and (ii) provide an explicit link between ecological and economic information related to the use and management of a coastal ecosystem within a specific timeframe. To address the challenges of sustainable aquaculture research and management and, specifically, to support an ecosystem approach to aquaculture, the multilayered ecosystem model and the ecological-economic assessment methodology are used both in combination and individually. Finally, the ecological-economic link is dynamically coupled, in order to take into account feedback between the ecological and economic systems.
1.2.2 Study sites
The research work used different study sites (Figure 1.1) for the application of the various methodologies. The rationales for study site selection were the different requirements of each methodology, the characteristics of the study sites and the available dataset, as described next.
Figure 1.1. Study sites.
The main study site was a Chinese bay, the Xiangshan Gang, with a large amount of