THIS REPORT WAS PREPARED BY ANA RITA MIRANDA, A MASTERS IN FINANCE STUDENT OF THE NOVA SCHOOL OF BUSINESS AND
ECONOMICS, EXCLUSIVELY FOR ACADEMIC PURPOSES.THIS REPORT WAS SUPERVISED BY ROSÁRIO ANDRÉ WHO REVIEWED THE VALUATION METHODOLOGY AND THE FINANCIAL MODEL. (SEE DISCLOSURES AND DISCLAIMERS AT END OF DOCUMENT)
See more information at WWW.NOVASBE.PT Page 1/33
M
ASTERS IN
F
INANCE
E
QUITY
R
ESEARCH
As a result of EDP’s privatization process, China Three Gorges (CTG) acquired a sizable position in EDP’s capital structure with positive impacts on share prices (+9.53%) and financing requirements. CTG is identified as an important strategic partner that facilitates access to alternative markets and potential joint-participations in other investments.
The Iberian market (MIBEL) is becoming fully integrated with lower days of market splitting in 2013. This imposes more efficiency to companies in production and increases the importance of possessing the “right” source of production. EDP has under construction six hydro power plants with a total installed capacity of 1,697MW.
Iberian activities have recently suffered due to changes in regulation, a direct result of the current economic environment in this region. Major changes include the CMEC remuneration, reduction in remuneration rates of the regulatory asset bases, and the introduction of new taxes such as the energytax of 0.85% of assets. This is a segment with low future growth perspectives.
EDP is currently pursuing the liberalization of its supply activity which will require significantly higher efforts from the company side given increased competition. The company will have to become more dynamic on several fronts in order to maintain its current market positioning. As the actual incumbent, EDP is regarded as having a comparative advantage over its peers. This procedure is expected to conclude in the end of 2015.
Brazil currently poses as a major source of future opportunities given the country’s ever growing market. Demand for energy is expected to increase through the following decades (4.7% per year) in spite of the regulatory system that is currently in place.
Developing economies have displayed environment concerns that have recently led to the increase in Renewables. Based on future EU targets on CO2 reductions and EDPR expansion strategy, EDP has much to gain from this segment.
Our Target price is €2.86 and the recommendation is to Hold.
Company description
EDP is an electric utility company founded in 1973 operating worldwide. Currently, EDP is a group of companies operating throughout the value chain of electricity. It also operates in the gas segment and in the renewable sector. It is the major electricity company in Portugal.
EDP
–
E
NERGIAS DE
P
ORTUGAL
C
OMPANY
R
EPORT
“
E
LECTRIC
U
TILITIES
”
06
J
ANUARY2014
A
NALYST
:
A
NA
R
ITA
M
IRANDA
[email protected]
Time of Changes
Challenging Liberalized Markets
Recommendation: Hold
Vs Previous Recommendation HOLD
Price Target FY14: 2.86 €
Vs Previous Price Target 2.86 €
Price (as of 3-Jan-14) 2.69 €
Reuters: EDP.LS, Bloomberg: EDP.PL
52-week range (€) 2.22-2.82
Market Cap (€m) 9,704
Outstanding Shares (m) 3,627.3
Source: EDP and Bloomberg
Source: Bloomberg
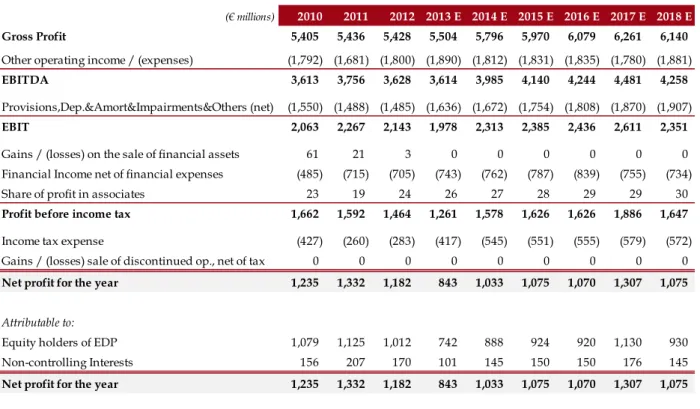
2012 2013E 2014E Revenues (€ millions) 16,340 16,992 15,851 EBITDA (€ millions) 3,628 3,614 3,985 Net Profit (€ millions) 1,182 843 1,033
EPS (x) 0.32 0.24 0.28
P/E (x) 8.84 12.40 10.12
Net Debt/EBITDA (x) 5.19 5.09 4.22 Debt/Assets(x) 0.48 0.48 0.45 EV/EBITDA (x) 9.18 9.22 8.36
ROA (x) 2.77 1.98 2.51
Source: EDP and Nova Research Team 50
70 90 110 130 150
Dec-08 Dec-09 Dec-10 Dec-11 Dec-12 Dec-13
EDP – ENERGIAS DE PORTUGAL COMPANY REPORT
PAGE 2/33
Table of Contents
1.
COMPANY OVERVIEW ... 3
COMPANY DESCRIPTION ... 3
SHAREHOLDER STRUCTURE ... 4
2.
MARKET OVERVIEW ... 6
ELECTRICITY IN THE WORLD AND IN EUROPE ... 6
ENERGY IN THE WORLD ... 7
CO2EMISSIONS ... 8
3.
VALUATION ... 8
4.
GENERATION IN IBERIA ...11
Valuation ... 13
5.
DISTRIBUTION IN IBERIA ...15
6.
SUPPLY IN IBERIA ...18
Valuation ... 19
7.
GAS IN IBERIA ...22
Valuation ... 23
8.
BRAZIL ...24
Valuation ... 236
9.
RENEWABLES ...27
10.
MULTIPLES’ VALUATION
...28
FINANCIALS ...28
APPENDIXES ...28
EDP – ENERGIAS DE PORTUGAL COMPANY REPORT
PAGE 3/33
1. Company overview
Company description
Energias de Portugal (EDP) is a vertically integrated electric utility company
that operates across multiple sectors. The company was created in 1976 from the merger of 13 public enterprises and experienced significant growth over the next decades. Although the company is smaller than most of its comparables, EDP has one of the highest return on equity (ROE) which is derived from its high leverage, much above its comparables. EDP exhibited stable return on assets (ROA) since 2009 having one of the highest values among the most relevant European competitors.
Sources: Bloomberg, and NOVA Research Team.
The activities of EDP are split across the following sectors: Iberian electricity, Iberian natural gas, Brazil, and Renewables. Since many of these activities are capital intensive (e.g.: electricity production and distribution), EDP is largely affected by regulation and is under the scrutiny of ERSE1.
The electricity sector is comprised by electricity production, distribution, and supply (commercialization). Production is carried out in two different regimes: conventional regime with installed capacity of 13,343 MW, and special regime with installed capacity of 466 MW. The special regime (PRE) has priority dispatch in the electricity markets and it was developed due to the finite character of fossil fuels and the need to diversify energy sources. This regime currently includes mini-hydroelectric2, cogeneration, and biomass and residuals production. For the purpose of this report, the production segment is valued by differentiating the production from regulated and from liberalized production. The share of hydro and wind’s installed capacity has increased, while thermal and combined cycle maintained a stable share of installed capacity. Regarding the
1“
Entidade Reguladora dos Serviços Energéticos” (ERSE) is the Portuguese supervisor for energy services (electricity and gas).
2
Hydroelectric power plants with an installed capacity below 10MW.
Table 1: Comparables' Data
Inst. Capacity
(MW)
Net Debt/ EBITDA
Net D/E
EV/
EBITDA P/E P/ Book
Rating (S&P)
EDP 23.38 5.1 161.7% 8.67 10.00 1.15 BB+
EDF 139.50 2.3 90.4% 5.82 9.59 1.47 A+
RWE 51.98 1.1 77.9% 3.02 179.63 1.53 BBB+
Iberdrola 46.04 4.7 76.7% 9.66 9.89 0.81 BBB
Endesa 39.40 0.1 2.8% 4.23 10.62 0.99 BBB
EDPR 8.15 3.5 57.4% 7.17 24.77 0.58 N.A.
Endesa Iberdrol a
EDF EDP
GDF
EDPR E.ON RWE
0% 3% 6% 9% 12% 15%
100 200 300
R
OE
(Pe
rc
en
t)
Total Assets (€ billions)
Graph 1 - Comparables1\
Source: Bloomberg.
1\ Size corresponds to market capitalization.
0% 1% 2% 3% 4% 5% 6% 7%
2009 2010 2011 2012
Graph 2: Return on Assets (Percent)
EDP Iberdrola
Endesa EDPR
EDF RWE
EDP – ENERGIAS DE PORTUGAL COMPANY REPORT
PAGE 4/33 net production, wind has doubled its weight in total production, while the combined cycle has decreased exponentially. EDP’s distribution of electricity is performed in high, medium, and low voltage and it consist in a large network that covers 223,734 Km in Portugal and 22,986 Km in Spain. Given that these networks imply large investments in fixed assets, the activity is capital intensive and is classified as a natural monopoly that requires the intervention of regulatory institutions in order to establish the remuneration in the segment. The supply activity consists in the commercialization of electricity and it was
originally fully regulated. With the liberalization of the market, the relative size of
regulated and last resort supply (LRS) activities compared to total EDP’s supply
has steadily decreased and it currently accounts for 67% of commercialization in
Portugal and 4% in Spain. EDP’s commercialized a total of 29,603 GWh3 in
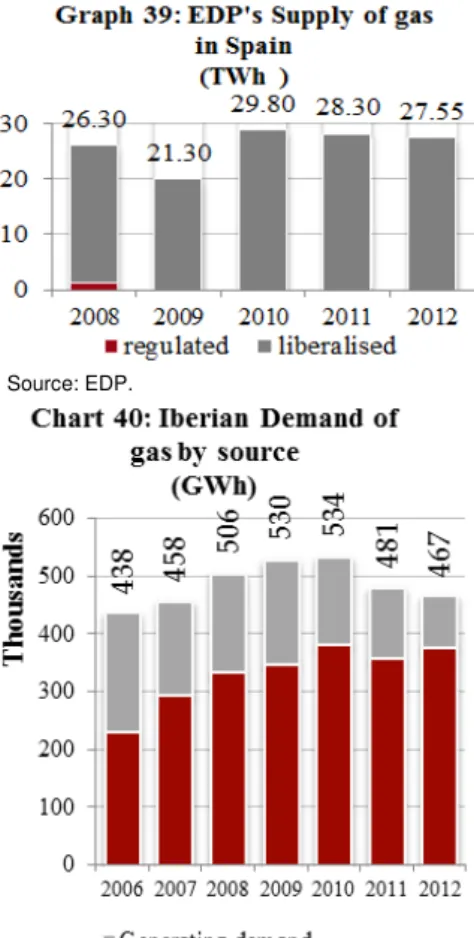
Portugal and 20,252 GWh in Spain, denoting a much larger presence in the Portuguese market given the differences in each country's size and population. The natural gas sector includes storage, distribution and supply with operations in Portugal and Spain. EDP, which is the second largest operator in both markets, can either sell the gas or use it to produce electricity in its CCGT plants. In 2012 EDP supplied more than one million consumers, counted with 14,196 km of distribution grid and commercialized more than 35 TWh.
Similarly to the Iberian activities, the Brazilian sector also incorporates production, distribution and supply of electricity. Production is mostly focused on the conventional regime and installed capacity amounted to 1,974 MW in 2012. Distribution is performed through EDP Bandeirante and EDP Escelsa, and it is characterized by a network extension of 85,749 Km. Supply of electricity in Brazil consisted in 24,923 GWh during 2012 where 63% was regulated.
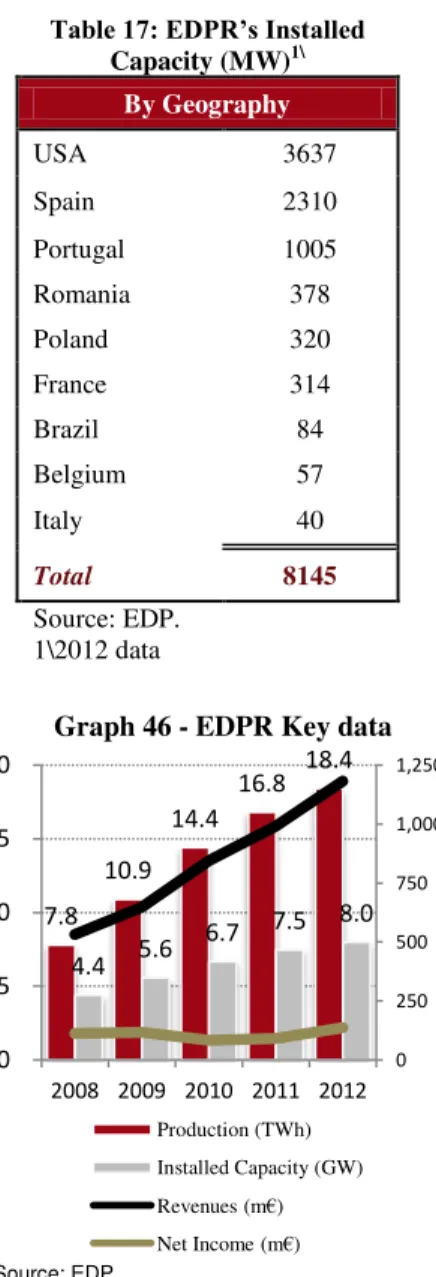
Renewables, operated by EDP Renováveis (EDPR), comprises mainly the wind
generation and amounted to a total of 8,145 MW of installed capacity, being present in Europe, north and south of the American continent. In 2012, EDPR produced 18,445 GWh which were entirely sold due to its priority in dispatch while subject to feed-in-tariffs4.
Shareholder Structure
EDP currently possess a total of €3,656.5 million shares, all of them class A shares5 with nominal value of one euro and fully paid. Its shareholder structure has changed over time mainly through its reprivatization process that began in
3
One Gigawatt hours (GWh) is equivalent to one million kilowatt hours (KWh). One KWh is the output of a power station with an installed capacity of 1KW operating during one hour at its full capacity.
4
Tariff/price entitled to renewables technologies in order to encourage investment in these types of technology. 5
Until recently, there were also class B shares which were the ones to be reprivatized.
13% 9% 0%
10% 20% 30% 40% 50%
2009 2010 2011 2012
Graph 6: Iberian Market Shares (Percent)
Electricity Supply - Market Leader Electricity Supply - EDP Gas Supply - Market Leader Gas Supply - EDP Source: EDP.
-20% 0% 20% 40% 60% 80% 100%
2010 2011 2012 2013E 2014E
Graph 4: Turnover Breakdown (Percent)
Reg. Production Lib. Production
Distribution Supply
Gas Brazil
Renewables Other and Adjustments
-20% 0% 20% 40% 60% 80% 100%
2010 2011 2012 2013E 2014E
Graph 5: EBITDA Breakdown (Percent)
Reg. Production Lib. Production
Distribution Supply
Gas Brazil
Renewables Other and Adjustments Source: EDP.
Source: EDP.
EDP – ENERGIAS DE PORTUGAL COMPANY REPORT
PAGE 5/33 June 1997. This process has been characterized by 8 stages where the most recent and relevant one occurred in October 2011 in which shares detained by Parpública6, a public holding that owned golden-shares at EDP7, were sold in two phases.
The first phase included a sale of 21.35% of capital which was acquired by China Three Gorges (CTG), a Chinese government owned company operating in the energy sector with an installed capacity of 74.8GW. This transaction amounted to
€2.7 billion that represents a price per share of €3.45 and a premium of 53%8
, with a positive impact on market share prices of €0.22 (+9.53%) through the following two weeks9.CTG’s entry into the company’s capital is perceived positively given the significant share price appreciation that has been observed since the transaction. For instance, during the last two years EDP’s stock price has increased by 23.86%, amounting to 11.29% per year.
The second phase took place in February 2013 where the remaining Parpublica’s stake of 4.14% was sold as free float given that an agreement with CTG was not achieved. This stake was sold at a price of €2.35 per share, which represented a discount of 2.97% compared to the previous day’s closing price. After the sale EDP’s shares experienced a decline of 8% that took approximately one month to recover from.
CTG’s strategy lies in renewable energies and aims, with the investment in EDP, to become a strategic partner in this field. This led to its current agreement that includes a 4 year lock-up and standstill period by CTG which, in addition to a granted credit facility of €2 billion for a maturity of 20 years, contributed to stabilize the shareholder structure and improve EDP’s liquidity position which is very important due to the recent financing restrictions that Portuguese corporations have experienced.
In 2011 it was estimated that EDP needed refinancing of about €2.6 billion per year during three years10. Furthermore, 2011’s annual accounts also indicated debt repayments of €3.0 billion in 2012, and €2.7 billion in 2013. This entire standing improved due to CTG’s entry and current EDP estimates suggest that no more refinancing will be required until the end of 2014.
EDP is presently pursuing a deleveraging strategy and aims to achieve the target of three times the debt-to-EBITDA ratio by 2015. The agreement has also settled the purchase of minority stakes by CTG in the renewable sector. This gives EDP
6
DL 106-A/2011, from October 26th, in which the disinvestment of Parpublica in EDP has been authorized. 7
Golden shares gave the right of veto regarding some matters. 8
According to recent news, this premium was based on expected standstill regulatory environment. 9
Increase from 22 of December 2011, when the purchasing was agreed, until 2 of January 2012. 10 Financial Times. 1.55% 2.47% 1.74% 0.0% 1.0% 2.0% 3.0% 0 200 400 600 Net Generation (TWh) Net Consumption (TWh) Installed Capacity (GW)
Graph 7: EDPB and Brazilian Market (Percent)
Brazil % EDPB
Sources: EDP, World Bank, and NOVA Research Team. 7.99 0 2 4 6 8 10 12 14 Ib er d ro la ED P R ED F R W E F er sa En er g ia s R en o v ab le s
Graph 8: Wind Installed Capacity (GW)
Sources: EDP, Iberdrola, EDF, RWE, Fersa Energias Renovables, and NOVA Research Team.
Table 2: Shareholders' Structure
SHAREHOLDERS %
Capital
China Three Gorges 21.4%
Oppidum 7.2%
Iberdrola Energia S.A.U. 6.7% Capital Group Companies, Inc. 5.0% José de Mello Energia, S.A. 4.6% SENFORA SARL 4.0% Grupo BCP; FP do Grupo BCP 3.4%
Sonatrach 2.4%
Qatar Holding LLC 2.3%
Massachusetts Financial
Services Company 2.2%
BlackRock, Inc. 2.0% Banco Espírito Santo, S.A. 0.3% EDP (Treasury Stock) 0.8% Free Float 38.5%
Total 100.0%
EDP – ENERGIAS DE PORTUGAL COMPANY REPORT
PAGE 6/33 the opportunity to become more active in the upside potential of the growing Chinese market as well as a joint-participation in other investments as are the ones recently announced in Africa and Brazil11.
2. Market Overview
Electricity in the World and in Europe
World’s installed capacity is expected to grow at an average rate of 1.6% per
year from 2010 until 2040 but with significantly different growth rates across regions. OECD countries are expected to grow at an average of 0.9% per year, while non-OECD countries are expected to grow at 2.3% on average, with Brazil and China in the leading positions. This denotes a clear discrepancy between developed and developing or emerging economies. In absolute values OECD countries remain fairly stable in regards to total installed capacity, whereas non– OECD greatly increase their share and China alone represents 27.4% of world’s total installed capacity in 2040.
Regarding the world’s total generation of electricity it is forecasted to increase by an average of 2.2% per year from 2012 to 2040, which is slower than the preceding 7 years in which the average rate was 3.1%. This implies a change in the sources’ shares over time. For instance, coal is forecasted to lose 4 percentage points between 2012 and 2040 whereas renewable sources increase from 19% to 25% and natural gas from 20% to 24%.
World Demand12 exhibits an expected growth rate of 2.2% from 2010 until 2040 but with differences across regions. OECD countries present an average growth rate of 1.1%, with US and OECD Europe both under the average with 0.8% and
11
Recent articles on newspapers (e.g.: Jornal de Negócios). 12
We used net generation as a proxy for demand.
17.33
21.41 25.37
39.03
0 5 10 15 20 25 30 35 40 45
2005 2010 2015 2020 2025 2030 2035 2040
T
h
o
u
s
a
n
d
s
Chart 10: Electricity Generation by Fuel ('000 TWh)
Oil and other liquids Coal Nuclear Natural gas Hydro Wind Solar Other
2% 5%
39%
16%
40%
36%
4% 3%
14% 20%
38% 13% 15%
6% 17%
11% 23% 17%
21% 17%
24%
0 75 150 225 300 375 450 525 600 675 750 825
1990 2000 2010 2020 2030 2040
Chart 11: World Energy Demand (Quadrillion Btu)
Non-OECD OECD
Source: EIA.
Source: EIA. 0 2 4 6 8
2005 2010 2015 2020 2025 2030 2035 2040
T
h
o
u
s
a
n
d
s
Chart 9: Installed Capacity by Region/Country (Gigawatthour)
US OECD Europe Other OECD China Brazil Africa Other Non-OECD
OECD Non-OECD
EDP – ENERGIAS DE PORTUGAL COMPANY REPORT
PAGE 7/33 1.0%, respectively. Non-OECD countries present an expected growth rate of 3.1% with China above average (3.7%) and Brazil and Africa both with 3.0% growth rates.
Energy in the World
World’s consumption of energy, which encompasses natural gas, coal, oil, nuclear and others, presents the same trend. Non-OECD countries exhibit exponential grow while developed countries experience a more moderate growth.
Coal
Coal consumption is expected to increase by an average of 1.3% although the increase is driven by developing countries, mainly in Central and South America and Asia. Developing countries are expected to decrease its consumption. Coal used for electricity generation is expected to decrease its proportion in total generation while increasing its absolute value which implies a significantly higher growth for alternative inputs. On a side note, coal prices are expected to grow at an average rate of 3%, according to the U.S. Energy Information Administration outlook (EIA).
Natural Gas
Total natural gas consumption is expected to increase by an average rate of 1.3% per year, again driven by developing countries. Some of the natural gas consumption will be in production of electricity, which is expected to increase both in total share of generation and absolute value. As a fossil fuel natural gas reserves are claimed to be finite and we will eventually become unable to extract it. Nevertheless, technological advancements, new transformation processes, and even the appearance of new theories suggest that these inputs are not as finite as it was believed.
Natural gas consumption in electricity production will also depend on its relative price to other energy sources. Its price has been decreasing remaining at low levels but it is expected to increase at 3.4% yearly average until 204013.
Nuclear
Nuclear consumption is expected to experience a high increase (2.5% average per year) for which the major contributors are China, Europe and America, with a combined consumption of 62% of total consumption in 2040.
Nuclear plants are on average one of the most efficient forms of production with low marginal costs of production. Nevertheless, it is a very capital intensive type
13
EIA, Annual Energy Outlook (AEO), 2013. Source: EIA.
125 150 175 200 225
2009 2010 2015 2020 2025 2030 2035 2040
Chart 13: World Coal Consumption (Quadrillion Btu)
0 4 8 12 16
Chart 14: Henry Hub Natural Gas Spot Prices
(USD/MMbtu) Source: EIA.
Source: Bloomberg. 0
10 20 30 40
T
ho
us
a
nd
s
Chart 12: Net generation by Region/Country
(Billion KWh)
US OECD Europe
Other OECD China
Brazil Africa
Source: EIA.
100 120 140 160 180 200
2009 2010 2015 2020 2025 2030 2035 2040
Chart 15: World Natural Gas Consumption (Trillion cubic feet)
EDP – ENERGIAS DE PORTUGAL COMPANY REPORT
PAGE 8/33 of production with some environmental concerns, mainly after the incident in Fukushima, Japan.
CO
2emissions
Concerns about the environment have been growing around the world, which has implications on the decision of each source of energy to use. The European
Union (EU) has established targets for 2020 currently called “20-20-20”14, in
which the ambition is to reduce by 20% greenhouse gas emissions (versus 1990), to increase to 20% consumption of renewable sources, and to reduce by 20% the use of primary energy (versus 2007). The EU is also committed to a “low-carbon economy” and until 2050 aims to reduce greenhouse gas emissions to 20% of 1990 levels15.
This might have implications in the CO2 prices and consequently in the decisions of the companies in regards to energy source selections and investment valuations.
3. Valuation
The valuation of the company is done through a Sum of the Parts approach where each business is valued separately. A Discounted Cash flow model is applied for each segment where the Free Cash Flow (FCF) is discounted at the Weighted Average Cost of Capital (WACC), a measure that captures each business’ risk.
To compute the WACC there are three major terms to be considered: the cost of debt, the cost of equity and the target debt-to-equity ratio.
In regards to the cost of debt, EDP can finance itself as a whole which offers better conditions than separate financing for each business unit. Therefore, the cost of debt was computed for the whole company and considered equal across units. Nevertheless, in order to reduce exchange rate risk the company borrows in local currencies (e.g.: euros, Brazilian reais and US dollars). This cost was computed using two different approaches.
The first approach determines the cost of debt by adding the risk free rate to a spread based on the rating of the company. EDP’s rating is currently BB+ which corresponds to a spread of 3.00%16. For the risk free we have considered an
14
European Directive 2012-727/EU. 15
This vision incorporates intermediate milestone goals of 60% by 2030 and 40% by 2040.
16 Data collected by Aswath Damodaran, a Professor of Finance in Stern School of Business at New York University.
2,000 3,000 4,000 5,000 6,000
2009 2010 2015 2020 2025 2030 2035 2040
Chart 16: World Nuclear Consumption (Billion KWh)
860
690 670
400
0 200 400 600 800 1000
Coal Gas oil Fuel Oil Natural Gas
Chart 17: Implied GHG emissions from electricity generation
(CO2/KWh)
Source: EIA.
Source: “CO2emissions from fuel combustion”, 2012
Edition, IEA.
EDP – ENERGIAS DE PORTUGAL COMPANY REPORT
PAGE 9/33 historical average of the 10 year German bond for the Iberian activities (2.36%). These computations provide a cost of debt of 5.36%. For the particular case of Brazil where activities are accounted in Brazilian reais the risk free was determined using the covered interest rate parity17, with the 10 year German bond, the current exchange rate, and the 5 year forward exchange rate. We have also looked at the inflation rate differential between these two countries. For this valuation, the risk free rate for Brazil is considered 4.96%.
The second approach takes into account EDP’s current 10 year yield from a zero coupon bond, along with the historical probability of default and recovery rates of companies with similar ratings18. EDP’s 10 year yield currently stands at 4.47%, and the probability of default and the recovery rates of BB+ rated companies correspond to 10.51% and 70.70%, respectively. This computation provided a cost of debt of 4.82%. For the purpose of the valuation we shall rely on the second approach as it is more detailed.
Even though the risk free rate is considered to be different in Brazil, the cost of debt will be considered the same as we are using the method based on market yields and default rates.
Since we utilize a sum of the parts approach, the cost of equity was determined with the intent of valuing each segment separately. The basis of our approach lies on CAPM19. However, since company returns only yield aggregated results, we rely on comparables to assess the systematic risk of each activity. This is not a straightforward task as the majority of companies do not operate in one single business. Therefore, we define comparables as companies that, while still possessing activities throughout the entire value chain, tend to emphasize a particular segment, while having a similar size, and rating20. We can find in the Appendix 2 more details on this selection.
17
( ) where stands for the domestic interest rate and for the foreign interest rate. 18
, where corresponds to the market yield of a 10y zero coupon bond, to the probability of default of BB+ rated companies, and to the recovery rate of BB+ rated companies.
Moody’s Investors Service. February 2009. “Corporate Default and Recovery Rates, 1920-2008.”
Standard&Poors. March 2011. “Default, Transition, and Recovery: 2010 Annual Global Corporate Default Study and Rating Transitions”.
19
Capital Asset Pricing Model (CAPM), used to compute the expected return of the asset using the following equation:
( ) to estimate the parameters. This methodology only takes into account the systematic component of risk as investors are capable of diversifying the firm specific risk. We used ( ) where CRP stands for the country risk premium.
20In “Principles of implementation and best practice for WACC calculation”, Independent regulators Group, 2007 Table 3: Default Spread
Spread
A 1.00%
A- 1.30%
BBB 2.00%
BB+ 3.00%
BB 4.00%
B+ 5.00%
Source: Damodaran.
Cost of Debt using EDP’s 10y yield, probability of default and recovery rates.
EDP – ENERGIAS DE PORTUGAL COMPANY REPORT
PAGE 10/33 For each segment we have estimated the unlevered beta through the average of comparables which was later relevered21 through the market debt-to-equity ratio. Current market debt-to-equity ratio was determined at 2.1. Nevertheless, the target lies below this number as EDP is pursuing a deleveraging strategy with a target ratio of 2.0.
Market risk premium is assumed to be 5.7022 in accordance with literature. Country risk premium (CRP) was computed using Credit default swaps (CDS)
and the relative weight of standard deviation of equities and bonds in the local market. We have also looked at local and global market variances to have a better sense of the value for CRP23.
For the perpetuity we used the NOPLAT of the last year of the explicit period, the growth rate for each economy, and the perpetuity formula24.
For the growth rate, we have considered an inflation rate of 2% for Europe, consistent with European Central Bank’s long-term strategy25
and for Brazil an inflation rate of 4.5%, which is consistent with the International Monetary Fund’s (IMF) projections for medium term and also according to Brazilian’s Central Bank target for inflation26. For the real growth rate we have looked at the projected real GDP growth of the IMF, where we identify long-term growth of 1.8% in Portugal, 1.2% in Spain and 3.5% in Brazil.
21
* +, although the implicit is not equal to zero, we currently face a situation where the risk free rate is significantly below its historical value. This leads to an exaggeration in computations.
22 “Market Risk Premium and Risk Free Rate used for 51 countries in 2013”, 2013, Pablo Fernan
dez, Javier Aguirreamalloa and Pablo Linares.
d as being the most probable value for market risk premium.
23Systematic Country Risk Modulator in “Practical Approach for Quantifying Country Risk”, Jaime Sabal, ESADE.
24
To compute the perpetuity value we used: ( )
, “Valuation”, McKinsey
&Company, Tim Koller, Marc Goedhart, Daviv Wessels, p.113. 25
According to the IMF, until 2018 it is expected an average inflation rate of 1.4% for Portugal and 1.5% for Spain, but we have considered the long term expectations for the euro area.
26
Recent inflation rates in this country have been historically high, registering in 2012 an inflation of 5.84% (according to the Brazil Central Bank).
Target D/E 2.00
Rd 4.82% Portugal 3.00% Portugal 3.25% Portugal 29.5%
rf (€) 2.36% Spain 3.00% Spain 3.10% Spain 30.0%
rf (br) 4.96% Brazil 5.00% Brazil 4.82% Brazil 34.0%
Regulated production
Liberalised Production
Distribution Portugal
Distribution
Spain Supply Portugal Supply Spain Gas Brazil
0.420 0.505 0.660 0.629
1.012 1.215 1.024 1.020 1.470 1.464 1.586 1.460
Re 11.4% 12.5% 11.4% 11.3% 14.0% 13.8% 14.9% 18.1%
WACC 6.06% 6.43% 6.08% 6.01% 6.93% 6.85% 7.21% 8.15%
WACC Valuation
Table 4: Valuation Inputs
Country Risk Premium (CRP)
Nominal growth rate (g) Marginal Tax Rate
0.425 0.610
Beta Unlevered
Country risk premium computed using Credit default swaps
EDP – ENERGIAS DE PORTUGAL COMPANY REPORT
PAGE 11/33
4. Generation in Iberia
Portugal and Spain started to build an integrated market and since July 2006 the Iberian market for electricity (MIBEL) is functioning. MIBEL works based on two parts: OMIP in Portugal and OMEL in Spain, where OMIP supervises the forward/future market and OMEL operates the daily and intra-day market (spot market). The participants are Spanish and Portuguese companies and the price is equal across the pool. Although MIBEL aimed to be a fully integrated market there is operational problems in terms or connections between these two countries. Currently, the capacity of the connection is 1600MW from Spain- Portugal and 1300MW from Portugal-Spain, with the goal of increasing it to 3000MW in both directions by 2014. A major problem with these connections is that they often become congested, which causes a market split and two distinct markets with differentiated prices arise. In 2013 there were 50.3% of days where the price was not different, 31.9% where the price in Spain was higher than in Portugal and 17.8% where the price in Portugal was higher than in Spain27. Over time the market became more integrated as shown by the diminishing of market split days and the decrease in market prices across the two countries. In addition, there are issues related to regulated production that is not included in supply which distorts the price obtained there. Nevertheless, in what concerns production, the relevant market is Iberia28.
The production of electricity can be done in two regimes: ordinary regime of production (PRO) and PRE, where PRE includes mini-hydro, cogeneration, biomass and waste and PRO includes all the other forms of production. Aside from the requisites necessary to be classified as PRE, this production has priority in selling. In Portugal, the LRS, operated by EDP Universal, S.A. is obliged to buy all this production29. In Spain, the system is similar but all the PRE production is fully absorbed. PRE price is pre-determined by law, and even though PRE production can be sold to someone other than the LRS, there is a floor and a maximum to pay to these producers.
In 2012, EDP registered a production in Portugal of 17,017GWh from 9.927MW of installed capacity. Regarding Spain, the total production was 10,080GWh with 3,882MW of installed capacity. As of December 2012, PRE installed capacity in Iberia totalled 466 MW which represents 3.4% of total capacity, and 2,247 GWh of production, representing 8% of total production. In addition to the split of PRO
27
Source: OMIE, data until mid-December. In 2012 the numbers were: 68.5%, 0% and 41.5%, respectively. 28
Regarding supply, the two markets will be considered separately as each country has its own specificities and different correlations to the key value drivers.
29
According to Decree-Law 172-2006 which establishes the duties of the Last Resort Supplier.
0% 10% 20% 30% 40% 50% 60%
0 1 2 3 4 5 6
2008 2009 2010 2011 2012
Graph 17: Mibel statistics
Market Price Spread (Pt-SP) % of Market Split
Long term growth rates using IMF projections
EDP – ENERGIAS DE PORTUGAL COMPANY REPORT
PAGE 12/33 and PRE production, we also have a special situation in Portugal, where some of the PRO production is remunerated under CMEC compensations (costs with the maintenance of contractual equilibrium, the old PPA – power purchase agreement – with a real pre-tax return on assets of 8.5%) and market conditions production.
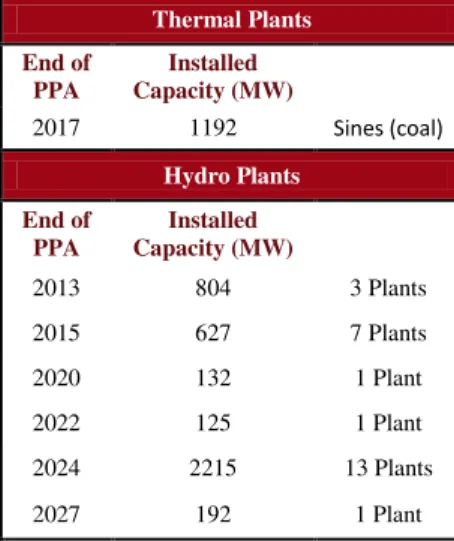
CMEC compensation, which has been legally defined by DL 240/2004, is in place for 26 power plants with a total installed capacity of 5,287MW and will last until 2027. The transition of CMECs to liberalized conditions will have significant developments in 2013 and 2015 where 27% of the installed capacity will switch, and 2024 where 42% will also shift. Other years only have residual transitions to the liberalized status.
The CMEC scheme comprises two periods. The first period will be in place until 2017 in which EDP operates in the free market but its remuneration is predetermined30, that is, EDP receives the market price from the Iberian pool but has to compensate the government if revenues under CMEC are below (has to pay the government) or above (has to receive from the government) market revenues. From 2017 on, there will be no more compensation with the government and the risk is fully absorbed by EDP. The CMEC formula relies on a fixed amount per year plus a parcel with three components that are often revised31. The CMEC base – the difference between NPV of PPA and NPV of CMEC – is currently at €0.8billion and it has been revised downwards in about
€13 million32
of annual revenues as agreed in the Memorandum of Understanding (MoU) between the Portuguese authorities and the IMF. This was achieved through a change in the rate of tariff repercussion for contractual balance33. Therefore, although we expect stable FCFs, we need to anticipate potential changes such as the ones introduced by the financial assistance program.
The mix of production is 34% hydro, 33% wind, 17% CCGT and 16% from other sources, where “clean” production is clearly the major source of production, amounting to 67% of total production. EDP’s strategy is to increase the share of clean production to 73% by 2015, for which it will contribute the already in construction six hydro power plants that shall be commissioned in 2014-2016. These plants imply a total investment of €2 billion.
30
Remuneration is predetermined in order to decrease market imperfections. If the supply is in the free market, even though the company does not receive the market price, it will be determined as if the company is offering in the market. 31
Availability of power plants, market gross margin adjustment, and power services revenues. 32
The value is an estimation of reduction per year which, according to EDP has a PV of 120 million. The reduction will be in place until 2027.
33
Portaria 145/2012. Table 5: Power Plants under PPA/CMEC
Thermal Plants
End of PPA
Installed Capacity (MW)
2017 1192 Sines (coal)
Hydro Plants
End of PPA
Installed Capacity (MW)
2013 804 3 Plants
2015 627 7 Plants
2020 132 1 Plant
2022 125 1 Plant
2024 2215 13 Plants
2027 192 1 Plant
Source: EDP and Research Analyst
Table 6: Installed Capacity in Construction (MW)
MW Start date Ribeiradio 81 2H 2014 Foz do Tua 252 2H 2016
Baixo Sabor 173 2H 2014 Venda Nova III (repowering) 746 2H 2015 Salamonde II (repowering) 207 2H 2016
Fridão 238 2018
So urce: EDP
EDP – ENERGIAS DE PORTUGAL COMPANY REPORT
PAGE 13/33
Valuation
The key value drivers for production activity are evolution of demand, remuneration of regulated production, PRE output, load factors and price in the Iberian pool.
Production evolution is very close to demand evolution, which in turn is tied to GDP variations, population evolution and economy development. For the purpose of our analysis the demand evolution was forecasted using GDP growth as the other variables were not statistically significant34. According to our estimations total production will increase at a slower pace, from 351,079 GWh in 2012 to 374,861 GWh in 2018, which is equivalent to an average increase of 1.1%.
After the estimation of production the company needs to analyze the technology with the lowest variable costs to produce so that it can send selling bids to the market in order to reach the Iberian pool market price. For that, the company needs to estimate the amount of production from each technology according to power plants loads factors35 and the marginal cost per each unit of production. Regarding Load factors we can see that EDP’s implied load factors significantly vary depending on the source. When compared to its peers, EDP faces higher load factors on hydro production, similar load factors on nuclear production and lower load factors on thermal production. Nevertheless, we must be cautious when evaluating load factors given the sizable amount of clean sources of production in EDP. These clean sources not only have priority in the grid, but they also have the lowest marginal costs of production. As a result, they are intensively used with efficiently determined load factors. Opposite to this thermal plants will only be used when other sources cannot fully sustain demand and the resulting load factors will be much lower than what they could potentially be. The analysis is different when the decision concerns the type of technology to build. For this case we must look at the levelized cost of energy (LCoE) which gives us the “average unit cost per MWh of a payment stream that has the same present value as the total cost of building and operating a generating plant over
its life”36. This measure gives us the possibility to rank technologies according to cost, which has implications in the decisions for investment37.
34
For more detailed information see Supply valuation. 35
Load factor is the percentage of use of a plant, or in other words, what is the real production compared to the maximum potential. Load factors are calculated as:
. 36“Levelized Cost of Energy Calculation –Methodology and Sensitivity”, Black & Veatch report
37“Electricity Generation Costs”, from Department of Energy & Climate Change from October 2012.
100 200 300 400
Th
o
u
san
d
s
Graph 18 - Gross Production Evolution - Forecast
(GWh)
PT demand SP demand
Total Demand
0% 10% 20% 30% 40%
2009 2010 2011 2012 Graph 20: Hydro - Implied
Load factors
EDP Iberdrola Endesa
0% 20% 40% 60%
2009 2010 2011 2012
Graph 19: Thermal - Implied Load factors
EDP Iberdrola Endesa
Source: NOVA Research Analyst
Sources: EDP, Iberdrola, Endesa, and NOVA Research Analyst
Sources: EDP, Iberdrola, Endesa, and NOVA Research Analyst
0% 20% 40% 60% 80% 100%
2009 2010 2011 2012
Graph 21: Nuclear - Implied Load factors
EDP Iberdrola Endesa
EDP – ENERGIAS DE PORTUGAL COMPANY REPORT
PAGE 14/33 However, it is important to note that these estimations are highly sensitive to its parameters and the evolution of prices (fuel inputs). As such, it is not surprising that gas production in the USA has increased as natural gas prices have decreased. Alternatively, coal is the input that is most sensitive to changes in CO2 costs, followed by gas and coal technology with carbon capture and storage. Therefore the decision of what technology to put at work changes over times as parameters changes.
According to ERSE from 2008 until July 2012, the electricity placed in the grid comprised a large share from PRE followed by nuclear and then hydro38.
Some plants are entitled to receive capacity payments that are payments to compensate the cost of building the plants that work as a backup. As an example, CCGT capacity payment has been revised downwards to €6,000/MW from 2014 onwards.
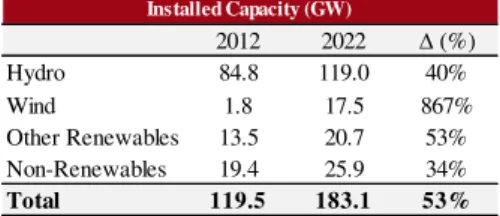
We also believe that CO2 prices will increase as the legislation will become more restrictive and as European directives and objectives of 20-20-20 are put in place. CAPEX is expected to be at €1.6 billion per year from 2013 to 2015 with marginal increases afterwards. EDP might have a competitive advantage since it has the largest part of hydro production and is thus not affected by CO2 prices. CAPEX will mostly comprise maintenance and investments in power plants in order to respond to the small increases in demand. According to “Resolução de Ministros” 20/2013 from April 2013 we expect to increase hydro power to 8536MW until 2020.
Regarding nuclear plants, after the Fukushima disaster in 2011, Spain announced the closing of a nuclear plant. However, recent events show more indecision about the closing which might indicate that nuclear will not be extinguished. Perhaps, the cost will increase by increasing safety obligations in the plants.
Recently a new tax on production and distribution of electricity and gas has been created, amounting to a total of 0.85% of fixed assets. This was created in the context of the financial assistance program.
38“Tarifas e preços para a energa eléctrica e outros serviços em 2013”, from ERSE december 2012. 25 37 21 35 40
150
25 50 60
31 95 80 150 65 0 40 80 120 160 C o al -f ir ed g as-fi re d n u cl ea r w in d mi n i-h y d ro so la r co mb in ed h ea t an d po w er …
Graph 22: LCoE at 5% Discount rate
minimum maximum
35 30 30 45 65 200
30 60 63 50
140 100 70 0 40 80 120 160 C o al -f ir ed g as-fi re d n u cl ea r w in d mi n i-h y d ro so la r co mb in ed h ea t an d po w er …
Graph 23: LCoE at 10% Discount rate
Minimum Maximum
€ 0.7
€ 0.6
€ 0.4
€ 0.2
Graph 24: EDP's Capex 2013 (billion €)
Maintenance Wind Hydro Brazil
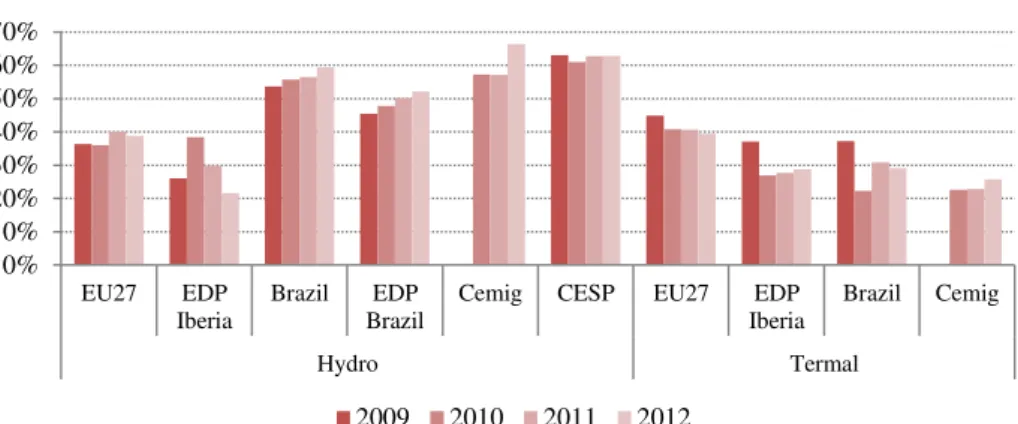
0% 20% 40% 60% 80% 100% 2 0 0 9 2 0 1 0 2 0 1 1 2 0 1 2 2 0 0 9 2 0 1 0 2 0 1 1 2 0 1 2 2 0 0 9 2 0 1 0 2 0 1 1 2 0 1 2
EDP Iberdrola Endesa
Graph 25: Electricity Production
(Percent)
Hydro Thermal Nuclear Other
Source: EIA.
Source: EIA.
Source: EDP.
EDP – ENERGIAS DE PORTUGAL COMPANY REPORT
PAGE 15/33
5. Distribution in Iberia
The next units in the value chain are Transmission and Distribution, which correspond to activities of transportation of the electricity from the production sites to consumers. Transmission is related to higher voltage networks and distribution to lower voltage ones. These two activities are considered natural monopolies, therefore they are regulated and concessions are given to companies. As a regulated activity, tariffs are determined by the supervisor - ERSE in Portugal and CNE39 in Spain – and “regulatory periods” are determined. Distribution in Portugal is characterized by a network of 223,734 km, which has grown at an average of 1.02% since 2009 that disseminated, in gross terms, 48,559 GWh during the year of 2012. The distribution losses registered an average of 7.2% from 2008 to 2012, which is in line with EIA statistics that have estimated for the USA an average of losses of about 7%. EDP operates in high,
39“Comisi
ón Nacional de Energía” (CNE) is the Spanish supervisor for energy services. Table 6: Regulated Production Valuation
(€ millions) 2011 2012 2013 E 2014 E 2015 E 2016 E 2017 E 2018 E
NOPLAT 452 435 418 312 319 289 277 55
Depreciation and Amortization (1) 212 204 232 210 214 198 203 168 Other Adjustments (2)
(1) 163 (2) (2) (2) (2) (2) (2)
Cash Flow from Operations 663 802 648 520 530 486 478 221
CAPEX (81) (95) (190) 890 (165) 623 (158) 1,367
∆ Operating NWC 101 (61) 69 67 (5) 13 (15) 137
Other LT Operating Assets and Liabilities (214) (90) 61 78 65 42 (12) 110
Cash Flow from Investing Activities (195) (247) (60) 1,036 (105) 678 (185) 1,614
FCF 468 556 588 1,556 425 1,163 293 1,835
PV FCF 4,687 t 29.50%
Terminal value (PV)* 2,253 g 3.00%
Value Regulated Production 6,940 0.59 per share WACC 6.06%
(1),(2): See Appendix 1 *until 2027
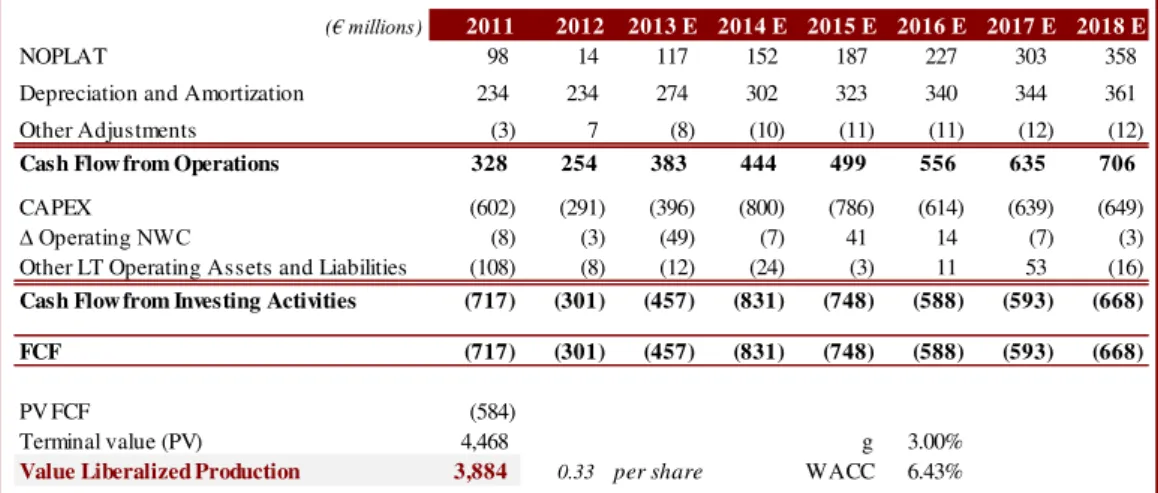
Table 7: Liberalized Production in Iberia Valuation
(€ millions) 2011 2012 2013 E 2014 E 2015 E 2016 E 2017 E 2018 E
NOPLAT 98 14 117 152 187 227 303 358
Depreciation and Amortization 234 234 274 302 323 340 344 361 Other Adjustments (3) 7 (8) (10) (11) (11) (12) (12)
Cash Flow from Operations 328 254 383 444 499 556 635 706
CAPEX (602) (291) (396) (800) (786) (614) (639) (649)
∆ Operating NWC (8) (3) (49) (7) 41 14 (7) (3)
Other LT Operating Assets and Liabilities (108) (8) (12) (24) (3) 11 53 (16)
Cash Flow from Investing Activities (717) (301) (457) (831) (748) (588) (593) (668)
FCF (717) (301) (457) (831) (748) (588) (593) (668)
PV FCF (584)
Terminal value (PV) 4,468 g 3.00%
Value Liberalized Production 3,884 0.33 per share WACC 6.43%
Portuguese Regulator: ERSE.
Spanish Regulator: CNE.
EDP – ENERGIAS DE PORTUGAL COMPANY REPORT
PAGE 16/33 medium and low voltage networks40. The first two types of network concessions are attributed by government while low voltage concessions are agreed between the company and municipalities.
As a regulated activity, this segment is characterized by stable revenues and costs. The Iberian economy has faced a turbulent period during the last five years. Nevertheless, this segment’s EBITDA remained steady, amounting to 17.5% of total EBITDA. Still, the activity is subject to the interference of regulatory actions which may take several forms. We currently stand in the middle of a regulatory period41 and parameters and formulas were established in order to determine the Regulatory Asset Base (RAB), constituting the value base by which companies are remunerated. The Return on RAB (RRAB) is determined by the regulator and uses the WACC methodology, reporting nominal pre-tax remuneration rate. The WACC methodology is used by several regulators, with slight changes in the reporting values. In hopes of comparing regulatory approaches, ERSE compared WACC methodologies across 21 and confirmed that differences are minimal42.
Allowed revenues for 2014 are €3.49 billion and the RRAB is indexed to the Portuguese 5y CDS43 from October in year t-1 to September year t, subject to a floor of 8% and cap of 11%44. The average until September 2013 was 370 basis points which have been decreasing since the beginning of the regulatory period leading to a RRAB of 8.56% (comparable to 10.05% in 2012). ERSE has defined an efficient factor for operational costs and incremental grid costs of 3.5%. Additionally, there is an incentive to reduce losses in distribution.
The Spanish market amounted to a total of 230.278 GWh in 2012, which has varied significantly since 2008 with an annual average decrease of 2% where EDP, through HC Distribución, operated 22.986 km and managed in gross terms 9.337 GWh in 2012. This implies that EDP’s market share was 3.9% in 2012, having remained stable since 2008 where it was closer to 4%. EBITDA also remained stable during these years, amounting to 5% of total EBITDA. Note that losses in the system averaged 3.7% in the latest years which is lower than the Spanish average of 8%45.
Real Decreto 222/2008, 15th of February established the remuneration methodology of the distribution activity in Spain, after RDL 2819/1998, 23rdof
40
These concessions are attributed according to several Decree-Laws, namely DL29/2006 and DL 344-B/82, among others.
41
Regulatory periods last three years. The current one ranges from 2012 to 2014. 42 “Parâmetros de Regulação para o período 2012 a 2014”, from ERSE, December 2011. 43
In the previous regulatory period it was indexed to 10y bonds. 44
Which corresponds to 0.8% and 14.8% CDS average for floor and cap, respectively. 45
World Bank statistics for 2009, 2010 and 2011.
370 390 410 430 450 470
Chart 26: EDP's Operational Costs in Distribution1\
Allowed Costs EDP Real Costs
Source: ERSE. 1\ 2011 Constant prices.
Stable revenues is a characteristic.
EDP – ENERGIAS DE PORTUGAL COMPANY REPORT
PAGE 17/33 Table 8: Distribution in Portugal Valuation
(€ millions) 2011 2012 2013 E 2014 E 2015 E 2016 E 2017 E 2018 E
NOPLAT 300 311 (127) 201 184 189 188 185
Depreciation and Amortization 245 231 288 302 317 334 354 376 Other Adjustments 7 88 (20) (20) (20) (20) (20) (20)
Cash Flow from Operations 551 629 141 483 481 504 522 541
CAPEX (187) (542) (259) (301) (315) (331) (350) (371)
∆ Operating NWC 107 (415) (10) 32 94 (16) 37 63
Other LT Operating Assets and Liabilities (324) (324) (27) 14 38 27 43 (8)
Cash Flow from Investing Activities (404) (1,281) (296) (256) (183) (320) (271) (315)
FCF 147 (651) (155) 227 298 184 251 226
PV FCF 1,061 t 29.50%
Terminal value (PV) 4,897 g 3.00%
Value Distribution Portugal 5,958 0.51 per share WACC 6.08%
December, which regulates the activity through the net RAB. According to RD 9/2013, the remuneration is linked to the 10y government bond plus a spread of 200 basis points and a lag of two years. The remuneration for each company is published every year in Boletín Oficial del Estado (BOE). For 2013 the remuneration of HC Distribución is of €150 million (IET/221/2013, 14th of February).
Spain has tried through a serial of laws to contain the problem of the tariff deficit46, which has reached €26 billion. For instance, the RDL 2/2013 attempted to adopt measures to correct the deviation from revenues and costs to regulated prices, while also changing the rule to update allowed costs. In addition, RDL 9/2013 established new taxes to energy production. Based in all of these changes future regulatory actions are expected.
Valuation
For 2013 the RRAB was established in 8.56% but we expect a decrease since CDS have been decreasing and exhibited an average in the last quarter of 2013 of 360 basis points with a tendency towards 8%. This remuneration currently exceeds our computed WACC since we differentiated in our approach and many of the inputs that the regulators utilized surpassed our figures. Since the remuneration rate exceeds the discount rate, the fair value of the regulated assets exceeds the RAB.
According to ERSE the costs with grid connections range from €7.2 to €23.01 for aerial connections and from €19.55 to €49.15 for underground connections. As we are in a mature market, new connections opportunities are diminishing47. The expenditures are mainly in maintenance CAPEX.
46
The accumulated amount of costs are not reflected in the price paid by consumers which has to be repaid to companies at some point.
47
According to ERSE and EDP Distribuição the number of new connections have been decreasing since 2008.
0 200 400 600 800 1000 1200
Chart 27: CDS 5y (Basis points)
Portugal Ireland
Greece Spain
USA Source: Bloomberg.
Remuneration in Spain is linked to 10y government bond plus a 200 basis points spread
EDP – ENERGIAS DE PORTUGAL COMPANY REPORT
PAGE 18/33
6. Supply in Iberia
The supply activity consists in the service of providing energy to consumers from the moment the electricity goes out of the grid to the moment it reaches houses and other facilities. This activity is not capital intensive as its major investments include electricity measuring devices, marketing and physical facilities to inform consumers. EDP supplies electricity in Portugal and Spain through two regimes: liberalized supply and regulated or last resort supply (LRS), where the latter is operated by “EDP – Serviço Universal” in Portugal and “HC Energía” in Spain. Currently, EDP is the major liberalized supplier in Portugal with a market share of 44% which increased from 40.1% last year48. Other companies in Portugal include Endesa and Iberdrola. In regards to the Spanish market, Endesa, Iberdrola and GNF hold the leading positions and EDP ranks in fourth place49. Overall, this implies that EDP is number three in the entire Iberian market, behind Endesa and Iberdrola50.
Concerning Portugal, as of December 2012 EDP had 6.6 million consumers (87% LRS) and supplied a total of 29,602 GWh (67% LRS). Those large percentages are explained by the process of liberalization which is reaching its final stage. The liberalization has two different paths to differentiate “large” consumers (the ones with contracted power capacity equal or above 10.35KvA51) from “small” consumers. The transitory period for the large consumers started in July 2012, and it will last until the end of 2014, demarking the termination of the transitory tariffs established by ERSE. The small consumers only began the
48ERSE, “Resumo Informativo Mercado Liberalizado –Eletricidade”, August 2013.
49 CNE, “Informe de Supervisión del mercado minorista de electricidad”, junio 2012.
50EDP’s share regarding regulated supply was 31% and regarding liberalized supply 13%, as of December 2012.
51
KvA= 1,000 volt amperes, which is a unit of apparent power, where an ampere measures electrical current and volt measures the electrical potential.
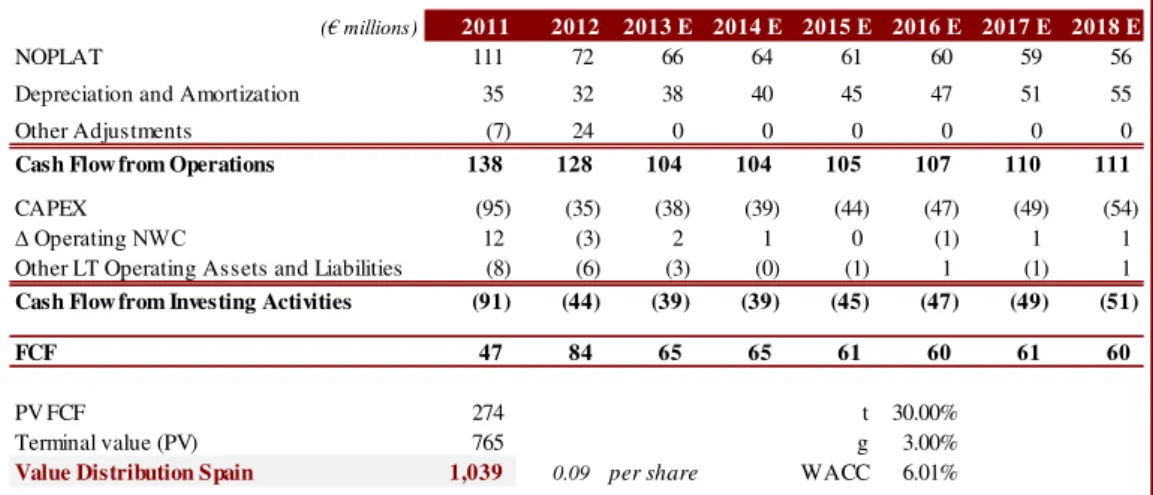
Table 9: Distribution in Spain Valuation
(€ millions) 2011 2012 2013 E 2014 E 2015 E 2016 E 2017 E 2018 E
NOPLAT 111 72 66 64 61 60 59 56
Depreciation and Amortization 35 32 38 40 45 47 51 55
Other Adjustments (7) 24 0 0 0 0 0 0
Cash Flow from Operations 138 128 104 104 105 107 110 111
CAPEX (95) (35) (38) (39) (44) (47) (49) (54)
∆ Operating NWC 12 (3) 2 1 0 (1) 1 1
Other LT Operating Assets and Liabilities (8) (6) (3) (0) (1) 1 (1) 1
Cash Flow from Investing Activities (91) (44) (39) (39) (45) (47) (49) (51)
FCF 47 84 65 65 61 60 61 60
PV FCF 274 t 30.00%
Terminal value (PV) 765 g 3.00%
Value Distribution Spain 1,039 0.09 per share WACC 6.01%
46.24 43.16 39.38 33.71
29.60
0 10 20 30 40 50
2008 2009 2010 2011 2012
T
ho
us
a
nd
s
Chart 29: EDP's Supplied Electricity in Portugal
(GWh)
LRS Liberalised
6.09 6.10 6.11 6.05 6.63
0 2 4 6
2008 2009 2010 2011 2012
M
illi
o
ns
Graph 28: EDP's number of consumers in Portugal
LRS Liberalised
Source: EDP.
EDP – ENERGIAS DE PORTUGAL COMPANY REPORT
PAGE 19/33 transitory period in January 2013 which will have effect until 2015. By 2016 all consumers have to be supplied by a liberalized provider. During the transitory period ERSE updates tariffs every three months and applies a penalty to encourage the change to a liberalized supplier. In December 2012, there were a lot of consumers that had not yet changed, but this penalty initiated the transition and in the first ten months of 2013 2.66 billion consumers contracted a liberalized supplier, which weighted 70.7% of total market and represented one-third of consumers in the LRS as of December 201252. This denotes the rapid change in the market.
Regarding the Spanish market, by December 2012 EDP had 1.05 million consumers (74% in the liberalized market) and supplied 20,252GWh (96.50% in the liberalized market). Contrary to Portugal, Spain started the liberalization process much earlier and has fewer consumers in the regulated regime. In addition, the Spanish regulated regime is not similar to the Portuguese since consumers can only choose to be supplied in the regulated market if they are considered lower voltage consumers53, with no anticipated change to this regime. LRS are determined by the Spanish government law. Overall, EDP’s market share remained stable at around 9% in the liberalized market from 2009 to 2012.
Valuation
The key value drivers of this segment are estimated demand, evolution of market share, consumers’ preferences, evolution of margins, and prices.
Consumption of electricity is strongly connected to economic growth, the Human Development index (HDI), and energy prices. Since the variables are not stationary and co-integrated, we relied on first differences and/or growth rates in order to project consumption54.
Since Portugal recently underwent an increase in the value added tax, from 6% to 23%, we do not have sufficient observations to quantify its impact through dummy variables. As such, this adjustment will be reflected in our underlying price trajectory going forward. Regarding prices’ growth we estimate an average increase per year of 2%55 in the long run. Given the historical high energy prices in Portugal, initial price growth rates will be above this long run threshold but they will slowly converge towards this equilibrium.
52 ERSE 53
Contracted power voltage lower that 10KW Consumers with contracted power voltage above this value have to buy from a liberalized supplier since July 2009.
54
; R2=0.79
; R2=0.49 Data source: IMF, Eursotat, Pordata and INE.
55“World Energy Outlook 2013”, Table A8, page 139, Energy Information Administration.
80.3% 64.9%
51.0%
41.6% 39.5%
11.3% 11.1% 11.4% 10.5%
0% 25% 50% 75%
2008 2009 2010 2011 2012
Graph 30: EDP's Market Share (Percent) Portugal Spain 0 250 500 750 1,000
2008 2009 2010 2011 2012
T ho us a nd s
Graph 31: EDP's number of consumers in Spain
LRS Liberalised
19.75 19.37 21.44 21.36 20.25
0 10 20
2008 2009 2010 2011 2012
T ho us a nd s
Graph 32: EDP's Supplied Electricity in Spain
(GWh) LRS Liberalised 2 9 .6 0 2 5 .8 8 2 0 .7 4 1 9 .3 2 1 7 .7 2 1 8 .2 2 1 8 .7 6 0 10 20 30 40 50
2012 2014 2016 2018
T ho us a nd s
Graph 33: EDP's expected sales in Portugal
EDP – ENERGIAS DE PORTUGAL COMPANY REPORT
PAGE 20/33 When limited to 4 times per year, changes in supplier will not impose costs on consumers which implies a higher propensity for changes in providers and stronger market competitiveness. Nowadays companies offer integrated packs of electricity and gas, and even if a particular company has a worse option for an individual service it can offer a better option for packages of services. This impact will be included in the estimations of margins and sales.
Due to ERSE’s penalty in transition tariffs we believe that only a residual part of consumers will remain in the regulated market and by 2016 all consumers are supplied in the liberalized regime. Note that in Portugal a marginal part of population (estimated in less than one percent) will remain in the regulated supply.
In Portugal prices charged to small consumers are very stable with changes in invoices of about 1.5%. However, the change for large consumers is wider and EDP is not able to offer competitive prices56. Regarding Spain, according to CNE EDP has offered the lowest prices in the first six months of 2012. This is also true for smaller companies and EDP has managed to detain between the third and fourth position for large consumers57.
Changes in consumer’s preferences will take into account the change in propensity to use electric cars and electronic devices. We believe consumers will be more demanding when choosing electronic devices and choose the ones with lower electricity consumptions. However, there is the opposite tendency to use more and more electronic devices (electric intensity of the economy58). The net effect is an increase in demand but at a slower pace. According to a recent study about forecasts of evolutions of electric vehicles in 202059, during 2012 Portugal counted with 1.862 electric vehicles and Spain with 787 which represented 1% and 0.4%, respectively, from all electric vehicles in the world. By 2020 it is estimated that 307,692 electric vehicles will be available in Portugal and 692.307 in Spain which represent 5.3% and 12% from total cars estimated in 2020. Even if electronic vehicles correspond to a market with high potential, large developments are not expected in the near term. Still some companies have launched much more appealing prototypes, with better technology60 and lower production costs, effectively reaching a higher portion of the population.
56
NOVA Research Team simulation through ERSE’s resources. 57
«Informe de Supervisión de las ofertas del Mercado minorista de gas y electricidad recogidas en el comparador de ofertas de la CNE» primer semester de 2012, CNE.
58According to “Electricity consumption forecasting in Italy using linear regression models” by Vicenzo Bianco,
Oronzio Manca, Sergio Nardini, energy 34 (2009) p.1423-1421. 59“Global EV Outlook
- Understanding the Electric Vehicle Landscape to 2020”. International Energy Agency. April 2013, page 10.
60 EIA.
2
0
.2
5
2
0
.0
8
2
0
.1
6
1
9
.3
8
2
0
.4
0
2
0
.7
0
2
3
.4
5
0 10 20 30 40 50
2012 2014 2016 2018
T
ho
us
a
nd
s
Graph 34: EDP's expected sales in Spain
(GWh)
LRS Liberalised
Source: EDP.