John Tengviel
1, and K. Diawuo
21
Department of Computer Science, Sunyani Polytechnic, Sunyani, Ghana
2
Department of Computer Engineering, KNUST, Kumasi, Ghana
ABSTRACT
Mobile Ad hoc Networks (MANETs) are dynamic networks populated by mobile stations, or mobile nodes (MNs). Mobility model is a hot topic in many areas, for example, protocol evaluation, network performance analysis and so on.How to simulate MNs mobility is the problem we should consider if we want to build an accurate mobility model. When new nodes can join and other nodes can leave the network and therefore the topology is dynamic.Specifically, MANETs consist of a collection of nodes randomly placed in a line (not necessarily straight). MANETs do appear in many real-world network applications such as a vehicular MANETs built along a highway in a city environment or people in a particular location. MNs in MANETs are usually laptops, PDAs or mobile phones.
This paper presents comparative results that have been carried out via Matlab software simulation. The study investigates the impact of mobility predictive models on mobile nodes’ parameters such as, the arrival rate and the size of mobile nodes in a given area using Pareto and Poisson distributions. The results have indicated that mobile nodes’ arrival rates may have influence on MNs population (as a larger number) in a location. The Pareto distribution is more reflective of the modeling mobility for MANETs than the Poisson distribution.
KEYWORDS
Mobility Models, MANETs, Mobile Nodes Distribution, Arrival Patterns, Pareto Distribution, Poisson Distribution, Matlab Simulation.
1.
I
NTRODUCTIONMobile Ad-hoc NETworks (MANETs) is a collection of wireless mobile nodes configured to communicate amongst each other without the aid of an existing infrastructure. MANETS are
Multi-Hop wireless networks since one node may not be indirect communication range of other
node. In such cases the data from the original sender has to travel a number of hops (hop is one communication link) in order to reach the destination. The intermediate nodes act as routers and forward the data packets till the destination is reached [1].
network. The network is ad hoc because it does not rely on a preexisting infrastructure, such as routers in wired networks or access points in managed (infrastructure) wireless networks. Instead, each node participates in routing by forwarding data for other nodes, and so the determination of which nodes forward data is made dynamically based on the network connectivity [2]. There are different kinds of routing protocol defined by how messages are sent from the source node to the destination node.
Based on this, it’s reasonable to consider node mobility as an essential topic of ad-hoc network. With an accurate mobility model which represents nodes movement, designers can evaluate performance of protocols, predict user distribution, plan network resources allocation and so on. It can also be used in healthcare or traffic control area rescue mission, and so on.
Ad hoc networks are viewed to be suitable for all situations in which a temporary communication is desired. The technology was initially developed keeping in mind the military applications [3] such as battle field in an unknown territory where an infrastructure network is almost impossible to have or maintain. In such situations, the ad hoc networks having self-organizing [4] capability can be effectively used where other technologies either fail or cannot be effectively deployed. The entire network is mobile, and the individual terminals are allowed to move freely. Since, the nodes are mobile; the network topology is thus dynamic. This leads to frequent and unpredictable connectivity changes. In this dynamic topology, some pairs of terminals may not be able to communicate directly with each other and have to rely on some other terminals so that the messages are been delivered to their destinations. Such networks are often referred to as multi-hops or store-and-forward networks [5].
This paper presents a study on mobile nodes arrival patterns in MANETs using Poisson and Pareto models. Though not very realistic from a practical point of view, a model based on the exponential distribution can be of great importance to provide an insight into the mobile nodes arrival pattern. The section 2 illustrates a brief review on MANETs studies. The section 3 introduces the Poisson and Pareto distribution models. The simulation procedures and considered parameters are presented in section 4. The obtained results are objects in section 5 and the section 6 closes the paper to further research works.
2.
R
ELATEDW
ORKSmobility models such as Random Walk, Random Waypoint, [3, 4], etc. for performance comparison of various routing protocols. The concern with these basic designed models is that they represent a specific scenarios not often found in real lives. Hence their use in ad hoc network studies is very limited. Random Walk or Random Waypoint model though simple and elegant, produce random source of entry into a location with scattered pattern around the simulation area, sudden stops and sharp turns. In real-life, this may not really be the case.
3. M
ODELS OFS
TUDY3.1.
P
OISSONA
RRIVALD
ISTRIBUTION(N
UMBER OFN
ODES)
When arrivals occur at random, the information of interest is the probability of n arrivals in a given time period, where n = 0, 1, 2, . ……n-1
Let be a constant representing the average rate of arrival of nodes and consider a small time interval t, with t 0. The assumptions for this process are as follows:
• The probability of one arrival in an interval of t seconds, say (t, t+ t) is t,
independent of arrivals in any time interval not overlapping (t, t+ t).
• The probability of no arrivals in t seconds is 1- t, under such conditions, it can be shown that the probability of exactly n nodes arriving during an interval of length of t is given by the Poisson distribution law [11] in equation 1:
, where . (1)
The assumption of Poisson MN arrivals also implies a distribution of the time intervals between the arrivals of successive MN in a location.
3.2. PARETO DISTRIBUTION
The Pareto distributions [12-14] are characterized by two parameters: and . Parameter is called shape parameter that determines heavy-tailed characteristics and =1 is called cutoff or the location parameter that determines the average of inter-arrival time.
The node arrival times of the Pareto distribution are independent and identically distributed, which means that each arrival time has the same probability distribution as the other arrival times and all are mutually independent. The two main parameters of the Pareto process are the shape and the scale parameter (x).
For one parameter Pareto ( shape only), the distribution function can be written as equation 2:
, (2)
The pdf is given as in equation 3:
and for the two – parameter Pareto distribution function defined over the real numbers can be written as in (4):
!
" # " $ %
& (4)
Its pdf is given as in equation 5:
!' !
(5)
4. M
ETHODOLOGY4.1. Varying of in Pareto Arrival Distribution
We assume the arrival distribution on the MNs population by using Pareto distributions.
Table 1: Varying parameter values
Scenario 1 2 3 4 5
(B) 0.3 0.
4 0 .5
0. 8
0.9
For the simulations purposes, the varying values are been considered. Heavy-tail is been modeled by a Pareto distribution and the main principle can be attributed to the principle of number of nodes. We have performed the simulations for a wide range of parameter values as in Table 1 for both one-parameter and two-parameter Pareto models.
4.2.
V
ARYING OFA
RRIVALR
ATES FORN
ODED
ISTRIBUTIONThe arrival pattern of mobile nodes has an impact on the performance of the network. In this scope, we have decided to analysis the effect of arrival distribution on the MNs population in a given area by using Poisson distribution as in equation 1.In most real-world MANETs, the node population in an area of interest varies with time. In this simulation, it is therefore necessary to investigate the impact of arrivals of MNs on the MANETs mobility.
The simulation area does not change as the arrival rate changes. The different values of arrival rates being considered in this study are shown in Table 2.
Table 2: Varying Arrival Rates
Scenario 1 2 3 4 5
Arrival rates 0.
3
0. 4
0 .5
0. 8
0.9
0 2 4 6 8 10 12 14 16 18 20 0
0.5 1 1.5
Exponential Distribution
P
D
F
x - Number of Nodes
lam = 0.5 lam1 =0.8 lam2 = 1 lam3=1.5
0 2 4 6 8 10 12 14 16 18 20
0 0.2 0.4 0.6 0.8 1 1.2 1.4 1.6 1.8 2
PARETO PDF
P
ro
b
x - Number of Nodes
B1 = 0.5, k=1 B2 = 0.8, k=1 B3 = 1, k=1 B4 = 1.5, k=1 B5 = 2, k=1
5.
R
ESULTS ANDD
ISCUSSION5.1. Comparative Study using Pareto Arrival Pattern
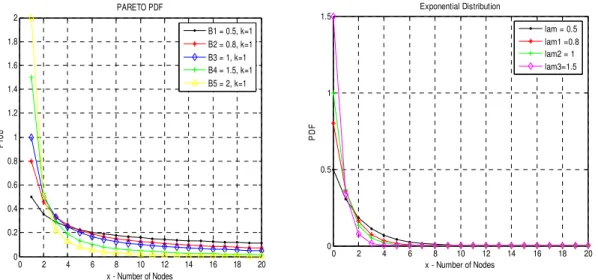
In this section, the effect of arrival rates on MNs distribution and population in a defined location is analyzed as shown in Figure 1. It was observed that the various arrival rates increased the number of MNs also increased but to a certain limit. It is therefore the indication that every location has a limit or capacity of MNs it can contain.
Figure 1: Single Parameter for Varying Values for B, and Exponential for Twenty Nodes
Figure 1may indicate that the exponential distribution was higher than the single parameter in the initial stages but as time progresses the exponential decreases fast to zero. The single parameter Pareto overtakes the exponential as the number of nodes increases and indication that the single parameter performs better than exponential distribution.
0 2 4 6 8 10 12 14 16 18 20 0
0.2 0.4 0.6 0.8 1 1.2 1.4 1.6 1.8 2
PARETO PDF
P
ro
b
x - Number of Nodes
B1 = 0.5, k=1 B2 = 0.8, k=1 B3 = 1, k=1 B4 = 1.5, k=1 B5 = 2, k=1
0 2 4 6 8 10 12 14 16 18 20
0 0.5 1 1.5
Exponential Distribution
P
D
F
x - Number of Nodes
lam = 0.5 lam1 =0.8 lam2 = 1 lam3=1.5
Figure 2: Two Parameter Pareto for Varying B Values and Exponential
In Figure2 the comparison between the two-parameter Pareto and exponential distributions is illustrated. It is obvious that the two-parameter Pareto outweighs the exponential distribution as the number of MNs increases. The exponential distributions decays very fast and finally get to the a-axis unlike the two-parameter Pareto distribution where some of the arrival rates distribution has not decay to zero.
However the two-parameter Pareto performed well than the one-parameter Pareto, since some of the arrival of the parameter did not decay to zero. The long-tailed nature of the two-parameter Pareto helped to clear out any congestion in a location when the arrival rate was small and the reverse was also true.
5.2
Effect of Varying Arrival Rates
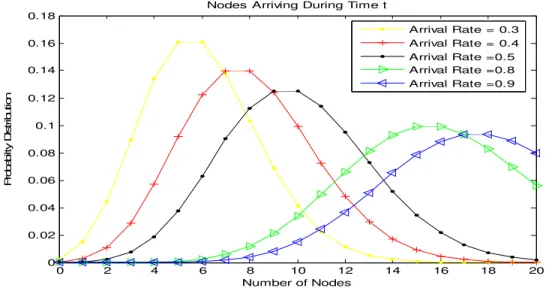
Figure 3: For Twenty Number of Nodes for varying Arrival rates
In reality, the total connection time of a node over a specific interval depends on the nodes encounter rate and the time in each encounter, both of which depend on the relative mobility of nodes.
Although a high node arrivals results in more node encounters, the network would eventually become congested. The impact of this relationship is that nodes can and will be tightly packed (i.e. High density) if their arrival rates is high (congestion), but if the arrivals is lower, the nodes must be farther apart (low density). For instance it is clear that there is some congestion for arrivals of MNs, since they have to follow some holding paths.
As the value of arrival rate increases, the shape of the distribution changes dramatically to a more symmetrical (”normal'') form and the probability of a larger number of arrivals increases with increasing number of MNs. An interesting observation is that as the arrival rate increases, the properties of the Poisson distribution approach those of the normal distribution as in Figure3.
The first arrival processes of nodes give higher contact probabilities at higher arriving rates. This is due to the nodes’ contiguity one to another making mobility difficult. In practice, one may record the actual number of arrivals over a period and then compare the frequency of distribution of the observed number of arrival to the Poisson distribution to investigate its approximation of the arrival distribution.
6. C
ONCLUSIONThe arrival patterns have shown some impact on the network population, as the arrival rate increases the MNs population also increases to a peak and then decays rapidly to the x-axis. It was realized that the Poisson distribution is not good for the arrival distribution; therefore the Pareto distribution was considered. It has come out clear that the Pareto distribution is good for the arrival distribution, especially the two-parameter Pareto distribution which performed better than the single Pareto and exponential distributions even though at the earlier stages the exponential performed than the single Pareto distribution with a faster decay.
0 2 4 6 8 10 12 14 16 18 20
0 0.02 0.04 0.06 0.08 0.1 0.12 0.14 0.16 0.18
P
ro
b
a
b
ilt
y
D
is
tr
ib
u
ti
o
n
Number of Nodes Nodes Arriving During Time t
It may subsequently be admitted that mobility in MANETs is a difficult work and actually. It is an interesting research area that has been growing in recent years. Its difficulty is mainly generated because of the continuous changes in the network topology with time. The topological changes have impact on mobility techniques developed for infrastructure-based networks thus may not be directly applied to mobile adhoc networks. We have investigated through simulation mobility prediction of MNs using the queueing model.
R
EFERENCES[1] J. Boleng, T. Camp, and V. Tolety. “A Suvey of Mobility Models for Ad hoc Network Research”, In Wireless Communication and Mobile Computing (WCMC), Vol. 2, No. 5, pages 483 – 502, 2002.
[2] Subir Kumar Sarkar, T. G. Basavaraju, C. Puttamadappa, “Mobility Models for Mobile Ad Hoc Networks”, 2007, Page 267 – 277, Auerbach Publications – www.auerbach-publications.comVolume 2, No.5, 2002.
[3] C. Rajabhushanam and A. Kathirvel, “Survey of Wireless MANET Application in Battlefield Operations”, (IJACSA) International Journal of Advanced Computer Science and Applications, Vol. 2, No.1, January 2011.
[4] Buttyan L., and Hubaux J. P., “Stimulating cooperation in self-organizing mobile ad hoc networks. Mobile Networks andApplications: Special Issue on Mobile Ad Hoc Networks, 8(5), 2003.
[5] C.P.Agrawal, O.P.Vyas and M.K Tiwari, “Evaluation of Varying Mobility Models & Network Loads on DSDV Protocol of MANETs”, International Journal on Computer Science and Engineering Vol.1 (2), 2009, pp. 40 - 46.
[6] P. N. Pathirana, A. V. Savkin& S. K. Jha. “Mobility modeling and trajectory prediction for cellular networks with mobile base stations”. MobiHoc 2003: 213 -221.
[7] MohdIzuanMohdSaad and Zuriati Ahmad Zukarnain, “Performance Analysis of Random-Based Mobility Models in MANET Routing Protocol, EuroJournals Publishing, Inc. 2009, ISSN 1450-216X Vol.32 No.4 (2009), pp.444-454 http://www.eurojournals.com/ejsr.htm
[8] Zainab R. Zaidi, Brian L. Mark: “A Distributed Mobility Tracking Scheme for Ad-Hoc Networks Based on an Autoregressive Model”. The 6th International Workshop of Distributed Computing, Kolkata, India (2004) 447(458)
[9] Abdullah, SohailJabbar, ShafAlam and Abid Ali Minhas, “Location Prediction for Improvement of Communication Protocols in Wireless Communications: Considerations and Future Directions”, Proceedings of the World Congress on Engineering and Computer Science 2011 Vol. II WCECS 2011, October 19-21, 2011, San Francisco, USA
[10] Gunnar Karisson et al., “A Mobility Model for Pedestrian Content Distribution”, SIMUTools ’09 workshops, March 2-6, 2009, Rome Italy.
[11] John Tengviel, K. A. Dotche and K. Diawuo, “The Impact of Mobile Nodes Arrival Patterns In Manets Using Poisson Models”, International Journal of Managing Information Technology (IJMIT), Vol. 4, No. 3, August 2012, pp. 55 – 71.
[12] Martin J. Fischer and Carl M. Harris, “A Method for Analysing Congestion In Pareto and Related Queues”, pp. 15 – 18.
[14] Kyunghan Lee, Seongik Hong, Seong Joon Kim, Injong Rhee and Song Chong, “SLAW: Self-Similar Least-Action Human Walk”, published in the Proceedings of the IEEE Conference on Computer Communications (INFOCOM), Rio de Janeiro, Brazil, April 19–25, 2009.. PP. 855 – 863.
Authors
John Tengviel
He is a holder of a BSc. Computer Science from Kwame Nkrumah University of Science and Technology (KNUST) in 2001 and currently candidate of MSc. Telecommunication Engineering from College of Engineering at the same university. He is a senior instructor with the Department of Computer Science at Sunyani Polytechnic. His research interests include Mobile Ad hoc Networks and Mobility modeling in MANETs.
Nana (Dr.) Kwasi Diawuo