Abstract— A study of the effect of laser power was investigated over the volume of deposited composite, microstructure and microhardness. The laser power was varied between 600 and 1800 W while keeping all other parameters constant. An indication shows that the area and the volume of the deposited composites are directly proportional to the laser power employed. The volume of the deposit obtained falls between 358.6 mm3 and 1009 mm3. The microstructures were analyzed and found that the formation of the Widmanstatten structures improved the hardness of Ti6Al4V/Cu composites. The hardness values of the deposits varied between HV335 and HV490. The percentages of porosities of the samples were also presented and found to have an inverse relationship with the laser power. The results are presented and discussed.
Keywords— Microhardness, Microstructure, Porosity, Volume of deposited composite.
I. INTRODUCTION
n the years back and recently, many researchers have performed and carried out investigations on titanium and its alloys and their results have enabled them to some extent to discover a better procedure on how to improve on the production and deposition of the alloy to enhance its development [1] – [2]. The exhibitions of the combination of mechanical, physical and corrosion resistance of Ti6Al4V alloy have made its applications
Mutiu F. Erinosho is a doctorate candidate in the Department of Mechanical Engineering Science, University of Johannesburg, Auckland Park Kingsway Campus, Johannesburg, South Africa, 2006. (E-mail: [email protected] or [email protected]).
Dr Esther T. Akinlabi is a Senior Lecturer in the Department of Mechanical Engineering Science, University of Johannesburg, Auckland Park Kingsway Campus, Johannesburg, South Africa, 2006. (Phone: +2711-559-2137; E-mail: [email protected]).
Prof Sisa Pityana is a Research Scientist in the National Laser Centre of Council for Scientific and Industrial Research (CSIR), Pretoria, South Africa (E-mail: [email protected]).
This work is supported by the Rental Pool Programme of National Laser Centre, Council of Scientific and Industrial Research (CSIR), Pretoria, South Africa and Mr Erinosho also acknowledges the award of
among the titanium alloys desirable and demanding in the aerospace, industrial, chemical, energy and automotive industrial services. They are also applied in the emerging biomedical prostheses applications due to the excellent biocompatibility among metallic materials [1]. The alloys are amongst the most important of the advanced materials which are keys to improved performance in the aerospace and terrestrial systems [2-4]. The improvements in the mechanical properties of titanium and its titanium alloys have generally been achieved through the addition of alloying compounds [5–8]. The addition of copper (Cu) to titanium alloys allows the manipulation of mechanical properties through age hardening [9]. Cu is a strong β -stabilizing element and its atomic migration into titanium lattice results in the formation of β-Ti during cooling and can travel longer distance in titanium lattice than other elements and can open more crystallography structure of the β matrix [10]. Laser Metal Deposition (LMD) as the name implies is a process of using a laser beam to form a melt pool on a metal substrate on which powder deposit is sprayed through the nozzle and fusion bonded to the substrate layer by layer to form a new material layer from a 3D CAD data. The laser power and powder composition is taken into consideration to have a homogenous distribution in the layer and improve its properties [11]. The lower cooling rate at higher laser power resulted in a larger globular grains in the heat affected zone (HAZ) and the columnar prior beta grains grow epitaxially. Also, at low cooling rates, the nucleation sites were reduced and led to fewer columnar grains as the laser power was increased [12]. Several studies have been conducted on laser metal deposition of Ti6Al4V/TiC composites [13]-[15], but there is scarcity of published literature on Ti6Al4V/Cu composites despite the evolving desirable properties and potential applications of these composites.
This research work therefore focuses on the effect of laser power on the volume of the deposited composites, microstructure and microhardness of laser metal deposition of Ti6Al4V/Cu composites. In these experiments, the scanning speed, the powder flow rate and gas flow rate of the Ti6Al4V alloy and pure Cu powder were all kept constant while varying the laser power. The evolving Mutiu F. Erinosho, Esther T. Akinlabi, Member, IAENG and Sisa Pityana
Laser Metal Deposition of Ti6Al4V/Cu
Composite: A Study of the Effect of Laser
Power on the Evolving Properties
thoroughly investigated and characterised at the varying laser powers.
II. EXPERIMENTALPROCEDURE
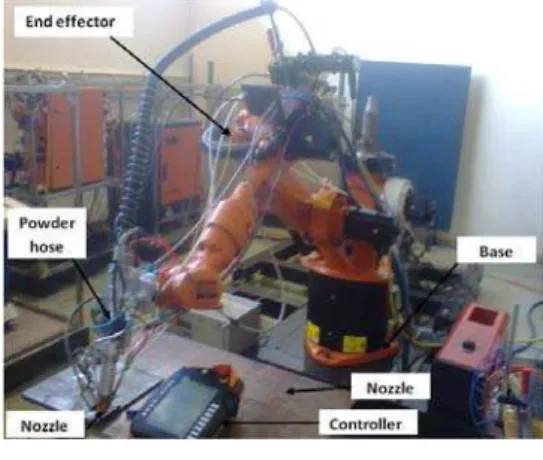
The experiments were conducted at the National Laser Centre of Council of Scientific Industrial Research (NLC-CSIR), Pretoria, South Africa. The Laser Metal Deposition (LMD) was achieved by using Ytterbium laser system equipment (YLS-2000-TR) operating at a maximum power of 2000 Watts and uses a kuka robot for its operation. The laser passes through the centre of the nozzle and creates the melt on the substrate. Argon shield gas was employed to protect the deposit from oxidation during the operation. The powder was accelerated with the assistance of gas on the substrate. Fig. 1 shows the experimental setup of a kuka robot that was used during the deposition.
Fig. 1. Experimental set up
The system consists of a nozzle at its end, hose connections, a controller and other external facilities such as the powder feeder, the laser components, carrier gas component, a chiller and argon gas cylinders as shown.
A. Materials and methods
The substrate used was 99.6% Ti6Al4V solid with a dimension of 102 X 102 X 7.45 mm3 in volume. The substrate was sandblasted in a compartment to remove surface contaminants and to create a rough layer for firm metallographic bonding between the deposit and the substrate. The process parameters used in this study are shown in Table I. The substrate was cleaned with acetone and dried off. Two powders were used for these experiments which are Ti6Al4V and Cu powders. The particle sizes of the Ti6Al4V and Cu powders varied between 150 and 200 µm. The powders were fed from two different hoppers, flows through two hoses and directly to the nozzle end with the help of the carrier gas. An argon gas was supplied into the system to provide a shield to prevent oxygen contamination on the deposited composite.
TABLEI EXPERIMENTMATRIX
Sample Name
Laser Power (W)
Scanning Speed
(m/s)
Powder Flow Rate (rpm)
Gas Flow Rate (l/min) Ti6Al4V Cu Ti6Al4V Cu
A1 600 0.005 9.9 0.1 3 1.5
A2 900 0.005 9.9 0.1 3 1.5
A3 1200 0.005 9.9 0.1 3 1.5
A4 1500 0.005 9.9 0.1 3 1.5
A5 1800 0.005 9.9 0.1 3 1.5
The Ti6Al4V alloy and Cu powders from the hoppers flowing through different hose met at a point and flow through a hose to the nozzle. The laser power was varied while other parameters were kept constant. The beam diameter used for this experiment was 4 mm and track length was maintained at 50 mm respectively. The nozzle standoff distance was kept at 12 mm throughout the experiments.
Five deposits were made from the powers designated as A1 to A5 and the deposits were cleaned with metal brush after deposition to remove the unmelted powders on them. After the full deposition, the samples were sectioned transversely and mounted in polyfast prior to further characterisation processes. The samples were grinded, polished and etched according to E3-11 ASTM standard [16].
Calculations were conducted for the resulting area of segment and volume of the deposited composite. Samples were also observed on the optical microscope to view the evolving microstructure.
B. Volume of the Deposited Composites
Fig. 2 shows a schematic view of a deposited sample image of a composite after the deposition was made on the substrate. The volumes of each of the samples from A1 to A5 were achieved using the formulas in equations (i), (ii) and (iii) according to Sloane [17].
Fig. 2. A schematic of deposited composite on a substrate
Where ‘R’ is the radius of the circle or cylinder.
According to Sloane, and this was not solved analytically but found numerically, therefore;
(ii) And
(iii)
C. Microstructure
The microstructures of the cross sections of the samples were observed. Prior to the optical observation, the Kroll’s reagent was prepared with 100 ml H2O, 3 ml HF, 5 ml HNO3 according to Struers application note of metallographic preparation of titanium [18]. Each of the samples was etched for 10 - 15 s rinsed with water and dried off. All the five (5) samples were observed under the BX51M Olympus microscope at various magnifications.
D. Hardness tests
The microhardness characterization was conducted on a Vickers hardness machine Zwick/Roell on each sample from sample A1 to A5 starting from the top of the cross section and to the substrate. Eight indentations were made on the deposited composite; and indenting through the fusion zone (FZ), the heat affected zone (HAZ) and the Ti6Al4V substrate. A load of 500g and a dwell time of 15 s were used throughout the hardness tests according E384 -11e1 ASTM standard [19].
III. RESULTSANDDISCUSSION
The results obtained from the test analysis conducted are presented and discussed in this section.
A. Physical Appearance of Deposited Tracks
The physical appearance of the deposited tracks is shown in Fig. 3. Deposits were made and labelled A1 to A5 as shown.
Fig. 3. Deposited tracks of sample A1 to A5
It was observed that there are no visible defects on the
parameters used to produce the tracks. The measurements were done using a digital Vernier caliper.
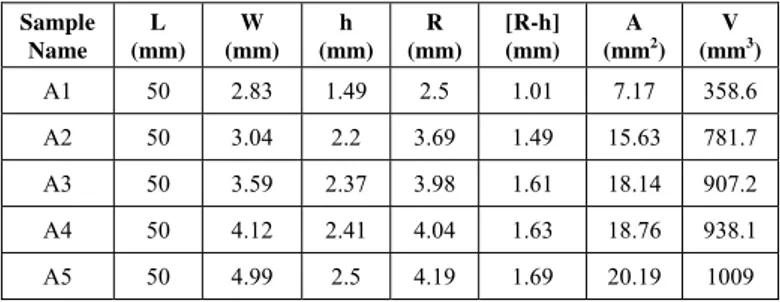
Table II presents the sample designations and the measurements for the length of deposit, the width, height, the radius of the circle, the area of the circular segment and the volume of deposited composites.
TABLEII
MEASUREMENTSOFTHELENGTH,WIDTHANDHEIGHTOFTHE DEPOSITEDCOMPOSITES
Sample Name
L (mm)
W (mm)
h (mm)
R (mm)
[R-h] (mm)
A (mm2)
V (mm3) A1 50 2.83 1.49 2.5 1.01 7.17 358.6
A2 50 3.04 2.2 3.69 1.49 15.63 781.7
A3 50 3.59 2.37 3.98 1.61 18.14 907.2
A4 50 4.12 2.41 4.04 1.63 18.76 938.1
A5 50 4.99 2.5 4.19 1.69 20.19 1009
Where the parameters in the Table II are as follows: L = Deposit length, W = Deposit width, H = Height of deposit; R = Radius of circle, A = Area of circular segment and V = Volume of deposited composite.
A plot of the deposit widths and heights are presented in Figure 4.
Fig. 4. Widths and heights of deposit against samples
B. Volume and Area of the Deposited Tracks
The volume of the deposited tracks and area of the circular segments of the deposits are presented in Fig. 5.
Fig. 5. Histogram of area of segment and volume of deposited track
Fig. 4 shows the histogram plot for the area of segment and the volume of deposited composite of sample A1 to A5. It was found that the area of the segment increases slightly as the [R-h] mm increases. The volume of the composite shows a greater increase as the laser power increases. Equation (i) was used to calculate the area of segment. The value of x=0.596027 is a constant which gives the ratio of the height to the radius of circle. The quantification of the volume of powder utilized is necessary in order to have an idea of the quantity of powder required for certain dimension of composites.
C. Microstructural evaluation
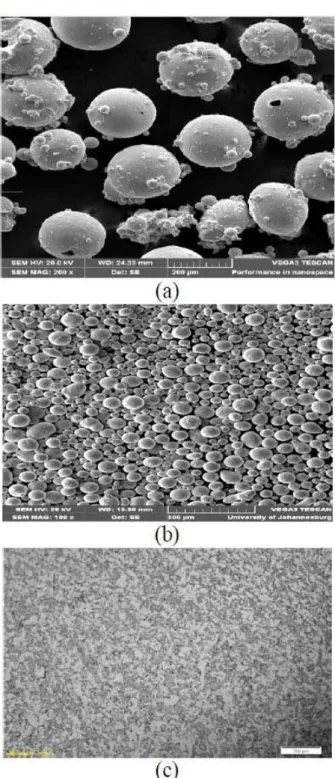
An investigation was carried out on the evolving microstructures on samples A1 to sample A5. Before the deposition, the SEM morphology of the Ti6Al4V powder and Cu powder are shown in Fig. 6 (a) and (b). Also, the microstructure of the substrate cross-section was shown in Fig. 6(c).
Fig. 6. (a) The SEM morphology of Ti6Al4V powder, (b) The SEM morphology of Cu powder, (c) Microstructure of the substrate.
Both powders show a spherical morphology and Ti6Al4V powder was observed to have almost similar shape and size of powder particles while Cu powder shows similar shape but different particle sizes. Some smaller particles were observed to attach themselves to the main particles as observed as observed in the Fig. 6.
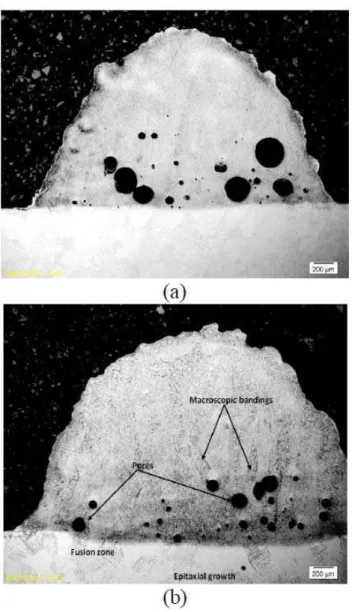
Fig. 7. (a) Macrograph of sample A2 at a laser power of 900W, (b) Macrograph of sample A4 at a laser power of 1500W
The degree of porosities in the deposits were characterised as this is significant in biomedical applications to encourage osseointegration. Pores were observed at the lower part of some of the composites. In the stream analysis report of sample A2 on porosity, the average/mean porosity was found to be 171.14±90.75 µm. The phase analysis shows a value of 39.18 %. Fig. 7(b) also shows the macrograph of sample A4 at a laser power of 1500 W and the stream analysis shows an average/mean porosity value of 125.44±27.4 µm.
The phase analysis done on sample A4 gives a value of 8.69 %. The percentage of porosity decreases with respect to an increase in the laser power. The rate of cooling was slow at high laser power and there was enough time for good solidification to occur. The entrapped gases in the deposited composite at high power do not have space to cause so many pores unlike when solidification takes place at low laser power. These pores observed have their
the body is better than its deficiency. 1% of Cu added to the Ti6Al4V alloy used for implants will be of advantage to the body of human or animal when the composite is used to fabricate bones with certain percentages of porosities for medical use. Macroscopic bandings were found on sample A4 as shown in the Fig. 7(b). Structures are also found to grow epitaxially towards the fusion zone (FZ) and the heat affected zone (HAZ).
Fig. 8(a) shows the microstructure of sample A4 with widmanstettan structure at the laser power of 1500W while Fig. 8(b) shows the microstructure of sample A3 with widmanstettan structure and columnar prior beta grain at the laser power of 1200W.
Fig. 8. (a) Microstructure of sample A4 showing widmanstettan structure at the laser power of 1500W. (b) Microstructure of sample A3 at the laser
power of 1200W
widmanstettan structures thereby creating a low brittleness of the deposited composite. Fig. 8(b) shows the microstructure of sample A3 with widmanstettan structure and columnar prior beta grain at the laser power of 1200W. Grains grow epitaxially towards the FZ and HAZ and a formation of globular structures as the laser power increases, this is similar to the reported literature [12].
D. Microhardness profiling
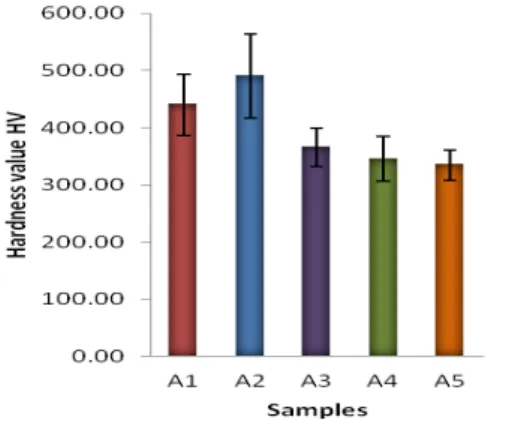
The microhardness profiling was carried out on all the samples making eight indentations on the cross section of the deposited composites. The average hardness values and their standard deviations are presented in Fig. 9.
Fig. 9. Average hardness of the deposited composites
An indication shows that the hardness value increases as the laser power increases. At some point, the hardness value got to the peak and decreased as the laser power kept on increasing. Sample A2 at a power of 900W shows highest hardness and this point, the level of martensite is high and a coarse widmanstettan was generated. As the sample A3, A4 and A5 show a decrease in the hardness value so will their martensitic reduces and improves the cooling rate as regards relatively to the increase in laser power.
IV. CONCLUSIONS
The deposition of Ti6Al4V and Cu powder and the formation of Ti6Al4V/Cu composites on Ti6Al4V substrate was a success. Characterizations were done on the microstructure, porosity, microhardness and calculation for the volume of deposited composites.
Widmanstatten structures were generally observed in the microstructures and increases as the laser power increases. Porosity evaluation was investigated and observed that percentage of porosity is inversely proportional to the laser power. The results obtained will be advantageous to the bio-medical application such as the bone implantation. Hardness value obtained shows an improvement on the
Ti6Al4V/Cu composite. More characterisation will be carried out on the samples to prepare them for optimization and further characterize in order to account for an improvement in both medical and engineering environments.
REFERENCES
[1] V. N Moiseyev. “Titanium alloys: Russian aircraft and aerospace applications”. CRC Press Taylor & Francis Group; 2006, pp. 169–80.
[2] Congress of the U.S. Office of Technology Assessment, “Advanced Materials by Design- Polymer Matrix Composite”, OTA-E-351, Washington,June 1988, pp.83-85.
[3] H. Francis. (Sam) Froes, Te-Lin Yau and Hans G. Weidenger, “Titanium, Zirconium and Hafnium” Chapter 8, Materials Science and Technology – MKJ Structure and Properties of Nonferrous Alloys, vol. ed. K.H. Matucha, 1996, VCH Weinheim, FRG, pp. 401.
[4] R. R Boyer, G. Welsch and E.W. Collings, Eds. “Materials Properties Handbook: Titanium Alloys”, 1994, ASM Int., Materials Park, OH.r–2Nbbypressureless sintering.
[5] I. Sen, K. Gopinath, R. Datta and U. Ramamurty, “Acta Materialia”. 58, 2010, pp. 6799.
[6] A. K. Gogia, T.K. Nandy, K. Muraleedharan and D. Banerjee, “Material Science and Engineering”. A 159, 1992, pp. 73. [7] Y. Okazaki, Y. Ito, A. Ito, and T. Tateishi, “Material
Transaction”. JIM 34 (1993) pp 1217.
[8] W. H. Tian and M. Nemoto, “Intermetallics” 5 (1997) 237. [9] G. Lutjering and S. Weissman, “Metallurgical and Material
Transaction”. 1, 1970, pp.1641.
[10] M. Ghos and S. Chauerjee. “Diffusion bonded transition joints of titanium to stainless steel with improved properties” [J]. Material Science and Engineering A, 2003, 358: pp 152−158. [11] “Industrial Laser Solutions for Manufacturing”,
http://www.industrial-lasers.com/articles/print/volume-250/issue-6/features/laser-metal-deposition.html. Penn Well copyright 2013. Assessed 2013.
[12] M. Shukla, R. M. Mahamood, E. T. Akinlabi and S. Pityana, “Effect of Laser Power and Powder Flow Rate on Properties of Laser Metal Deposited Ti6Al4V”. World Academy of Science, Engineering and Technology International Journal of Mechanical, Industrial Science and Engineering Volume: 6 No: 11, pp 38, 2012.
[13] R. M. Mahamood, E. T. Akinlabi, M. Shukla and S. Pityana, “Scanning Velocity Influence on Microstructure, Microhardness and Wear Resistance Performance on Laser Deposited Ti6Al4V/TiC Composite,” Materials and Design, 50, 2013, pp. 656-666.
[14] H. Choe, S. Abkowitz, S. M. Abkowitz, “Influence of processing on the mechanical properties of Ti–6Al–4V-based. composites reinforced with 7.5 mass% TiC and 7.5 mass% W”, Materials Transaction 2008, 49(9): 2153–8.
[15] W. Xiang, M. Xuliang, L. Xinlin, D. Lihua, W. Mingjia, “Effect of boron addition on microstructure and mechanical properties of TiC/Ti6Al4V composites”. Materials and Design, 2012; 36: pp. 41–6.
[16] E3-11 Standard Guide for Preparation of Metallographic Specimens, ASTM International. 2011.
[17] N. J. A. Sloane, “The on-line Encyclopedia of Integer Sequences” http://mathworld.wolfram.com/quarter-tank problem.html. Sequence A133742 . Assessed 2013.
[18] Struers Application Note on Titanium.
http://www.struers.com/resources/elements/12/104827/Applica tion_Note_Titanium _English.pdf. Assessed 2013.