Tinsaye Tamerat
*a PhD candidate, Department of Social Work Assam University Silchar
* Corresponding author: Tinsaye Tamerat
E-mail: tinsayetamerat@gmail.com
LIVELIHOOD RESOURCES AND DETERMINANTS IN TIGRAY
REGION OF ETHIOPIA
A B S T R A C T
K E Y W O R D SA R T I C L E I N F O
Received 13 July 2016 Accepted 25 Dec 2016 Available online 5 Jan 2017 Majority of globe's poor live in most developing countries rural
areas by majorly depending on undersized farms as main source for livelihood. Improving agricultural productivity of these smallholding farmers is one means of enhancing livelihoods of the poor. The study's main aim is to assess the extent of control and access of livelihood resources by smallholding farmers and to examine the deterring factors behind it. Concomitantly, for this study Kilte Awelalo, a rural district in Tigray was taken as a study area and three villages were selected. The total sample number of households from these three villages was 370 and a formal interview schedule was employed to collect relevant primary inputs. Accordingly, the study found variables like land size, educational attainment, livestock holdings, irrigation and participation in formal and informal institutions as major impacting factors.
58
1.
Introduction
Ethiopia is one of the least developing countries in the globe and its name has been illustrious with famine and drought. The country perhaps is best known as the destination of the worst famines in African history: as a symbol of contemporary African poverty and failure of development. In Ethiopia, where majority smallholding farmers dominate the subsistence agriculture of the overall nationwide economy, they often face lack of livelihood capitals and are highly prone to livelihood related risks. Majority of the production yield from agriculture comes from small-scale farmers. Nevertheless, the small-scale traditional producers have come under a high pressure to cope up with challenges of livelihood reconstruction, food insecurity and poverty reduction (Yishak G., et. al. 2014).
The livelihood strategies they use are at the center of development and for the poor in remote areas wellbeing mainly entails having enough food and shelter for their household with basic level of security. Nonetheless, the livelihood strategies they employ to ensure the basic livelihoods will mainly depend on the combined effects of livelihood assets which takes into account of the vulnerability context in which they subsist in, institutions and policies and the processes that influence them (Ellis, 2000). Analysis of livelihood by using an asset framework could enhance approval of the way that combination of activities and assets are crucial to secure livelihoods. The precise linkage between livelihood and food security puts forward that food security could be achieved when an equitable growth guarantees that the vulnerable and poor have a sustained livelihood (Ayalneh B., 2002). Moreover, this requires an adequate understanding about the livelihood strategies of vulnerable and resource poor farmers at a micro level in the designing and implementing the strategies which takes in to account of livelihood needs of the local people. Therefore, an end to end consideration of alternative livelihood strategies that rural households adopt is indispensable to bring any improvement. This is very crucial not to consign the limited resources available for rural development basing on unproven assumptions about the resource poor and their livelihood strategies (Tesfaye L., 2003).
This particular study basis on the notion that households have their own means and forms of asset accumulation and strategies for livelihood. It assumes that people already have numerous productive and creative activities and have developed strategies in parallel with their own culture, tradition and local perspectives and any attempts to be made in the intervention of livelihood strategies challenges should take into consideration of those specific rural indigenous livelihood strategies. Therefore, the study attempts to see the livelihood resources, strategies, choices and determinants of Kilte Awelalo area smallholding farmers and the major determining factors.
2. Human Capital
59
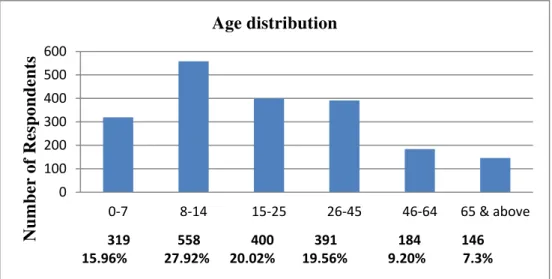
Figure 1. Age distribution among the respondents (Source: Survey result, 2015)
Moreover, the overall dependency ratio which is defined as people in the age of 0-14 and above 65 divided by those people between age group of 15-64 of the sample households was found to be 0.95. It is argued that the younger the farmers are the more likely to be poor than the older farmers due to the less possession of resources accumulation (Tesfaye L., 2003).
With regard to children school enrollment, in the age group of 8-25 around 92% have joined formal primary education which typifies a similar figure to the Government of Ethiopia's objective of reaching out primary education for all (GTP, 2010). Lastly, household size is one decisive factor which can possibly determine the human capital quality of households. In residences where the number of members who are living under the same roof becomes high, in parallel related costs increases. The study found that, majority of the households in the study areas were having a household size of 6 with a maximum household size of 10 members.
3. Natural Capital
Natural capital as a term is used to connote the natural resource stocks out of which useful livelihood flows and services are derived. DFID, (1997) asserted that "None of us would survive without the help of key environmental services and food produced from natural capital". For this particular study, natural capital comprises farmers' land ownership status, land size, soil fertility status and the agro ecology in which the household works.
As discussed, cultivable land availability among sample households is one major determinant of livelihood and food security of households.
Table 1. Households' Farmland ownership and Land fertility level (Source: Survey result, 2015)
0 100 200 300 400 500 600
0-7 8-14 15-25 26-45 46-64 65 & above
Nu
mber
of Respondents
319 558 400 391 184 146
15.96% 27.92% 20.02% 19.56% 9.20% 7.3%
60 The survey found that 21% of the households don’t have access to cultivable land. Majority of them also added that they get land for cultivation through sharing in where they will share the crop they produce with the land owner\s, in most cases half share. With regard to fertility level of the land, only households who own a land have a highly fertile land, while the rest majority who have rented in or shared in have a land with a very low fertility level. The survey revealed that households who have their own land ownership have a better fertile land than those who do not own. Moreover, during the survey it was observed that households with no or less access to land were forced to work on and develop less fertile and infertile lands. Though here the ownership to land is better as compared to similar researches findings, yet access to land should be available to the rest as their main livelihood depends on agriculture.
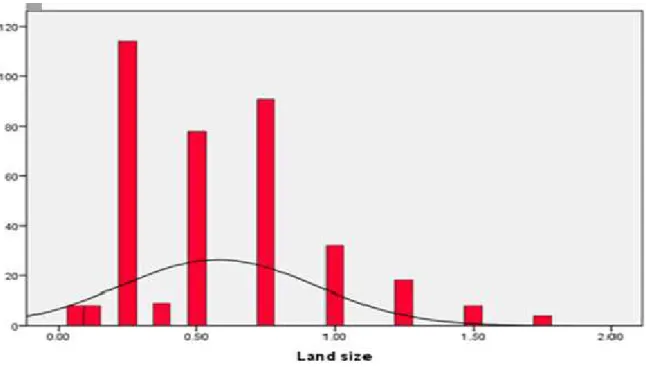
Figure 2. Land size pattern among sample households (Source: Survey result, 2015)
The average cultivable land size per households in the Woreda is 0.63ha (Hectares). The survey also found that the average cultivable land size distribution per households to be 0.57ha. In addition, about 30.2% have land size of 0.25 ha and less. In particular, the average cultivable land size holding of farmers is less than that of the average set by the Office of Agriculture and Rural Development (Office of Agriculture and Rural Development, 2015).
4. Physical Capital
Physical capital consists the basic infrastructure and producer goods which are prerequisites to sustain livelihood. In DFID's Sustainable Livelihood Framework (1997), the infrastructural base comprises of changes to the physical environment which assist people to attain their basic necessities and enhance their productivity whereas producer goods consist the equipment and tools employed by people to function efficiently for a more productivity.
61 In concomitant to this, about 90% of the total households do not have electricity service at all whereas the remaining revealed that they have access to electricity through line extensions made to nearby churches and other organizations. With regard to tap water service, no household from all the three study areas was found to have access to a tap water. In general, it was observed that utility services like electricity and tap water accessibility is limited in the district. Furthermore, the study incorporated health centers/posts facilities availability in the study areas as part of primary health assessment. Health extension posts facilitate distribution of crucial vitamins and other supplements to mitigate malnutrition especially for children. Though, the name is a health extension post, it neither provides any medical assistances nor have any facilities and human resource to support that. It was also observed the major illness in the district include malaria, diabetics, HIV/AIDS, diarrhea, kidney related problems and eye problems.
Livestock holding is one of the most crucial assets that farm households heavily depend on to safeguard and set a protection boundary to their household from any sort of crisis and vulnerabilities. It is considered as a security especially in cases of crop failures by generating income from sale of the livestock and/or its produce for farmers and direct consumption of the livestock in Ethiopia. Out of the total 370 sample households, 331 households own livestock despite the fact that the numbers of livestock unit per household were not significantly large. The average livestock holdings in Tropical Livestock Unit for the sample households was found to be 4.99. As comparing to the previous year, there was a decrement by 0.24 livestock units per household.
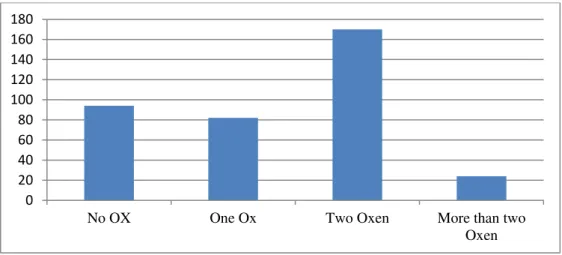
Figure 3. Oxen ownership by households (Source: Survey result, 2015)
Conferring oxen ownership for rural households is given a special emphasis as it is the main source of power for traction in the remote areas of Ethiopia in general and the study areas in specific. Accordingly, it was found that about 25.4% of the total sample respondents did not own any oxen, 22.2% one ox, 45.9% two oxen and finally 6.5% owned more than three oxen. The average oxen holding per household in the study areas was found to be 1.35 and as comparing to the previous year (1.38 Oxen per household), there was a slight decrement. The strength of any agricultural revolution is the access to modern agricultural inputs for farmers ranging from fertilizers, improved seeds and chemicals to knowledge and irrigation.
0 20 40 60 80 100 120 140 160 180
No OX One Ox Two Oxen More than two
62
Table 2. Use of traditional and modern agricultural inputs (Source: Survey result, 2015)
No
Response
Yes
No
1
Manure
267 (72.2%)
103 (27.8%)
2
Irrigation
181 (48.9%)
189 (51.1%)
3
Modern Fertilizer
314 (84.9%)
56 (15.1)
4
Improved seed
298 (80.5%)
78 (19.5)
5
Pesticide
100 (27.0%)
270 (73.0%)
6
Herbicide
247 (66.8%)
123 (33.2%)
7
Motor Pump
110 (29.7%)
260 (70.3%)
From the above table it can be seen that use of manure mostly derived from feces of animals is adopted by majority of farmers as an organic fertilizer in the study areas. The use of this organic manure by the smallholding farmers has an immense value for keeping and enhancing the fertility of the soil naturally. Moreover, use of modern fertilizer and improved seeds take the largest figures among the sampled households. Significant number of households employ modern fertilizer and improved seeds as their crucial inputs for agricultural productivity. However, with regard to irrigation, there is yet much to be done with regard to irrigation, where more than half of the households do not employ irrigation. A study done on food security trend in Ethiopia revealed that adoption of chemical fertilizers, improved seeds and other crucial modern agricultural inputs on average enhance productivity 25 quintals per hectare while the average yield under traditional farming is 11 quintals per a hectare. The yield difference mainly indicate how these agricultural inputs are vital in boosting domestic food grain production and can play a high food security (Ahmed A., 2008).
Lastly, it was found that only 29.7% of the total sample respondents own a motor pump as an input in the agricultural production. Motor pump in areas like the study areas where there are no running rivers and water reserves, stands as an inevitable input for accessing ground water. It was also noticed that households with motor pumps were able to produce other cash crops and yard vegetables production. No respondent was having any other means such as pedal pumps, motor tractor and other allied machineries.
5. Social capital
63 the association access to credit, labor shares and various supports (Berehanu E., 2007). In line with this, the study found that 53.8% of the total households who are members in the above listed social associations revealed that there is no use of being a member to these associations other than wasting time and financial resources. Studies have tried to depict the importance of these institutions in enabling households to mobilize resources especially during the period of crisis, to get access to labor and credit, to find clients and customers information for off farm businesses (Little P. D., 1997).
6. Financial Capital
Financial capital refers to the financial resources which people use to accomplish their livelihood objectives (DFID, 1997). It encompasses the availability of cash or equivalent which enables people to adopt various livelihood strategies. Sources of financial capital include formal and informal credit accessibilities, household’s savings and remittances from family members working outside home place.
The study shows that about 68% of the total sample smallholding farmers do not have access to formal credit services. In addition to this, from the households who are having access to formal credit service, all of them were getting access through microfinance institutions. The well-known and the solitary operating microfinance institution in the study areas is Dedebit Microfinance Institution. Regarding savings habits of smallholding farmers, the study found that 68.1% of the total sample smallholding farmers do not have the habit of using formal saving institutions.
Lastly, the survey found out that majority of the households have access to a non-formal credit sources and out of which majority have access from 'Friends and Relatives' and limited number of households (2.2%) use local money lenders. Similar studies on livelihood resources of smallholding farmers and their access to credit revealed that majority of them (about 31.1%) use local money lenders as their major credit source (Adugna E., 2008).
7. Determinants of livelihood strategies
64
Table 3.Estimates of Maximum-Likelihood Probit model of engagement probability in different livelihood
strategies (Source: Survey result, 2015)
Probit regression
Number of obs = 370
LR chi2(12) = 168.98
Prob > chi2 = 0.0000
Log likelihood = -149.44759
Pseudo R2 = 0.3612
offfarmact
Coef.
Std. Err.
z
P>z
dF/dx
Sex of HH
-.4998642 .3771912
-1.33
0.185
-.1624914
Age of HH
-.0050201 .0083565
-0.60
0.548
-.0016319
Education level of HH
.36749
.1118527
3.29
0.001*
.1194604
Household size
.1774538
.0627928
2.83
0.005**
.0576851
Formal credit access
-.043095
.2357076
-0.18
0.855
-.0140089
Total livestock holding
0235552
.0224136
1.05
0.293
.0076571
Agricultural extension visit
-.9396697 .2508066
-3.75
0.000*
-.3054595
Use of modern fertilizer
1.290501
.3004724
4.29
0.000*
.4195048
Farmers Association Membership
.4441705
.1945968
2.28
0.022**
.144387
Social Association membership
.1273175
.1933815
0.66
0.510
.0413872
Farmland size
-.605083
.1177702
-5.14
0.000*
-.196695
Safety Net membership
.2387624
.2195211
1.09
0.277
.0076571
_cons
-1.427872 1.169096
-1.22
0.222
-.3054595
Marginal effects after probit: y= Pr(I) (predict) = .2611002
Note: *, ** and *** significant at 1%, 5% and 10% significance levels, respectively
Out of selected 12 variables which were assumed to have an impact on the involvement in various livelihood strategies of smallholding farmers in the study areas, 5 of them were found to have distinct level of significant impact. The significant variables were education level of the household head, household size, agricultural extension visits, use of modern fertilizers, farm land size and farmers association membership. Education level of the household head was found to be positively and highly significant at 1% level of significance. Moreover, it is found that one level of increase in educational attainment increases the probability of involvement in various livelihood strategies by 11.9%. Educational attainment proves to be one of the most crucial factors of income from nonfarm activities, especially in higher remunerative skilled and salaried in rural parts of Africa (Berehanu E., 2007). Household size was also found to be positively significant at 5% level of significance, implying the more the household size the higher probability of the household to involve in various income diversifying livelihood strategies. It was found that one household member increase leads to 5.7% increase in the probability of engagement in various livelihood strategies. Similar studies also revealed that an increase in an additional household member decreases the odds to engage only on farming (Bezemer D. J., and Lerman Z., 2002).
65 modern agricultural inputs were found to have a positive and significant impact on rural households’ decision to choose agriculture coupled with off farm plus nonfarm livelihood strategy at less than 10% level of significance.
Furthermore, farmers' association membership was also found to have a positive and significant impact on the probable involvement of households in various livelihood strategies. It was found that households who are members of farmers' association have a 14.4% higher probable chance of engaging themselves in various livelihood strategies than their counter parts. Similar studies also stated that membership in various association such as farmers associations and producer organization have positive impacts on the income generation capacity of farmers through widening local economy by production and market linkages (Bezemer D. J., and Lerman Z., 2002).
Finally, farm land size was found to have a high significance at less than 1% level of significance but was found to have a negative impact on the probability of farmers to pursue other livelihood strategies. It was found that the chances of involving in various livelihood strategies while having a large land size decreases the probability of involving by 19.6%. On one hand, it implies that the probability engaging in various livelihood strategies decreases when land size holding of household increases on the assumption that farmers with larger farm land size are going to be more engaged in farming since land encourages more farming.
8. Conclusion
The study dealt with livelihood resources and strategies and its determinants in the rural drought prone parts of Northern Ethiopia taking Kilte Awelalo district. The study has generally spotted a major fact that despite the low level of crop productivity which is mainly attributed by local weather and environmental conditions, the livelihoods of majority smallholding farmers remains undiversified. Their primary source of livelihood mainly depends on the rain fed small-scale agriculture. Moreover, the study found significant variables which determine the livelihood strategies of smallholding farmers in the study areas were education level of the household head, household size, agricultural extension visits, use of modern fertilizers, farm land size and farmers association membership
References
Adugna E., (2008). Livelihood Strategies and Food Security in Wolayta, Southern Ethiopia:
The Case of Boloso Sore District. Addis Ababa University, Ethiopia.
Ahmed A., (2008). Analysis of trends and determinants of food security in Ethiopia. Haramaya
University, Ethiopia.
Ayalneh B., (2010). Poverty Profile and Livelihood Diversification in Rural Ethiopia:
Implication to poverty reduction, Konrad, Hagedorn.
Berehanu E., (2007). Livelihood Strategies of Smallholder Farmers and Income Poverty in
draught prone areas: The case of Gena- Bosa woreda, SNNPRS. Haramaya University.
Bezemer D. J., and Lerman Z., (2002). Rural Livelihoods in Armenia: The Centre for
Agricultural Economic Research, the Department of Agricultural Economics and
Management Discussion Paper No. 4.03
CSA, (2013). Ethiopia Rural Socioeconomic Survey. A survey report by Central Statistical
Agency & the World Bank, Ethiopia.
66