www.atmos-chem-phys.net/9/3317/2009/ © Author(s) 2009. This work is distributed under the Creative Commons Attribution 3.0 License.
Chemistry
and Physics
Applying the Condensation Particle Counter Battery (CPCB) to
study the water-affinity of freshly-formed 2–9 nm particles in
boreal forest
I. Riipinen1, H. E. Manninen1, T. Yli-Juuti1, M. Boy1, M. Sipil¨a1,2, M. Ehn1, H. Junninen1, T. Pet¨aj¨a1, and M. Kulmala1
1Department of Physics, University of Helsinki, Helsinki, Finland 2Helsinki Institute of Physics, University of Helsinki, Helsinki, Finland
Received: 27 June 2008 – Published in Atmos. Chem. Phys. Discuss.: 5 August 2008 Revised: 15 April 2009 – Accepted: 7 May 2009 – Published: 25 May 2009
Abstract. Measurements on the composition of nanometer-sized atmospheric particles are the key to understand which vapors participate in the secondary aerosol formation pro-cesses. Knowledge on these processes is crucial in as-sessing the climatic effects of secondary aerosol forma-tion. We present data of>2 nm particle concentrations and their water-affinity measured with the Condensation Particle Counter Battery (CPCB) at a boreal forest site in Hyyti¨al¨a, Finland, during spring 2006. The data reveal that during new particle formation events, the smallest particles activate for growth at clearly smaller sizes in water than in butanol va-por. However, even at 2–4 nm, there are days when the par-ticles seem to be less hygroscopic than ammonium sulfate or sulfuric acid, which are often referred to as the most likely compounds present in atmospheric nucleation. This observa-tion points to the possible presence of water-soluble organ-ics, even at the very first steps on particle formation. The water-affinity of the particles decreases with size, indicating that the vapors that participate in the first steps of the par-ticle formation and growth are more hygroscopic than the vapors contributing to the later stages of the growth. This suggests that the relative role of less hygroscopic organics in atmospheric particle growth increases as a function of parti-cle size.
1 Introduction
Secondary aerosol formation via nucleation of atmospheric vapors is a global phenomenon proven to take place in a wide
Correspondence to:I. Riipinen ([email protected])
variety of environments (Kulmala et al., 2004a). The formed particles are likely to alter the Earth’s radiation budget and therefore the climate significantly: after growing to large enough sizes (tens to hundreds of nanometers) the particles directly scatter solar radiation, and act as condensation nuclei for cloud droplets thus influencing the albedo and lifetime of the clouds (Ramanathan et al., 2001; Lohmann and Feichter, 2005). The Intergovernmental Panel on Climate Change stated in their latest report (IPCC, 2007) that the largest un-certainties limiting the scientific understanding of future and past climate changes relate to the climatic effects of aerosol particles. Besides their effect on the global climate, aerosols have a deteriorating impact on air quality, as they reduce vis-ibility and cause adverse health effects. Boreal forests cover about 14% of the Earth’s land area and have been observed to be a significant source of atmospheric aerosol particles (Dal Maso et al., 2005). In this study we present data collected at a boreal forest site in Hyyti¨al¨a, southern Finland.
To accurately assess the magnitude of the particle source caused by secondary aerosol formation and growth in climate and air quality models, the main processes governing this phenomenon need to be known. It is still unclear in many respects what the nucleating or condensing atmospheric va-pors are (Kulmala, 2003).
on measurements conducted with novel instruments (Neutral cluster and Air Ion Spectrometer, NAIS; and UF-02proto condensation particle counter). Sipil¨a et al. (2008) made ob-servations of atmospheric neutral clusters below 2 nm using the Pulse Height Condensation Particle Counter (PH-CPC) and Expansion-type Condensation Particle Counter (E-CPC). As emphasized also by Kulmala et al. (2007a), direct obser-vations on atmospheric nucleation are crucial to pin down the particle formation processes in different environments. The proposed atmospheric nucleation mechanisms include kinetic, binary, ternary, ion-induced or ion-mediated nucle-ation, and the activation and growth of persistent neutral or charged molecular clusters (Hoppel et al., 1994; Yu and Turco, 2001; Lee et al., 2003; Kulmala et al., 2004a, 2006, 2007a).
Several laboratory and field studies suggest that sulfu-ric acid and sulfate clusters are likely participants in atmo-spheric nucleation and growth (Weber et al., 1997; Hanson and Eisele, 2002; Berndt et al., 2005; Sihto et al., 2006; Ri-ipinen et al., 2007). However, there are also observations that imply that the ambient sulfuric acid concentrations can-not explain the observed nucleation and growth completely (Fiedler et al., 2005; Boy et al., 2005), particularly in rural environments. On the other hand, a clear link between at-mospheric aerosol formation and the emissions of biogenic organics has been reported in several studies (O’Dowd et al., 2002; Birmili et al., 2003; Kulmala et al., 2004b, c; Tunved et al., 2006).
The key to the quantification of the compounds participat-ing in the atmospheric particle formation would naturally be direct and accurate measurements of the composition of the freshly formed aerosol particles and clusters. These kinds of measurements, however, are challenging because of the minuscule masses of the freshly formed particles and lim-ited duration of the particle formation events (of the order of hours). Therefore direct measurements on the particle com-position, e.g. filter sampling and mass spectrometric studies, are typically limited to size ranges above 30–40 nm.
Recent mass spectrometric studies on the composition of nucleation mode particles include e.g. those by Zhang et al. (2004), Smith et al. (2005), and Allan et al. (2006). The two first papers studied nucleation mode particles in Pitts-burgh and Atlanta, US, and reported sulfuric acid or ammo-nium sulfate as the predominant species in the aerosol, Smith et al. (2005) measuring particles even as small as 10 nm. The latter study analysed particle formation and growth events in Hyyti¨al¨a, concluding that during the condensational growth process, the sub-100 nm particles were principally organic in composition, although also sulfates were present in sig-nificant amounts. M¨akel¨a et al. (2001) observed increased amounts of dimethylamine in the accumulation mode par-ticles during particle formation events compared to non-events, based on samples collected by a cascade impactor and analysed using ion chromatography.
Because of the difficulties in direct particle composition measurements below 20 nm, indirect methods such as mea-surement of particle volatility or hygroscopicity are often used. However, also the conventional hygroscopicity and volatility measurement setups (e.g. Hygroscopicity Tandem Differential Mobility Analyzer, HTDMA; Volatility Tan-dem Differential Mobility Analyzer, VTDMA) are limited to larger than approximately 10 nm particles in atmospheric conditions, due to the relatively low concentrations of the small particles, particularly in remote conditions. Sakurai et al. (2005) reported hygroscopicity results even down to 4 nm for an urban site in Atlanta, and concluded that the freshly-formed particles in this rather polluted site were most likely consisting mainly of ammonium sulfate. Ehn et al. (2007a) measured the hygroscopicity of aerosol particles down to 10 nm in Hyyti¨al¨a, and observed a clear correlation between the hygroscopicity of the growing aerosol mode and ambi-ent sulfuric acid concambi-entrations. They also observed that as the freshly formed aerosol was growing further, its hygro-scopicity decreased, indicating the condensation of a less hy-groscopic, probably organic (e.g. Varutbangkul et al., 2006), species. O’Dowd et al. (2002) presented a comparison of ambient Pulse Height-CPC (Saros et al., 1996) spectra to those produced by ammonium sulfate, pinic and cis-pinonic acids, concluding that ammonium sulfate is not likely to be the main constituent of 3–5 nm particles in Hyyti¨al¨a, but that the particles are rather consisting mainly of organics. Kul-mala et al. (2004b), on the other hand, suggested that sul-furous compounds contribute to the initial steps of particle formation and growth, whereas organics participate in the later stages of the growth. To resolve the questions raised by the afore-mentioned studies on the relative role of sulfu-ric acid and organics in different stages of particle formation and growth, more measurements on the composition of sub-10 nm particles are needed.
Recently Kulmala et al. (2007b) presented a novel in-strumental setup, the Condensation Particle Counter Battery (CPCB), which can be used to study the concentrations and constituents of particles even smaller than 3 nm. The CPCB consists of four Condensation Particle Counters (CPCs, see e.g. McMurry, 2000), two working with butanol (TSI-3010 and TSI-3025, also referred to as CPC and UCPC, TSI Inc., Shoreview, MN, USA) and two with water (TSI-3875 and TSI-3786, or WCPC and UWCPC, TSI Inc., Shoreview, MN, USA) as the condensing vapor. The different vapors lead to differences in the sizes of the smallest detected particles, de-pending on the composition of the sampled aerosol. If the smallest particles have a higher affinity for water than for butanol, the 50% cut-off sizes (D50) of the water-CPCs are
significantly (Hering et al., 2005; Pet¨aj¨a et al., 2006; Kulmala et al., 2007b). Such clear dependence on the water-solubility of the sample has not been observed for the cut-off sizes of the butanol-CPCs (see e.g. Sem, 2002).
We present data collected with the CPCB in March – May 2006 in Hyyti¨al¨a, Finland. The affinity of freshly-formed 2–9 nm particles to water or butanol is investigated by com-paring the concentrations measured by the two CPC pairs of the CPCB. We estimate the ambient 50% cut-off sizes of the CPC pairs and use this data to assess the water solubility of the 2–9 nm particles. Finally, the relative roles of sulfurous compounds and organics in particle formation and growth are discussed.
2 Methods
The field measurements were conducted at the SMEAR II station in Hyyti¨al¨a, Southern Finland (61◦51′N, 24◦17′E, 181 m above sea level, Hari and Kulmala, 2005) during 6 March – 31 May 2006. The station is located in a bo-real forest with Scots pine as the dominating species, and is equipped with various continuous measurements on the dynamics of the atmospheric composition and atmosphere-biosphere interactions. The largest city near the SMEAR II station is Tampere, located about 60 km from the measure-ment site and having approximately 200 000 inhabitants. At-mospheric new particle formation and growth events are ob-served at the SMEAR II station on 60–120 days a year (Dal Maso et al., 2005), and the frequency of these events has its maximum during the spring. These events typically show a formation of new nucleation mode, growing continuously for several hours. The continuity of the growth, along with simultaneous observations from other Nordic measurement stations, suggests that the nucleation events take place over a regional scale of typically hundreds of kilometres (Hussein et al., 2009).
Data from measurements with the Condensation Parti-cle Counter Battery (CPCB), Neutral cluster and Air Ion Spectrometer (NAIS) and Differential Mobility Particle Sizer (DMPS) form the basis of the analysis presented in this work. All the measurements were performed inside the atmospheric boundary layer and inside the boreal forest canopy. Hot air balloon measurements by Laakso et al. (2007) indicate that the particle concentrations seem to be well-mixed through-out the boundary layer during particle formation events. In-situ particle size measurements on an airplane by O’Dowd et al. (2009) show a similar homogeneous distribution of parti-cles between 3–6 nm inside the mixed boundary layer.
2.1 Instrument description
2.1.1 Condensation Particle Counter Battery (CPCB)
Condensation Particle Counter (CPC) is an instrument which measures the number concentration of aerosol particles
on-Butanol
TSI 3025 (UCPC)
D50= 3.8 nm
Water
TSI 3786 (UWCPC)
D50= 3.6 nm
Ambient aerosol
Butanol
TSI 3010 (CPC)
D50= 8.7 nm
Water
TSI 3785 (WCPC)
D50= 9.0 nm
Inlet inside canopy, 2 m above ground level, tube diameters 6 mm
25 cm, 4.1 lpm
35 cm, 2.0 lpm 10 cm,
1.5 lpm
10 cm, 0.6 lpm
10 cm, 1.0 lpm
10 cm, 1.0 lpm
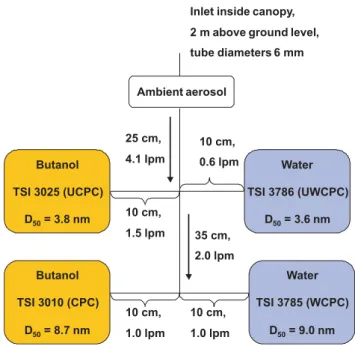
Fig. 1. A schematic figure of the setup of Condensation Particle Counter Battery (CPCB) used in this study. The CPCs using butanol as the working fluid are presented on yellow background, whereas the water-CPCs are on the blue background. The cut-off sizes set before the field measurents with silver particles are indicated under each individual CPC.
line, typically with a time resolution of the order of sec-onds. The working principle of the CPC is based on three processes: (1) creation of a supersaturated vapor (working fluid), (2) growth of aerosol particles by condensation of these supersaturated vapors, (3) optical detection of the par-ticles after their growth. Different types of CPCs have differ-ent techniques of creating vapor supersaturation. The most common type is the laminar flow chamber CPC, which has no movable parts and therefore is suitable for long-term at-mospheric observations. Recent developments of CPCs in general have aimed, for instance, at improving the detection efficiency (Stoltzenburgh and McMurry, 1991) and response time (Sgro and Fern´andez de la Mora, 2004). For a compre-hensive summary of the history and principles of CPCs see e.g. McMurry (2000).
2 4 6 8 10 12 14 16 18 0
0.1 0.2 0.3 0.4 0.5 0.6 0.7 0.8 0.9 1
Particle diameter [nm]
Detection efficiency WCPC
CPC UWCPC
UCPC 50% cut−off
(a)
2 4 6 8 10 12 14 16 18
0 0.1 0.2 0.3 0.4 0.5 0.6 0.7 0.8 0.9 1
Particle diameter [nm]
Detection efficiency WCPC
CPC
UWCPC
UCPC 50% cut−off
(b)
Fig. 2. The detection efficiencies of the individual CPCs in the
CPCB, as measured for insoluble silver particles before(a)and after
(b)the measurement campaign in Hyyti¨al¨a. Water-CPCs are
indi-cated in blue and butanol- CPCs in red. The black line indicates the 50% detection efficiency limit (corresponding to the cut-off sizes D50).
particles will be detected down to lower particle sizes in the water-CPCs; therefore an increased count rate will be measured in comparison to the butanol-CPCs. The differ-ential signal between the water and butanol-CPCs of each pair is then expected to be related to the presence of hygro-scopic particles in the size range of the corresponding cut-off regions. For lipophilic particles, the reverse may be true: if the activation probability of lipophilic particles is higher in butanol vapor than in water, the CPCB will be sensitive to the presence of lipophilic particles in the size range of the two cut-offs.
To determine the “reference state” of the CPCB for in-soluble particles, the detection efficiencies of all four CPCs were carefully measured in the calibration set-up presented by Mordas et al. (2005). The reference instrument used in the calibrations was a TSI 3068 electrometer, operated with a flow rate of 3.7 l min−1. Briefly, practically monodisperse and spherical silver particles below 40 nm were generated by a combination of a furnace generator and a differential mo-bility analyzer (Scheibel and Porstend¨orfer, 1983). Before measuring in the field, the cut-off sizes of the two butanol-CPCs, the TSI-3025 and the TSI-3010, were determined to be 3.8±0.3 and 8.7±0.3 nm, respectively. The cut-off sizes of the two water-CPCs, the TSI-3786 and the TSI-3785, were adjusted so that they matched exactly the cut-off of the cor-responding butanol-CPCs. In practice this was achieved by varying the temperature difference between the saturator and the growth tube inside the water-CPCs (Pet¨aj¨a et al., 2006) until agreement between the cut-off diameters was reached. The particular temperature differences were 71 K for the TSI 3786, and 34 K for the TSI 3785, and were used as opera-tional values during all subsequent experiments. The detec-tion efficiencies of the CPCs in the CPCB before the field measurement campaign are presented in Fig. 2a.
The ambient aerosol particle concentrations were moni-tored at the SMEAR II station during 6 March – 31 March 2006 with all the four CPCs of the CPCB continuously and simultaneously, the time resolution of the instruments being 10 s. Atmospheric aerosol was sampled below the canopy, 2 m above the ground level, using stainless steel tubes with inner diameter of 6 mm. The sampling line length was 25 cm for the UCPC-UWCPC pair and 60 cm for the CPC-WCPC pair. After these lines, the flow was divided to the sampling lines of each individual instrument, being 10 cm for each. The corresponding flows were 1.5, 0.6, 1.0 and 1.0 l min−1 for the UCPC, UWCPC, CPC and WCPC, respectively (see Fig. 1). To minimize losses the sampling lines were con-structed to have as few turns as possible. The corresponding penetration efficiencies for 10 cm the tubing at the cut-off sizes of the instruments were estimated to be approximately 0.94 and 0.88 for the UCPC and UWCPC, and over 0.95 for the CPC and WCPC. To minimize the effects of the slightly different losses in the CPCs, when comparisons between the CPC pairs were made, only the concentration ratios between the different instruments were analysed. However, shortly af-ter the beginning of the measurements (14 March 2006) the TSI-3010 CPC needed to be replaced with a new instrument having aD50of 10.7±0.3 nm, being slightly higher than the D50of the corresponding WCPC.
10−8 10−7
Diameter [m]
103 104 105
Concentration [cm
−3
]
20/03 21/03 22/03 23/03 24/03
1 1.5 2
Date
Concentration ratio
UCPC UWCPC CPC WCPC
WCPC/CPC UWCPC/UCPC
10 100 1000 10000
dN/dlogD p (cm−3)
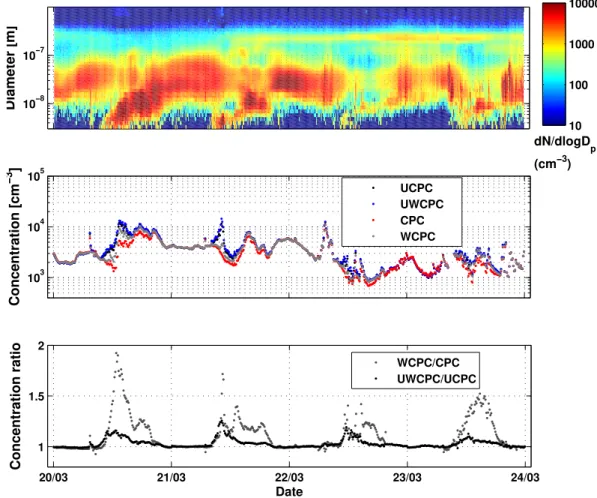
Fig. 3a.Particle concentrations (middle) and water- to butanol-CPC concentration ratios (bottom) measured by the CPCB on(a)the period
20–23 March 2006 of four consecutive NPF event days;(b)the period 21–24 May 2006 of four consecutive days with no clear indications
of NPF or growth. The corresponding particle size distributions measured with the DMPS are presented for comparison (top).
period. The detection efficiency curves of the CPCs after the measurement campaign are presented in Fig. 2b.
2.1.2 Neutral cluster and Air Ion Spectrometer (NAIS)
The NAIS is an instrument which measures mobility distri-butions of neutral and charged aerosol particles and clusters in the range from 2.39 to 0.0010 cm2V−1s−1. This corre-sponds to a diameter range of approximately 0.8 to 47 nm (Kulmala et al., 2007a). The working principle of the NAIS is based on unipolar charging of sampled particles and their subsequent classification with an electrical mobility analyzer and detection with a set of electrometers. The time resolution of the NAIS is 5 min.
The NAIS has been developed from the Air Ion Spectrom-eter (AIS, Airel Ltd., Estonia, Mirme et al., 2007). It has 21 electrometer rings in the inside-out differential mobility analyzers. Unlike the AIS, the NAIS has two unipolar corona chargers prior to the mobility analyzers – one for positive and one for negative charging – and electrostatic post-filters.
These post-filters are used to remove excess ions generated by the chargers. The particle charging probabilities are es-timated from Fuchs’ theory (Fuchs and Sutugin, 1970). The lower detection limit of the NAIS is determined by the charg-ing probabilities, cluster concentration, and the charger ion masses and mobilities. The charger ion mobilities from 1.3 to 1.6 cm2V−1s−1 define the lowest estimation for the de-tection limit, which is approximately 2 nm. Particles below this limit cannot reliably be distinguished from the charger ions.
The sample and sheath flows of the analyzers are 0.5 l s−1
and 1 l s−1, respectively. A closed loop sheath flow
arrange-ment is used in both analyzers. The noise and the offset of the electrometers are measured by sampling through a sec-ond filter consisting of a unipolar corona charger and an electrostatic filter. Similar filtration is used also for clean-ing the re-circulated sheath air.
10−8 10−7
Diameter [m]
103 104 105
Concentration [cm
−3
]
21/05 22/05 23/05 24/05 25/05
1 1.5 2
Date
Concentration ratio
WCPC/CPC UWCPC/UCPC
UCPC UWCPC CPC WCPC
10 100 1000 10000
dN/dlogD p (cm−3)
Fig. 3b.Continued.
stainless steel tube of 34 mm inner diameter. The inlet is ap-proximately 2 m above the ground. The particle losses inside the tubings are taken into account in the NAIS data inversion. However, due to the very high flow rates in the instruments the diffusion losses of even the smallest ions are negligible in the framework of this study.
2.1.3 Differential Mobility Particle Sizer (DMPS) system
Continuous particle size distribution measurements between 3 and 1000 nm have been carried out with a Differential Mobility Particle Sizer (DMPS) system since 1996 at the SMEAR II station. The setup in Hyyti¨al¨a is a twin-DPMS, consisting of two separate DMPS systems: the first DMPS measures particles starting from 3 nm (applying a TSI-3025 CPC), and the second from 10 nm (with a TSI-3010 CPC). The sheath flows in the system are maintained using a closed-loop arrangement (Jokinen and M¨akel¨a, 1997). The aerosol sample is collected from 8 m above ground level through a 8.5 m long tube with an inner diameter of 10 cm and a flow velocity of 236 l min−1. The sample is conducted to the DMPS system from the center of this tube through a 35 cm
long secondary tube with 6 mm inner diameter. The sample flows further in the two DMAs are 1 l min−1and 4 l min−1.
For a detailed description of the DMPS setup applied in Hyyti¨al¨a, we direct the reader to Aalto et al. (2001).
2.2 Data processing
In the data analysis we averaged the data over 5 min periods. Because of minor drifts in the flows inside the CPCs during the measurement period, the nighttime values of WCPC/CPC and UWCPC/UCPC concentration ratios were normalised to unity, since during the nights no particles in the size range 3–10 nm were typically observed.
efficiency curve towards smaller sizes to match the measured and predicted concentrations. To get the maximum estimate for theD50 in the WCPC we assumed that the ambient
cut-off size of the butanol-CPC is close to that determined for insoluble particles.
The obtained ambientD50 values were compared to the D50values for insoluble particles to yield the corresponding
hygroscopic growth factors
GF = D50,wet D50,dry
(1) of the freshly nucleated particles inside the saturator of the water-CPCs, where RH is close to 100%. D50,dry is the
cut-off size for corresponding insoluble particles, whereas
D50,wet refers to the cut-off size for the hygroscopic
parti-cles, as they are assumed to grow in the saturator. It should be borne in mind, however, that this approach for estimating the GFonly accounts for the effect of the particle size on the activation probability inside the condenser of the water-CPCs, assuming that the effect of the particle composition is mainly due to the different hygroscopic growth inside the saturator. Therefore the obtained estimations for the growth factors should be treated as indicative rather than as absolute numbers. The effect of the curvature on the growth of the droplet was taken into account by normalizing theGF val-ues obtained directly from the measurements with the Kelvin effect for water (see e.g. Swietlicki et al., 2008)
GFeff=1+(GF−1)·exp
4Mσ RT Dρ
, (2)
whereσ is the surface tension of the droplet,ρis its density,
Mthe molar mass,R the molar gas constant,T the temper-ature andDthe diameter of the droplet. Since we could not assume anything about the droplet composition, we assumed the surface tension and density of the droplet to be close to those of water.
Similar analysis as described above for the DMPS data was done comparing the UWCPC/UCPC concentration ra-tios and the size distributions measured with the NAIS (Kul-mala et al., 2007a). This comparison provides a reference of the total particle concentrations down to 2 nm and there-fore allows for estimates on the ambient cut-off sizes of the UWCPC/UCPC pair as well as growth factors inside the UWCPC. Particle charging in the NAIS is done with a unipo-lar corona changer. This might result in the charger ions interfering with the ambient particle signal at the smallest particle sizes and thus add an additional uncertainty in our analyses. Asmi et al. (2009) reported the results of labora-tory calibrations of the NAIS, and concluded that, at least in room air, the charger ion distribution typically did not extend significantly over 2 nm. At least some part of the bias result-ing from the possible interference of the charger ions should, however, be avoided by comparing the concentration ratios instead of the absolute concentrations shown by the CPCs and the NAIS.
The ambient cut-off sizes of the CPCB were estimated also using lognormal size distribution fits done for the DMPS data. If a clear growing nucleation mode was present, the fit-ted nucleation mode was extrapolafit-ted to sizes below 2 nm to obtain a reference for the sub-3 nm size range. The simulated mode was weighted with the detection efficiency functions and compared to the particle concentrations observed with the water/butanol-CPC pairs. It was assumed that the shape and growth rate of the nucleation mode stayed relatively con-stant also during the first steps of the nucleation to be able to assess the lowest detection limit of the CPCB. In all the cut-off size analyses described above, we used the averages of the detection efficiency curves measured before and after the measurement campaign.
To further study implications on the hygroscopicity and composition of the freshly formed nucleation mode, the CPCB data was compared with the results obtained from the HTDMA measurements conducted in Hyyti¨al¨a during spring 2005 (Ehn et al., 2007a). Comparison was also done with the ambient sulfuric acid concentrations and the fraction of particle growth rates at 1.3–3 nm and 3–7 nm explained by the condensation of sulfuric acid. Estimations for the ambi-ent sulfuric acid concambi-entrations were calculated with a quasi-steady state model (Boy et al., 2005). The growth rates for 1.3–3 and 3–7 nm particles were determined from the ion-spectrometer data continuously measured in Hyyti¨al¨a (Hir-sikko et al., 2005). The theoretical growth rates at 1.3– 3 and 3–7 nm caused by the ambient sulfuric acid concen-trations were calculated as presented by Lehtinen and Kul-mala (2003).
3 Results and discussion
3.1 Concentration ratios between the water and butanol CPCs
0 6 12 18 24 1
1.1 1.2 1.3
UWCPC/UCPC
0 6 12 18 24
1 1.1 1.2 1.3
WCPC/CPC
0 6 12 18 24
1 1.1 1.2 1.3
UWCPC/UCPC
Time [h]
0 6 12 18 24
1 1.1 1.2 1.3
WCPC/CPC
Time [h]
NPF event NPF event
Non−event Non−event
Fig. 4. The median (blue) diurnal behavior of the UWCPC/UCPC (left) and WCPC/CPC (right) ratios on NPF event (top) and non-event (bottom) days during the measurement period in spring 2006. The black lines refer to the 25- and 75-percentiles.
were observed (Fig. 3b). The same behavior can be seen in Fig. 4, which shows the median diurnal behavior of the UWCPC/UCPC and WCPC/CPC concentration ratios on the 32 NPF event and 15 non-event days over the whole mea-surement period. The WCPC/CPC concentration ratio is typically slightly higher than the UWCPC/UCPC ratio. At least part of this can be explained by the fact that during most of the measurement period the CPC measured with a slightly higher cut-off size (also for insoluble particles) than the WCPC, whereas the cut-off sizes of the UWCPC and UCPC matched better (see Fig. 2a and b).
3.2 Ambient cut-off sizes and effective growth factors of the water-based CPCs
The ambient cut-off sizes of the WCPC and UWCPC dur-ing particle formation episodes were determined by compar-ing the CPCB data to the size distributions measured by the DMPS and NAIS, as well as to size distributions obtained by lognormal fits to DMPS data. Figure 5 illustrates this anal-ysis for a particle formation event on 23 April 2006. The top panel indicates the size distribution data measured by the DMPS. The total concentration measured by the DMPS sys-tem, the concentrations obtained from the DMPS size dis-tribution weighted with the WCPC and CPC detection ef-ficiency curves (see Fig. 2a and b), and the concentrations measured by the WCPC and CPC are shown in the middle panel. The bottom panel shows the measured WCPC/CPC
concentration ratio along with the ratios predicted from the DMPS data assuming either no shift in the WCPC cut-off size or that D50=7.5 nm (1.5 nm shift compared to
insolu-ble silver particles), corresponding to the best match with the measured concentration ratio. The shift in the cut-off size can be used to estimate the effective hygroscopic growth factor inside the WCPC,GFeff. In the best-match case presented in
Fig. 5,GFeff=1.4. A similar example for the ultrafine CPCs
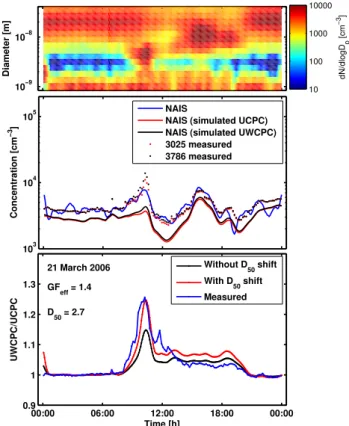
and NAIS comparison is shown in Fig. 6 for a particle forma-tion event on 20 March 2006, now yieldingD50=2.7 (0.9 nm
shift compared to insoluble particles) andGFeff=1.4 for the
UWCPC. AlthoughD50 andGFeff are likely to vary during
the day, usually only one value per day was fitted for both parameters. Only if two very distinct peaks in the concentra-tion ratios were observed, two values are reported. On these kinds of days, it was noted that the later value ofD50 was
always larger than the earlier, corresponding to lower hygro-scopic growth factor as the aerosol grows in size and ages during the day.
As can be seen from Figs. 5 and 6, the temporal evolution of the measured concentration ratios can typically be pre-dicted quite well from the DMPS and NAIS size distribution data. The detailed analysis also verifies that usually the dif-ferences in the concentrations measured by the water and butanol-CPCs cannot be explained only by the different shapes of the detection efficiency functions (Fig. 2a and b), but in fact a shift in theD50 of the water-CPCs is needed to
10−9 10−8 10−7 10−6
Diameter [m]
103 104 105
Concentration [cm
−3
]
DMPS
DMPS (simulated CPC) DMPS (simulated WCPC) CPC measured WCPC measured
00:00 06:00 12:00 18:00 00:00 0.8
1 1.2 1.4 1.6 1.8
Time [h]
WCPC/CPC
Without D50 shift With D50 shift Measured
dN/dlogD
p
[cm
−3
]
10 100 1000 10000
23 April 2006
GFeff = 1.4
D50 = 7.5 nm
Fig. 5. Comparison between DMPS size distribution data and the concentrations measured by WCPC and CPC on a particle for-mation event day on 23 April 2006. Top: the size distributions measured by the DMPS. Middle: the total concentration measured by the DMPS (blue curve), the concentrations corresponding to the DMPS size distribution weighted with the detection efficiency curves of the WCPC (black curve) and CPC (red curve) for insol-uble particles, and the total concentrations measured by the WCPC (black dots) and CPC (red dots). Bottom: the measured WCPC to CPC concentration ratio (blue) and as predicted from the DMPS data assuming (1) the detection efficiency curves according to cali-brations with insoluble particles (black); (2) the cut-off size of the WCPC to be shifted to 7.5 nm (red).
to measure slightly higher concentrations than predicted by simply weighting the DMPS or NAIS size distributions with the detection efficiencies for totally insoluble silver particles (middle panel in Figs. 5 and 6). One reason for this could be that the ambient cut-off size of the butanol-CPC is also somewhat shifted compared to that of totally insoluble parti-cles.
Figure 7 shows the ambientD50values determined for the
whole measurement period with different methods. The left panel contains the cut-off sizes determined for the WCPC from the DMPS data and the corresponding size distribu-tion fits. The right panel contains the cut-off sizes of the UWCPC obtained from the NAIS data with positive and negative charging of the sample (Kulmala et al., 2007a), as well as from the size distribution fits to DMPS data. The
103 104 105
Concentration [cm
−3]
NAIS
NAIS (simulated UCPC) NAIS (simulated UWCPC) 3025 measured 3786 measured
00:00 06:00 12:00 18:00 00:00 0.9
1 1.1 1.2 1.3
Time [h]
UWCPC/UCPC
Without D50 shift With D
50 shift Measured 10−9
10−8
Diameter [m] dN/dlogD
p
[cm
−3
]
10 100 1000 10000
21 March 2006
GF eff = 1.4
D 50 = 2.7
Fig. 6. Comparison between NAIS size distribution data and the concentrations measured by UWCPC and UCPC on a particle for-mation event day on 21 March 2006. Top: the size distributions measured by the NAIS. Middle: the total concentration measured by the NAIS (blue curve), the concentrations corresponding to the NAIS size distribution weighted with the detection efficiency curves of the UWCPC (black curve) and UCPC (red curve) for insolu-ble particles, and the total concentrations measured by the UWCPC (black dots) and UCPC (red dots). Bottom: the measured UWCPC to UCPC concentration ratio (blue) as predicted from the NAIS data assuming (1) the detection efficiency curves according to cali-brations with insoluble particles (black); (2) the cut-off size of the UWCPC to be shifted to 2.7 nm (red).
methods yield consistent results, giving 7.1–7.2 nm and 2.5– 2.6 nm as the median values of the ambient cut-off sizes of the WCPC and UWCPC, respectively. The corresponding shifts in the cut-off sizes compared to insoluble particles are thus 1.8–1.9 and 0.8–0.9 nm. These values correspond to the averages of detection efficiency curves before and af-ter the measurements, and the average uncertainty resulting from this approximation is 0.3 nm for both CPC pairs. Be-sides this uncertainty, there is naturally an error related to the size distributions measured by the DMPS and NAIS setups, which increases the overall uncertainty of the results. Also, the values should be considered as maximum estimates, as no shift for the ambientD50values of the butanol-CPCs was
DMPS Fits to DMPS 4
5 6 7 8 9
D50
[nm]
42 30
NAIS (+) NAIS (−) Fits to DMPS 1.8
2 2.2 2.4 2.6 2.8 3 3.2
16 8 29
WCPC UWCPC
Fig. 7. The ambient 50% cut-off sizes of the WCPC (left) and UWCPC (right) during NPF events in spring 2006, as obtained with different methods. The numbers above the figures refer to the number of particle formation event days included in the analysis. The red lines show the medians, the boxes indicate the 25- and 75-percentiles, and the error bars the 5- and 95-percentiles.
the corresponding values for the UWCPC. It is possible that the composition of the smallest particles varies less from day to day, whereas in the larger sizes there are more different vapors contributing to their growth on different days. Also the Kelvin effect of the smaller particles is larger, making the detection efficiency less sensitive to the composition of the particles in comparison with their size.
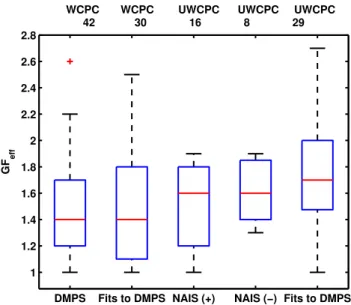
Figure 8 contains the effective hygroscopic growth factors inside the water-CPCs obtained from the D50 values, and
normalized with respect to the particle size. Again, all the different approaches give similar results, yielding a median
GFeff of 1.4 for the WCPC and 1.6–1.7 for the UWCPC.
One must be careful, however, when interpreting the data, as these growth factors would correspond to the case where the particle size is the main factor limiting the activation in the growth tube of the water-CPCs. This is likely not to be exactly the case, as also the composition of the droplets prob-ably plays a role also in the growth tube. The growth factors presented here should thus be treated as indicative rather than exact numbers. However, the results for the WCPC are some-what similar with results obtained from HTDMA data from Hyyti¨al¨a: Ehn et al. (2007a) report hygroscopic growth fac-tors of roughly 1.2–1.4 for 10 nm particles at 88% relative humidity, which would correspond to 1.3–1.5, if normalized with respect to particle size (see Eq. 2).
The slightly higher growth factors for the smaller sizes indicate higher hygroscopicity as compared with the larger, more aged particles, implying that the vapors participating in the later stages of the particles growth are less hygroscopic than the vapors responsible for the initial steps of particle formation and growth. This supports the idea presented by e.g. Kulmala et al. (2004b) and Hirsikko et al. (2005), sug-gesting that the relative role of organic compounds compared to e.g. sulfurous substances increases with increasing size. It is also possible that the condensing organics oligomer-ize (Kalberer et al., 2004), which is catalysed by
particu-DMPS Fits to DMPS NAIS (+) NAIS (−) Fits to DMPS 1
1.2 1.4 1.6 1.8 2 2.2 2.4 2.6 2.8
GF
eff
WCPC WCPC UWCPC UWCPC UWCPC 42 30 16 8 29
Fig. 8.The effective growth factors inside the WCPC and UWCPC during NPF events in spring 2006 according to different methods. The numbers above the figures refer to the number of particle for-mation event days included in the analysis. The red lines show the medians, the boxes indicate the 25- and 75-percentiles, and the error bars the 5- and 95-percentiles.
late phase sulfuric acid (Jang et al., 2002), and form a non-volatile – and probably also less hygroscopic – growing core to the particle, as has been observed also in previous stud-ies (Kalberer et al., 2002; Wehner et al., 2005; Ehn et al., 2007b).
As ammonium sulfate has been observed to be a major component of atmospheric nanoparticles (Hanson and Eisele, 2002; Smith et al., 2005; Sakurai et al., 2005), the obtained
GFeff values were compared with UWCPC detection
effi-ciency curves obtained for pure laboratory-generated ammo-nium sulfate particles (Kulmala et al., 2007b). Kulmala et al. (2007b) observed that theD50 of the UWCPC decreased
from 3 nm to 2.3 nm, if ammonium sulfate aerosol was used instead of silver particles. This would correspond to aGFeff
larger than 1.8, indicating that even though clearly water sol-uble, the ambient aerosol near 3 nm might be less hygro-scopic than ammonium sulfate. This observation points to the possible role of water-soluble organics even in the very initial steps of aerosol growth, although, as noted above, their influence gets larger as the particles grow further. There were days however, when effective growth factors of 1.8 and even larger were observed (see Fig. 8). On these days the hygro-scopic properties of the freshly formed aerosol do resemble those of ammonium sulfate.
3.3 Comparison to ambient sulfuric acid concentrations
acid concentrations with a pseudo-steady state model intro-duced by Boy et al. (2005), which predicts sulfuric acid concentrations based on data of UVB radiation, gas phase SO2, background particle concentrations and estimations on
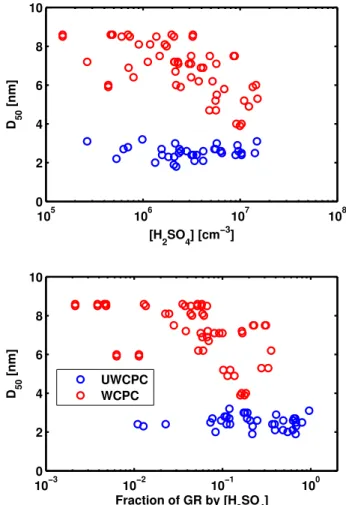
the VOC concentrations. In Fig. 9 the ambient cut-off sizes of the water-CPCs are plotted against the sulfuric acid concentration and the fraction of the 1.3–3 (in the case of UWCPC) and 3–7 nm (in the case of WCPC) growth rates explained by the condensation of sulfuric acid. The cut-off sizes of the WCPC show a very clear negative correlation with sulfuric acid. This is expected, as sulfates are very hy-groscopic (H¨ameri et al., 2001). In the case of the UWCPC not such a clear correlation is seen. This observation sug-gests that at the smaller sizes sulfuric acid alone does not seem to control the hygroscopicity of the particles. At the larger sizes, on the other hand, the hygroscopicity seems to be controlled by sulfuric acid concentrations. The fraction of growth rates explained by sulfuric acid condensation is typi-cally of the order of 10% and even less in the case of 3–7 nm particles, whereas at 1.3–3 nm the fraction ranges between 10 to 100%. However, even at the smallest sizes, the cases where sulfuric acid could explain the observed growth rates totally are very few. Thus some other condensing vapors, presumably organics, are needed to participate in the growth process also in sizes close to 1.3–3 nm.
4 Conclusions
We conducted measurements on the concentrations of freshly-nucleated 2–9 nm particles with the Condensation Particle Counter Battery (CPCB) at a boreal forest site in Hyyti¨al¨a, Finland during March – May 2006. It was observed that during new particle formation events, the water-based CPCs measured consistently more particles than the butanol-based instruments. This indicates that the ambient cut-off size of the water-CPCs is lower than the corresponding limit for butanol-CPCs, suggesting further that the freshly formed particles have a higher affinity to water than to butanol.
To quantify the decrease in the water-CPC cut-off sizes, the concentrations measured by the CPCB were compared to particle size distribution data recorded by the DMPS and NAIS systems. This analysis suggested that the ambient cut-off sizes of the water-based instruments were lowered with 1.8–1.9±0.3 nm (WCPC) and 0.8–0.9±0.3 nm (UWCPC) compared to the cut-off sizes for completely insoluble sil-ver particles, which were 9.0 nm for the WCPC and 3.6 nm for the UWCPC. The determined ambient cut-off sizes of the two water-CPCs were normalized with respect to the Kelvin effect and compared with (1) each other; (2) the correspond-ing values for pure ammonium sulphate particles. Based on these comparisons, two main conclusions could be made. First, it was observed that the freshly-formed aerosol was more hydrophilic at sizes close to 3 nm than at 9 nm, sug-gesting that the fraction of organic compounds as compared
105 106 107 108
0 2 4 6 8 10
[H
2SO4] [cm −3
] D 50
[nm]
10−3 10−2 10−1 100
0 2 4 6 8 10
Fraction of GR by [H 2SO4] D 50
[nm] UWCPC WCPC
Fig. 9. The 50% cut-off sizes of the WCPC (red) and UWCPC (blue) as a function of modeled ambient sulfuric acid concentration (top) and the fraction of 3–7 (for WCPC) and 1.3–3 (for UWCPC) nm growth rates explained by sulfuric acid condensation (bottom).
to sulfates in the condensational growth of particles increased with the particle size. Second, it was noted that the contribu-tion of organics is possible even at sizes close to 3 nm: the ambient aerosol seemed to be less hygroscopic than pure am-monium sulfate or sulfuric acid, the results close to 3 nm be-ing, however, subject to a larger uncertainty due to the inter-pretation of the data and e.g. diffusional losses of the particle inside the instrumentation.
activation behavior of particles containing atmospherically relevant compounds, particularly organics, are needed.
Acknowledgements. I. R. acknowledges Maj and Tor Nessling foundation for funding and Kari E. J. Lehtinen and V.-M. Kerminen for valuable discussions. The National Center for Atmospheric Research is sponsored by the National Science Foundation.
Edited by: O. Hov
References
Aalto, P. P., H¨ameri, K., Becker, E., Weber, R., Salm, J., M¨akel¨a, J. M., Hoell, C., O’Dowd, C. D., Karlsson, H., Hansson, H.-C., V¨akev¨a, M., Koponen, I. K., Buzorius, G., and Kulmala, M.: Physical characterization of aerosol particles during nucleation events, Tellus B, 53, 344–348, 2001.
Allan, J. D., Alfarra, M. R., Bower, K. N., Coe, H., Jayne, J. T., Worsnop, D. R., Aalto, P. P., Kulmala, M., Hy¨otyl¨ainen, T., Cav-alli, F., and Laaksonen, A.: Size and composition measurements of background aerosol and new particle growth in a Finnish forest during QUEST 2 using an Aerodyne Aerosol Mass Spectrome-ter, Atmos. Chem. Phys., 6, 315–327, 2006,
http://www.atmos-chem-phys.net/6/315/2006/.
Asmi, E., Sipil¨a, M., Manninen, H. E., Vanhanen, J., Lehtipalo, K., Gagn´e, S., Neitola, K., Mirme, A., Mirme, S., Tamm, E., Uin, J., Komsaare, K., Attoui, M., and Kulmala, M.: Results of the first air ion spectrometer calibration and intercomparison workshop, Atmos. Chem. Phys., 9, 141–154, 2009,
http://www.atmos-chem-phys.net/9/141/2009/.
Berndt, T., B¨oge, O., Stratmann, F., Heitzenberg, J., and Kul-mala, M.: Rapid formation of sulfuric acid particles at near-atmospheric conditions, Science, 307, 697–700, 2005.
Birmili, W., Berresheim, H., Plass-D¨ulmer, C., Elste, T., Gilge, S., Wiedensohler, A., and Uhrner, U.: The Hohenpeissenberg aerosol formation experiment (HAFEX): a long-term study
in-cluding size-resolved aerosol, H2SO4, OH, and monoterpenes
measurements, Atmos. Chem. Phys., 3, 361–376, 2003, http://www.atmos-chem-phys.net/3/361/2003/.
Boy, M., Kulmala, M., Ruuskanen, T. M., Pihlatie, M., Reissell, A., Aalto, P. P., Keronen, P., Dal Maso, M., Hell´en, H., Hakola, H., Jansson, R., Hanke, M., and Arnold, F.: Sulfuric acid closure and contribution to nucleation mode particle growth, Atmos. Chem. Phys., 5, 863–878, 2005,
http://www.atmos-chem-phys.net/5/863/2005/.
Dal Maso, M., Kulmala, M., Riipinen, I., Wagner, R., Hussein, T., Aalto, P. P., and Lehtinen, K. E. J.: Formation and growth of fresh atmospheric aerosols: eight years of aerosol size distribution data from SMEAR II, Hyyti¨al¨a, Finland, Boreal Environ. Res., 10, 323–336, 2005.
Ehn, M., Pet¨aj¨a, T., Afmhoff, H., Aalto, P. P., H¨ameri, K., Arnold, F., Laaksonen, A., and Kulmala, M.: Hygroscopic properties of ultrafine aerosol particles in the boreal forest: diurnal variation, solubility and the influence of sulfuric acid, Atmos. Chem. Phys., 7, 211–222, 2007a,
http://www.atmos-chem-phys.net/7/211/2007/.
Ehn, M., Pet¨aj¨a, T., Birmili, W., Junninen, H., Aalto, P., and Kul-mala, M.: Non-volatile residuals of newly formed atmospheric
particles in the boreal forest, Atmos. Chem. Phys., 7, 677–684, 2007b, http://www.atmos-chem-phys.net/7/677/2007/.
Fiedler, V., Dal Maso, M., Boy, M., Aufmhoff, H., Schuck, T., Birmili, W., Hanke, M., Uecker, J., Arnold, F., and Kulmala, M.: The contribution of sulfuric acid to atmospheric particle for-mation and growth: a comparison between boundary layers in Northern and Central Europe, Atmos. Chem. Phys., 5, 1773– 1785, 2005, http://www.atmos-chem-phys.net/5/1773/2005/. Fuchs, N. A. and Sutugin, A. G.: Highly Dispersed Aerosols,
Lon-don, Ann Arbor Science Publishers, 1–60, 1970.
Hanson, D. R. and Eisele, F. L.: Measurement of prenucleation
molecular clusters in the NH3, H2SO4, H2O system, J. Geophys.
Res., 107, 4158–4166, 2002.
Hari, P. and Kulmala, M.: Station for Measuring Ecosystem– Atmosphere Relations (SMEAR II), Boreal Environ. Res., 10, 315–322, 2005.
Hering, S. V., Stoltzenburg, M. R., Quant, F. R., Oberreit, D. R., and Keady, P. B.: A laminar-flow, water-based condensation particle counter (WCPC), Aerosol Sci. Technol., 39, 659–672, 2005. Hirsikko, A., Laakso, L., H˜orrak, U., Aalto, P. P., Kerminen,
V.-M., and Kulmala, M.: Annual and size dependent variation of growth rates and ion concentrations in boreal forest, Boreal Env-iron. Res., 10, 357–369, 2005.
Hoppel, W. A., Frick, G. M., Fitzgerald, J. W., and Larson, R. E.: Marine boundary layer measurements of new particle formation and the effects nonprecipitating clouds have on aerosol size dis-tribution, J. Geophys. Res., 99, 14443–14460, 1994.
Hussein, T., Junninen, H., Tunved, P., Kristensson, A., Dal Maso, M., Riipinen, I., Aalto, P. P., Hansson, H.-C., Swietlicki, E., and Kulmala, M.: Time-span and spatial-scale of regional new parti-cle formation events over Finland and Southern Sweden, Atmos. Chem. Phys. Discuss., 9, 135–173, 2009,
http://www.atmos-chem-phys-discuss.net/9/135/2009/.
H¨ameri, K., V¨akev¨a, M., Hansson, H.-C., and Laaksonen, A.: Hy-groscopic growth of ultrafine ammonium sulfate aerosol mea-sured using a ultrafine tandem differential mobility analyzer, J. Geophys. Res., 105, 22231–22242, 2001.
IPCC (Intergovernmental Panel on Climate Change). Climate Change 2007: The Physical Science Basis. Summary for Poli-cymakers; IPCC Secretariat: Geneva, Switzerland, http://www. ipcc.ch/ipccreports/assessments-reports.htm last accessed: 14 April 2009, 2007.
Jang, M., Czoschke, N. M., Lee, S., Kamens, R. M.: Identifica-tion of Polymers as Major Components of Atmospheric Organic Aerosols, Science, 298, 814–817, 2002.
Jokinen, V. and M¨akel¨a, J. M.: Closed loop arrangement with criti-cal orifices for DMA sheath/excess flow system, J. Aerosol Sci., 28, 643–648, 1997.
Kalberer, M., Paulse, D., Sax, M., Steinbecher. M., Dommen, J., Prevot, A. S. H., Fisseha, R., Weingertner, E., Frankevich, V., Zenobi, R., and Baltensperger, U.: Identification of polymers as major components of atmospheric aerosols, Science, 303, 1659– 1662, 2004.
Kulmala, M.: How particles nucleate and grow, Science, 302, 1000– 1001, 2003.
Kulmala, M., Laakso, L., Lehtinen, K. E. J., Riipinen, I., Dal Maso, M., Anttila, T., Kerminen, V.-M., H˜orrak, U., Vana, M., and Tam-met, H.: Initial steps of aerosol growth, Atmos. Chem. Phys., 4, 2553–2560, 2004b,
http://www.atmos-chem-phys.net/4/2553/2004/.
Kulmala, M., Suni, T., Lehtinen, K. E. J., Dal Maso, M., Boy, M.,
Reissell, A., Rannik, ¨U., Aalto, P., Keronen, P., Hakola, H., B¨ack,
J., Hoffman, T., Vesala, T., and Hari, P.: A new feedback mecha-nism linking forests, aerosols, and climate, Atmos. Chem. Phys., 4, 557–562, 2004c,
http://www.atmos-chem-phys.net/4/557/2004/.
Kulmala, M., Lehtinen, K. E. J., and Laaksonen, A.: Cluster activa-tion theory as an explanaactiva-tion of the linear dependence between formation rate of 3 nm particles and sulfuric acid concentration, Atmos. Chem. Phys., 6, 787–793, 2006,
http://www.atmos-chem-phys.net/6/787/2006/.
Kulmala, M., Riipinen, I., Sipil¨a, M., Manninen, H. E., Pet¨aj¨a, T., Junninen, H., Dal Maso, M., Mordas, G., Mirme, A., Vana, M., Hirsikko, A., Laakso, L., Harrison, R. M., Hanson, I., Leung, C., Lehtinen, K. E. J., and Kerminen, V.-M.: Toward direct measure-ment of atmospheric nucleation, Science, 318, 89–92, 2007a. Kulmala, M., Mordas, G., Pet¨aj¨a, T., Gr¨onholm, T., Aalto, P. P.,
Vehkam¨aki, H., Hienola, A., Herrmann, E., Sipil¨a, M., Riipinen, I., Manninen, H. E., H¨ameri, K., Stratmann, F., Bilde, M., Win-kler, P. M., Birmili, W., and Wagner, P. E.: The condensation particle counter battery (CPCB): A new tool to investigate the activation properties of nanoparticles, J. Aerosol Sci., 38, 289– 304, 2007b.
Laakso, L., Gr¨onholm, T., Kulmala, L., Haapanala, S., Hirsikko, A., Lovejoy, E. N., Kazil, J., Kurt´en, T., Boy, M., Nilsson, E. D., So-gachev, A., Riipinen, I., Stratmann, F., and Kulmala, M.: Hot-air balloon as a platform for boundary-layer profile measurements during particle formation, Boreal Environ. Res., 12, 279–294, 2007.
Lee, S.-H., Reeves, J. M., Wilson, J. C., Hunton, D. E., Viggiano, A. A., Miller, T. M., Ballentin, T. H., and Lait, L. M.: Particle formation by ion nucleation in the upper troposphere and lower stratosphere, Science, 301, 1886–1889, 2003.
Lehtinen, K. E. J. and Kulmala, M.: A model for particle formation and growth in the atmosphere with molecular resolution in size, Atmos. Chem. Phys., 3, 251–258, 2003,
http://www.atmos-chem-phys.net/3/251/2003/.
Lohmann, U. and Feichter, J.: Global indirect aerosol effects: A review, Atmos. Chem. Phys., 5, 715–737, 2005,
http://www.atmos-chem-phys.net/5/715/2005/.
McMurry, P. H.: The history of CPCs, Aerosol Sci. Tech., 33, 297– 322, 2000.
Mirme, A., Tamm, E., Mordas, G., Vana, M., Uin, J., Mirme, S., Bernotas, T., Laakso, L., Hirsikko, A., and Kulmala, M.: A wide-range multi-channel Air Ion Spectrometer, Boreal Environ. Res., 12, 247–264, 2007.
Mordas, G., Kulmala, M., Pet¨aj¨a, T., Aalto, P. P., Matulevicius, V., Grigoraitis, V., Ulevicius, V., Grayslus, V., Ukkonen, A., and H¨ameri, K.: Design and performance characteristics of a con-densation particle counter UF02proto, Boreal Environ. Res., 10, 543–552, 2005.
M¨akel¨a, J. M., Yli-Koivisto, S., Hiltunen, V., Seidl, W., Swietlicki, E., Teinil¨a, K., Sillanp¨a¨a, M., Koponen, I. K., Paatero, P., Ros-man, K., and H¨ameri, K.: Chemical composition of aerosol
dur-ing particle formation events in boreal forest, Tellus B, 53, 380– 393, 2001.
O’Dowd, C. D., Aalto, P., H¨ameri, K., Kulmala, M., and Hoff-mann, T.: Atmospheric particles from organic vapors, Nature, 416, 497–498, 2002.
O’Dowd, C. D., Yoon, Y. J., Junkermann, W., Aalto, P., Kulmala, M., Lihavainen, H., and Viisanen, Y.: Airborne measurements of nucleation mode particles II: boreal forest nucleation events, Atmos. Chem. Phys., 9, 937–944, 2009,
http://www.atmos-chem-phys.net/9/937/2009/.
Pet¨aj¨a, T., Mordas, G., Manninen, H., Aalto, P. P., H¨ameri, K., and Kulmala, M.: Detection efficiency of a water-based TSI Conden-sation Particle Counter 3785, Aerosol Sci. Tech., 40, 1090–1097, 2006.
Ramanathan, V., Crutzen, P. J., Kiehl, J. T., and Rosenfeld, D.: Aerosol, climate and the hydrological cycle, Science, 294, 2119– 2124, 2001.
Riipinen, I., Sihto, S.-L., Kulmala, M., Arnold, F., Dal Maso, M., Birmili, W., Saarnio, K., Teinil¨a, K., Kerminen, V.-M., Laak-sonen, A., and Lehtinen, K. E. J.: Connections between atmo-spheric sulfuric acid and new particle formation during QUEST III – IV campaigns in Hyyti¨al¨a and Heidelberg, Atmos. Chem. Phys., 7, 1899–1914, 2007,
http://www.atmos-chem-phys.net/7/1899/2007/.
Saros, M., Weber, R. J., Marti, J., and McMurry, P. H.: Ultra fine aerosol measurement using a condensation nucleus counter with pulse height analysis, Aerosol Sci. Tech., 25, 200–213, 1996. Sakurai, H., Fink, M. A., McMurry, P. H., Mauldin, L., Moore, K.
F., Smith, J. N., and Eisele, F. L.: Hygroscopicity and volatil-ity of 4–10 nm particles during summertime atmospheric nucle-ation events in urban Atlanta, J. Geophys. Res., 110, D22S04, doi:10.1029/2005JD005918, 2005.
Scheibel, H. G. and Porstend¨orfer, J.: Generation of monodisperse Ag- and NaCl-aerosols with particle diameters between 2 and 300 nm, J. Aerosol Sci., 14, 113–126, 1983.
Sem, G. J.: Design and performance characteristics of three
continuous-flow condensation particle counters: a summary, At-mos. Res., 62, 267–294, 2002.
Sgro, L. A. and Fern´andez de la Mora, J.: A Simple Turbulent Mixing CNC for Charged Particle Detection Down to 1.2 nm, Aerosol Sci. Tech., 38, 1–11, 2004.
Sihto, S.-L., Kulmala, M., Kerminen, V.-M., Dal Maso, M., Riip-inen, I., Korhonen, H., Arnold, F., Jansson, R., Boy, M., Laak-sonen, A., and Lehtinen, K. E. J.: Atmospheric sulfuric acid and aerosol formation: implications from atmospheric measurements for nucleation and early growth mechanisms, Atmos. Chem. Phys., 6, 1–13, 2006,
http://www.atmos-chem-phys.net/6/1/2006/.
Sipil¨a, M., Lehtipalo, K., Kulmala, M., Pet¨aj¨a, T., Junninen, H., Aalto, P. P., Manninen, H. E., Vartiainen, E., Riipinen, I., Kyr¨o, E.-M., Curtius, J., K¨urten, A., Borrman, S., and O’Dowd, C. D.: Applicability of condensation particle counters to measure atmospheric clusters, Atmos. Chem. Phys., 8, 4049–4060, 2008, http://www.atmos-chem-phys.net/8/4049/2008/.
Stoltzenburg, M. R. and McMurry, P. H.: An ultrafine aerosol condensation nucleus counter, Aerosol Sci. Tech., 14, 48–65, 1991.
Swietlicki, E., Hansson, H.-C., H¨ameri, K., Svenningsson, B., Massling, A., McFiggans, G., McMurry, P. H., Pet¨aj¨a, T., Tunved, P., Gysel, M., Topping, D., Weingartner, E., Bal-tensperger, U., Rissler, J., Wiedensohler, A., and Kulmala, M.: Hygroscopic properties of submicrometer atmospheric aerosol particles measured with H-TDMA instruments in various envi-ronments – a review, Tellus B., 60, 432–469, 2008.
Tunved, P., Hansson, H.-C., Kerminen, V.-M., Str¨om, J., Dal Maso, M., Lihavainen, H., Viisanen, Y., Aalto, P. P., Komppula, M., and Kulmala, M.: High natural aerosol loading over boreal forests, Science, 312, 261–263, 2006.
Varutbangkul, V., Brechtel, F. J., Bahreini, R., Ng, N. L., Keywood, M. D., Kroll, J. H., Flagan, R. C., Seinfeld, J. H., Lee, A., and Goldstein, A. H.: Hygroscopicity of secondary organic aerosols formed by oxidation of cycloalkenes, monoterpenes, sesquiter-penes, and related compounds, Atmos. Chem. Phys., 6, 2367– 2388, 2006, http://www.atmos-chem-phys.net/6/2367/2006/.
Weber, R. J., Marti, J. J., McMurry, P. H., Eisele, F. L., Tanner, D. J., and Jefferson, A.: Measurements of new particle formation and ultrafine particle growth rates at a clean continental site, J. Geophys. Res., 102, 4375–4385, 1997.
Wehner, B., Pet¨aj¨a, T., Boy, M., Engler, C., Birmili, W., Tuch, T., Wiedensohler, A., and Kulmala, M.: The contribution of sulfu-ric acid and non-volatile compounds on the growth of freshly formed atmospheric aerosols, Geophys. Res. Lett., 32, L17810, doi:10.1029/2005GL023827, 2005.
Yu, F. and Turco, R. P.: From molecular clusters to nanoparticles: Role of ambient ionization in tropospheric aerosol formation, J. Geophys. Res., 106, 4797–4814, 2001.