www.atmos-chem-phys.net/17/551/2017/ doi:10.5194/acp-17-551-2017
© Author(s) 2017. CC Attribution 3.0 License.
Detecting volcanic sulfur dioxide plumes in the Northern
Hemisphere using the Brewer spectrophotometers,
other networks, and satellite observations
Christos S. Zerefos1,2,3,4, Kostas Eleftheratos2,5, John Kapsomenakis1, Stavros Solomos6, Antje Inness7,
Dimitris Balis8, Alberto Redondas9, Henk Eskes10, Marc Allaart10, Vassilis Amiridis6, Arne Dahlback11, Veerle De Bock12, Henri Diémoz13, Ronny Engelmann14, Paul Eriksen15, Vitali Fioletov16, Julian Gröbner17, Anu Heikkilä18, Irina Petropavlovskikh19, Janusz Jarosławski20, Weine Josefsson21, Tomi Karppinen22, Ulf Köhler23,
Charoula Meleti8, Christos Repapis4, John Rimmer24, Vladimir Savinykh25, Vadim Shirotov26, Anna Maria Siani27, Andrew R. D. Smedley24, Martin Stanek28, and René Stübi29
1Research Centre for Atmospheric Physics and Climatology, Academy of Athens, Athens, Greece 2Biomedical Research Foundation, Academy of Athens, Athens, Greece
3Navarino Environmental Observatory (N.E.O.), Messinia, Greece
4Mariolopoulos-Kanaginis Foundation for the Environmental Sciences, Athens, Greece
5Faculty of Geology and Geoenvironment, National and Kapodistrian University of Athens, Athens, Greece 6Institute for Astronomy, Astrophysics, Space Applications and Remote Sensing (IAASARS),
National Observatory of Athens, Athens, Greece
7European Centre for Medium-Range Weather Forecasts (ECMWF), Reading, UK 8Department of Physics, Aristotle University of Thessaloniki, Thessaloniki, Greece 9Izaña Atmospheric Research Center, AEMET, Tenerife, Canary Islands, Spain 10Royal Netherlands Meteorological Institute (KNMI), De Bilt, the Netherlands 11Department of Physics, University of Oslo, Oslo, Norway
12Royal Meteorological Institute of Belgium, Brussels, Belgium 13ARPA Valle d’Aosta, Saint-Christophe, Italy
14Leibniz Institute for Tropospheric Research, Leipzig, Germany 15Danish Meteorological Institute, Copenhagen, Denmark 16Environment and Climate Change Canada, Toronto, Canada 17PMOD/WRC, Davos Dorf, Switzerland
18Climate Change Unit, Finnish Meteorological Institute, Helsinki, Finland
19Cooperative Institute for Research in Environmental Sciences, University of Colorado, Boulder, CO, USA 20Institute of Geophysics, Polish Academy of Sciences, Warsaw, Poland
21Swedish Meteorological and Hydrological Institute, Norrköping, Sweden 22Arctic Research Centre, Finnish Meteorological Institute, Sodankylä, Finland 23DWD, Meteorological Observatory Hohenpeißenberg, Hohenpeißenberg, Germany
24Centre for Atmospheric Science, School of Earth, Atmospheric and Environmental Sciences,
University of Manchester, Manchester M13 9PL, UK
25A.M. Obukhov Institute of Atmospheric Physics, Kislovodsk, Russia 26Institute of Experimental Meteorology, Obninsk, Russia
27Department of Physics, Sapienza, University of Rome, Rome, Italy
28Solar and Ozone Observatory, Czech Hydrometeorological Institute, Hradec Králové, Czech Republic 29Federal Office of Meteorology and Climatology, MeteoSwiss, Payerne, Switzerland
Received: 11 June 2016 – Published in Atmos. Chem. Phys. Discuss.: 4 July 2016 Revised: 1 December 2016 – Accepted: 12 December 2016 – Published: 11 January 2017
Abstract. This study examines the adequacy of the exist-ing Brewer network to supplement other networks from the ground and space to detect SO2plumes of volcanic origin. It
was found that large volcanic eruptions of the last decade in the Northern Hemisphere have a positive columnar SO2
sig-nal seen by the Brewer instruments located under the plume. It is shown that a few days after the eruption the Brewer in-strument is capable of detecting significant columnar SO2
increases, exceeding on average 2 DU relative to an unper-turbed pre-volcanic 10-day baseline, with a mean close to 0 andσ=0.46, as calculated from the 32 Brewer stations un-der study. Intercomparisons with independent measurements from the ground and space as well as theoretical calcula-tions corroborate the capability of the Brewer network to detect volcanic plumes. For instance, the comparison with OMI (Ozone Monitoring Instrument) and GOME-2 (Global Ozone Monitoring Experiment-2) SO2space-borne retrievals
shows statistically significant agreement between the Brewer network data and the collocated satellite overpasses in the case of the Kasatochi eruption. Unfortunately, due to spar-sity of satellite data, the significant positive departures seen in the Brewer and other ground networks following the Ey-jafjallajökull, Bárðarbunga and Nabro eruptions could not be statistically confirmed by the data from satellite over-passes. A model exercise from the MACC (Monitoring At-mospheric Composition and Climate) project shows that the large increases in SO2 over Europe following the
Bárðar-bunga eruption in Iceland were not caused by local pollu-tion sources or ship emissions but were clearly linked to the volcanic eruption. Sulfur dioxide positive departures in Eu-rope following Bárðarbunga could be traced by other net-works from the free troposphere down to the surface (Air-Base (European air quality database) and EARLINET (Eu-ropean Aerosol Research Lidar Network)). We propose that by combining Brewer data with that from other networks and satellites, a useful tool aided by trajectory analyses and mod-elling could be created which can also be used to forecast high SO2values both at ground level and in air flight
corri-dors following future eruptions.
1 Introduction
Volcanic eruptions are an important source of natural emis-sions of sulfur dioxide (SO2) into the troposphere and the stratosphere. Ash particles and gases injected into the atmo-sphere by large volcanic eruptions can affect solar radiation and climate (e.g. Robock, 2000) and air quality (e.g. Schmidt et al., 2015) and may also impact local environments (e.g.
Durant et al., 2010). Volcanic emissions (e.g. ash and SO2) can reach different heights in the atmosphere and can be transported in different directions (e.g. Prata et al., 2010). Thomas and Prata (2011) have shown that the eruption can be divided into an initial ash-rich phase, a lower-intensity middle phase and a final phase where considerably greater quantities of both ash and SO2 are released, which in the
case of ash can result in air travel disruptions (e.g. Flentje et al., 2010). These effects make the ash and SO2 in
vol-canic plumes important parameters to be studied, monitored and forecasted on small and larger spatial scales. Our study focuses on volcanic columnar SO2amounts because of the
existence of the fairly continuous set of direct sun measure-ments with the Brewer network.
Measurements of SO2 are important for tracking and
as-sessing impacts of emissions from pollution sources and in quantifying natural SO2 emissions by volcanoes. Pollution
sources typically result in a few Dobson unit (DU, 1 DU= 2.69×1026molec km−2)increases in column SO2amounts
unless observations are made near a source. The Brewer net-work is useful for plume tracking because it can track SO2
columnar amounts from a large number of stations and wide geographical extent. The primary application of the ground-based Brewer spectrophotometer is to measure total ozone column by using UV spectrophotometry. Direct sunlight in-tensities are measured at five wavelengths (between 306 and 320 nm; see also Sect. 2.1) to simultaneously calculate ozone and SO2 column integrals (Kerr et al., 1980). These
instru-ments have been used extensively to monitor stratospheric ozone (e.g. WMO Scientific Assessment of Ozone Depletion reports, 2011, 2014) and have a long history of studying at-mospheric SO2columns (e.g. De Backer and De Muer, 1991;
Bais et al., 1993; Fioletov et al., 1998; Zerefos et al., 2000, 2009; Ialongo et al., 2015). Ground-based measurements of atmospheric SO2using the Brewer instrument have played an
important role in the development and validation of satellite-based SO2 measurements (Schaefer et al., 1997; Spinei et
al., 2010; Rix et al., 2012; Ialongo et al., 2015) used primar-ily for detecting and tracking volcanic emissions. Since the Brewer instruments are located at stationary ground-based monitoring sites, a volcanic plume of SO2must pass over the
site if useful data are to be obtained. Validation of satellite measurements by the Brewer instrument also requires that a satellite overpass is available when the plume is over the ground-based site (Kerr, 2010).
There have been various initiatives during recent years that used satellite measurements of SO2 to monitor
Table 1.Volcanic eruptions in the past decade considered in this study.
Volcano Latitude Longitude Elevation (a.s.l.) Period of eruption VEI∗
Okmok, Alaska 53.43◦N 168.13◦W 1073 m 12 July–19 August 2008 4
Kasatochi, Alaska 52.17◦N 175.51◦W 300 m 7–8 August 2008 4
Sarychev, Russia 48.1◦N 153.2◦E 1496 m 12–17 June 2009 4
Eyjafjallajökull, Iceland 63.63◦N 19.62◦W 1666 m 14 April–23 May 2010 4
Grímsvötn, Iceland 64.42◦N 17.33◦W 1725 m 21–25 May 2011 4
Nabro, Africa 13.37◦N 41.70◦E 2218 m 12–13 June 2011 4
Tolbachik, Russia 55.83◦N 160.33◦E 3611 m 27 November 2012–22 August 2013 4
Bárðarbunga, Iceland 64.64◦N 17.56◦W 2005 m 31 August 2014–28 February 2015 0
∗Taken from the Smithsonian Institution Global Volcanism Program.
tools provide valuable information to the established Vol-canic Ash Advisory Centers (VAAC). Satellite SO2data have
been available in the past from various satellite instruments (e.g. GOME, SCIAMACHY). Currently operational data are available from UV measurements (e.g. GOME-2 (Global Ozone Monitoring Experiment-2), OMI (Ozone Monitor-ing Instrument) and OMPS (Ozone MappMonitor-ing Profiler Suite)) and from infrared measurements (e.g. IASI (Infrared Atmo-spheric Sounding Interferometer) and AIRS (AtmoAtmo-spheric Infrared Sounder)).
In the present work we investigate the efficiency of the ex-isting Brewer network in the Northern Hemisphere to detect volcanic SO2plumes during the past decade. The main focus
is to show the sensitivity of the Brewer network in detecting SO2plumes of volcanic origin in synergy with other
ground-based observations, satellite data and dynamic transport cal-culations. The Brewer spectroradiometric measurements are compared to collocated satellite measurements from OMI and GOME-2 as described in the next paragraph. This paper did not include analyses of the SO2measurements from IASI
and AIRS since both instruments are IR spectroradiometers. We compared Brewer measurements to the OMI and GOME-2 data that are derived using information from differential optical absorption in the UV spectrum, which also forms the basis of the Brewer measurement methodology. In the case of Brewer–IASI or Brewer–AIRS comparison we would also have to consider differences in the spectroscopy and the corresponding retrieval algorithm concepts, which would re-quire further analysis which is beyond the scope of this paper. Table 1 lists in chronological order all major volcanic eruptions in the Northern Hemisphere between 2005 and 2015 with a volcanic explosivity scale index (VEI) of at least 4 (Newhall and Self, 1982; Robock, 2000; Zerefos et al., 2014). The study also provides a separate analysis for the Bárðarbunga eruption, which although not rated 4 has been already studied with the Brewer instrument at Sodankylä by Ialongo et al. (2015).
As seen from Table 1, chronologically, the first case was the volcanic eruption at Mount Okmok, Alaska (53.43◦N,
168.13◦W; 1073 m above sea level (a.s.l.); 12 July 2008;
Prata et al., 2010) followed by the Kasatochi eruption, Alaska (52.17◦N, 175.51◦W; 300 m a.s.l.; 7–8 August 2008; e.g.
Kristiansen et al., 2010; Krotkov et al., 2010; Waythomas et al., 2010), which was detected over large areas of the North-ern Hemisphere. Okmok and Kasatochi volcanoes in Alaska erupted for a short time span of less than a month, and there-fore we decided to study the evolution of the Brewer SO2
columnar measurements following the latter volcanic erup-tion (Kasatochi). The third eruperup-tion took place at Sarychev in Russia (48.1◦N, 153.2◦E; 1496 m a.s.l.; 12–17 June 2009;
Haywood et al., 2010). The evolution of the SO2 volcanic
plume from Sarychev was mostly observed over the North Pacific, North America and North Atlantic (Haywood et al., 2010). There was only one North American Brewer station (Saturna Island) in the path of the plume from Sarychev eruption. The record shows SO2 columns of 8.6 DU
de-tected on 19 June 2009 and 3.7 DU on 20 June 2009. This volcanic eruption is not investigated any further in this pa-per. The next eruption on the list, Eyjafjallajökull in Ice-land (63.63◦N, 19.62◦W; 1666 m a.s.l.; from 14 April to
23 May 2010), resulted in interruption of the air traffic over NW Europe (e.g. Flemming and Inness, 2013). The fifth eruption Grímsvötn 2011 (64.42◦N, 17.33◦W; 1725 m a.s.l.;
21 May 2011) was studied by Flemming and Inness (2013), and by Moxnes et al. (2014). This eruption provided an in-teresting example of a clear separation of the volcanic SO2
plume (transported mostly northwestward), while the fine ash was transported mostly southeastward. Unfortunately the volcanic plume did not overpass any Brewer station, and therefore we do not include any results post Grímsvötn erup-tion. The sixth eruption recorded features the Nabro in Africa (13.37◦N, 41.70◦E; 2218 m a.s.l.), which occurred on 12–
13 June 2011 (e.g. Bourassa et al., 2012; Sawamura et al., 2012; Clarisse et al., 2014). We present here a case study that described the detection of the Nabro volcanic SO2plume
(55.83◦N, 160.33◦E; 3.611 m a.s.l.), on 27 November 2012
(e.g. Telling et al., 2015). As in the case of Grímsvötn, the plume has not passed over any Brewer station that was ver-ified by trajectory analysis. The next eruption on the list is the volcanic eruption from Bárðarbunga, Iceland (64.64◦N,
17.56◦W; 2005 m a.s.l.) that was observed between 31
Au-gust 2014 and 28 February 2015 (e.g. Schmidt et al., 2015). This last eruption, although not yet rated on the VEI scale, has been extensively studied in view of the observed in-creased SO2concentrations that have been observed all the
way through the troposphere and reaching down to the sur-face in Europe (Ialongo et al., 2015; Schmidt et al., 2015).
The capability of the Brewer network to measure columnar SO2amounts above the local air pollution levels is also
pre-sented and discussed. The qualitative evidence that the plume can be detected in many single cases by the Brewer network has been quantitatively tested by calculating correlation coef-ficients with collocated satellite data. Only in the case of the Kasatochi 2008 eruption was it possible to test the sensitiv-ity of SO2abundance measured by the Brewer
spectropho-tometers and from space. Correlations between the Brewer and collocated satellite SO2 data from the Aura OMI and
GOME-2 are presented in Sect. 3 where the correlation co-efficients were found to be statistically significant at a con-fidence level of 99 %. For the other eruptions, unfortunately due to the sparsity of satellite data, no firm conclusions can be drawn, as discussed in Sect. 3.
The paper is structured in the following order. Sect. 2 describes the data sources and the methods of analysis of the columnar SO2measurements by the Brewer
spectropho-tometers (hereinafter simply referred to as the “Brewers”). Section 3 presents the analysis of the Brewer measurements during four of the volcanic eruptions listed in Table 1, along with satellite data and dynamic volcanic plume transport sim-ulations. The conclusions are provided in Sect. 4.
2 Data and methods 2.1 Ground-based data
Sulfur dioxide in the atmosphere can be measured from ground-based instruments and by instrumentation onboard the spacecraft and can be estimated with the help of models. The Brewer is an automated, diffraction-grating spectropho-tometer that provides observations of the sun’s intensity in the near-UV range. The spectrophotometer measures the in-tensity of radiation in the ultraviolet absorption spectrum of ozone at five wavelengths (306.3, 310.1, 313.5, 316.8 and 320.1 nm) with a resolution of 0.6 nm. These data are used to derive the total ozone column (Kerr et al., 1980). Because sulfur dioxide has strong and variable absorption in this spec-tral region, the Brewer spectrophotometer has additionally been proposed to derive SO2 columns (Kerr et al., 1980).
About 200 Brewer spectrophotometers around the world
con-tribute high-precision ozone data to the global ozone moni-toring network (Kumharn et al., 2012). The existing Brewer network also delivers frequent SO2columnar measurements
as well, which can be used for analyses, but with caution. This is because the signal-to-noise ratio for the SO2
absorp-tion is usually quite low and therefore well-calibrated in-struments are required to monitor nominal SO2 columnar
amounts (Koukouli et al., 2014). Details on the method with which SO2is measured by the Brewer spectrophotometer can
be found in Kerr et al. (1980, 1985, 1988) and De Backer and De Muer (1991). According to Fioletov et al. (2016), the un-certainty of the Brewer direct sun (DS) SO2 measurements
is about 1 DU and is typically insufficient for air quality ap-plications. A more accurate method (with an uncertainty as low as 0.13 DU) based on Brewer “group-scan” spectral di-rect sun radiation measurements at 45 wavelengths from 306 to 324 nm was developed (Kerr, 2002) but not implemented for routine operations due to its complexity (Fioletov et al., 2016). Although the Brewer instrument has difficulties in de-tecting low columnar SO2concentrations, in extreme cases,
such as volcanic eruptions, the SO2levels typically rise well
above the instrumental noise and can be identified with the Brewer instrument as shown in this paper and in Fioletov et al. (1998).
Before proceeding to the analysis of Brewer measure-ments, the methodology to derive columnar SO2is first
pre-sented. To determine ozone and SO2 column amounts, the
measured raw photon counts at the five operational chan-nels in the Brewer instrument are converted to radiation in-tensity. The Beer–Lambert absorption law is applied at each wavelengthλ, and the measured intensity of direct sunlight is given by the following formula:
logIλ=logI0λ−βλµR−δλµp−αλO3µ−σλSO2µ, (1)
whereIλ is the measured radiation intensity at wavelength λ,I0λis the measured extraterrestrial spectrally resolved
in-tensity atλ,βλis the Rayleigh scattering coefficient atλ,δλ
is the particulate scattering coefficient atλ,αλ is the ozone
absorption coefficient (square centimetres per molecule) at λ, O3is the total ozone column (molecules per square
cen-timetre),σλis the SO2absorption coefficient atλ, SO2is the
column amount of sulfur dioxide,µR,µpandµare the op-tical path lengths (air masses) corresponding to the effective heights of molecules, particles and ozone respectively.
According to the Brewer retrieval algorithm, the following ratios are formed:
F =F0−1βµR−1αO3µ (2)
and
F =logI2−0.5logI3−2.2logI4+1.7logI5, andF0,1β, and1αare the same linear combinations for logI0λ,βλ, and αλ. The F′ is the SO2 ratio and F′=logI1−4.2logI4+
3.2logI5andF0′,1β′,1α′and1σ′the corresponding linear combinations for logI0λ,βλ,αλandσλ. Both of these
func-tions have weights which eliminate the effects of particulate scattering, while the functionF is weighted to remove SO2
absorption effects as well. The extraterrestrial constants F0
andF0′are determined from a long series of intercomparison measurements as well as zero air mass (µ) extrapolations.
The total ozone column is determined by the formula O3=F0−F−1βµR
1αµ (4)
and the SO2by the formula
SO2=A1 F′
0−F′−1β′µR 1α′µ −O3
, (5)
whereAis the ratio of the SO2absorption coefficient to the
O3absorption coefficient;A=2.44.
From the above-described operational Brewer algorithm it is evident that the estimation of columnar SO2 is the result
of the difference between two columnar terms (O3+SO2) and O3. Both terms have uncertainties (weighting functions,
calibrations, random errors, systematic errors). Systematic negative values could be the result of a systematic offset in the measurements that can be related to the calibration of the instrument (usually optimized only for the ozone mea-surements). Randomly varying positive and negative values around zero, suggest that the signal of SO2is small (and thus
the difference of two terms should be close to 0), but since both terms have uncertainties, negative values are possible, indicating that the amount of SO2in the atmosphere is below
the detection limit of the instrument and could be considered as noise. In this work we have repeated our analysis exclud-ing the negative values, and the results remained the same; i.e. a positive increase after a major volcanic eruption was confirmed as described in the following sections. Finally, we need to point out that perturbations by ash present in the vol-canic plumes have been shown not to affect the Brewer SO2
measurements. This is based on the result of the Pappalardo et al. (2013) paper based on EARLINET (European Aerosol Research Lidar Network) observations following the Eyjaf-jallajökull eruption, in which they found that the Ångström exponent of the volcanic ash optical depth is close to 0. This indicates that the effect of ash in the UV and visible region on the aerosol extinction is almost independent of wavelength. The Brewer SO2measurements taken in a narrow wavelength
band in the UV are therefore not expected to be influenced by the presence of volcanic ash considering the weights already applied in the operational Brewer algorithm.
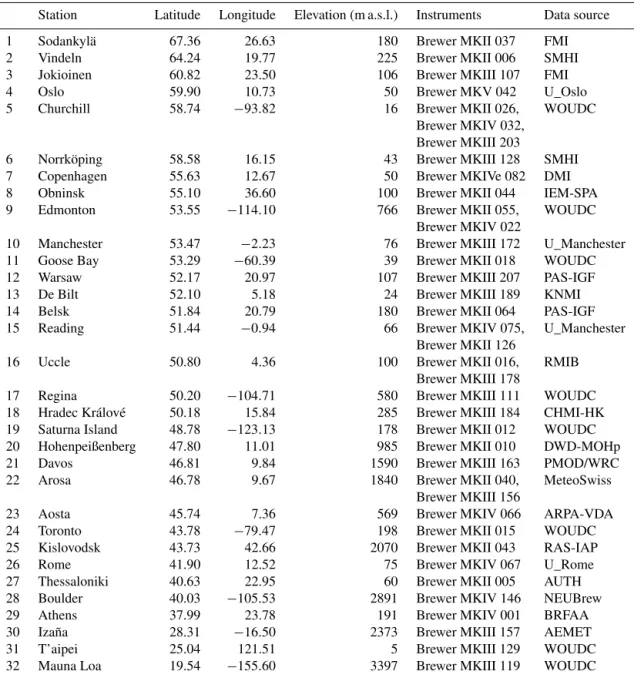
In this study we analysed 23 stations located in Europe, 6 Brewer stations in Canada, 2 in the USA and 1 in Taiwan; their geographical positions are shown in Fig. 1. SO2
mea-surements were averaged over a large number of instruments
Figure 1.All stations with accessible SO2column data from Brew-ers analysed in this study as listed in Table 2.
and datasets during periods following volcanic eruptions. Random errors in the measurements of individual Brewer stations are reduced significantly by the averaging processes to calculate regional means.
Daily SO2 columns at Churchill, Goose, Edmonton,
Regina, Saturna Island and Toronto in Canada, T’aipei in Taiwan, and Boulder and Mauna Loa in the US were ob-tained from the World Ozone and Ultraviolet Radiation Data Centre (WOUDC; http://www.woudc.org/) and the NOAA-EPA Brewer Spectrophotometer UV and Ozone Network (NEUBrew; http://www.esrl.noaa.gov/gmd/grad/neubrew/). The data have been checked for quality assurance/quality control by the individual data providers. It is important to note the participation of most of the European Brewer data providers in a recent EU COST Action (EUBREWNET, http://www.eubrewnet.org/cost1207/) programme. Its focus is to establish a coherent network of European Brewer Spec-trophotometer monitoring stations in order to harmonize op-erations and develop approaches, practices and protocols to achieve consistency in quality control, quality assurance and coordinated operations.
In our analysis only DS measurements satisfying the fol-lowing criteria have been used: a Brewer DS measurement was included if and only if for every measurement cycle of five sets of measurements (from which also total columnar ozone is derived) the standard deviation of O3and SO2was
less than 2.5 DU, the total columnar ozone was between 250 and 450 DU, and the solar zenith angle was less than 73.5◦.
To exclude erratic data of SO2 from our analysis, values
exceeding ±6σ of the mean of all SO2 individual Brewer
measurements were considered erroneous and were not in-cluded in the calculations. Therefore, the range of analysed values was limited to a maximum of ±35 DU for an indi-vidual measurement (i.e. 6σ, withσ being equal to 5.8 as estimated from all available sub-daily SO2values). Then we
calculated daily SO2columns at each station only if at least
Table 2.Stations with accessible SO2column data from Brewers analysed in this study. Stations are sorted from high to lower northern latitudes.
Station Latitude Longitude Elevation (m a.s.l.) Instruments Data source
1 Sodankylä 67.36 26.63 180 Brewer MKII 037 FMI
2 Vindeln 64.24 19.77 225 Brewer MKII 006 SMHI
3 Jokioinen 60.82 23.50 106 Brewer MKIII 107 FMI
4 Oslo 59.90 10.73 50 Brewer MKV 042 U_Oslo
5 Churchill 58.74 −93.82 16 Brewer MKII 026, WOUDC
Brewer MKIV 032, Brewer MKIII 203
6 Norrköping 58.58 16.15 43 Brewer MKIII 128 SMHI
7 Copenhagen 55.63 12.67 50 Brewer MKIVe 082 DMI
8 Obninsk 55.10 36.60 100 Brewer MKII 044 IEM-SPA
9 Edmonton 53.55 −114.10 766 Brewer MKII 055, WOUDC
Brewer MKIV 022
10 Manchester 53.47 −2.23 76 Brewer MKIII 172 U_Manchester
11 Goose Bay 53.29 −60.39 39 Brewer MKII 018 WOUDC
12 Warsaw 52.17 20.97 107 Brewer MKIII 207 PAS-IGF
13 De Bilt 52.10 5.18 24 Brewer MKIII 189 KNMI
14 Belsk 51.84 20.79 180 Brewer MKII 064 PAS-IGF
15 Reading 51.44 −0.94 66 Brewer MKIV 075, U_Manchester
Brewer MKII 126
16 Uccle 50.80 4.36 100 Brewer MKII 016, RMIB
Brewer MKIII 178
17 Regina 50.20 −104.71 580 Brewer MKIII 111 WOUDC
18 Hradec Králové 50.18 15.84 285 Brewer MKIII 184 CHMI-HK
19 Saturna Island 48.78 −123.13 178 Brewer MKII 012 WOUDC
20 Hohenpeißenberg 47.80 11.01 985 Brewer MKII 010 DWD-MOHp
21 Davos 46.81 9.84 1590 Brewer MKIII 163 PMOD/WRC
22 Arosa 46.78 9.67 1840 Brewer MKII 040, MeteoSwiss
Brewer MKIII 156
23 Aosta 45.74 7.36 569 Brewer MKIV 066 ARPA-VDA
24 Toronto 43.78 −79.47 198 Brewer MKII 015 WOUDC
25 Kislovodsk 43.73 42.66 2070 Brewer MKII 043 RAS-IAP
26 Rome 41.90 12.52 75 Brewer MKIV 067 U_Rome
27 Thessaloniki 40.63 22.95 60 Brewer MKII 005 AUTH
28 Boulder 40.03 −105.53 2891 Brewer MKIV 146 NEUBrew
29 Athens 37.99 23.78 191 Brewer MKIV 001 BRFAA
30 Izaña 28.31 −16.50 2373 Brewer MKIII 157 AEMET
31 T’aipei 25.04 121.51 5 Brewer MKIII 129 WOUDC
32 Mauna Loa 19.54 −155.60 3397 Brewer MKIII 119 WOUDC
Daily sulfur dioxide (SO2)columns were analysed in four bimonthly periods, namely August–September 2008, April– May 2010, June–July 2011 and September–October 2014; these include the volcanic eruptions of Kasatochi (2008), Ey-jafjallajökull (2010), Nabro (2011) and Bárðarbunga (2014) respectively. For the case of Kasatochi, Eyjafjallajökull and Bárðarbunga, we analysed daily SO2 columns at 30 sites
(listed in Table 2), while for the case of Nabro, whose im-pact was mostly seen over low latitudes in the Northern Hemisphere (e.g. Bourassa et al., 2012), we analysed SO2
columns at three low-latitude sites in the Northern Hemi-sphere, namely Izaña, Mauna Loa and T’aipei.
Only for the case of the Bárðarbunga eruption in 2014 were the columnar SO2 measurements over Europe also
compared with surface SO2 measurements from
ground-based European stations. The surface SO2 data were
Table 3.Rural AirBase stations analysed in this study (see text).
Station ID Station name Latitude Longitude Closest Brewer (within 150 km)
GB0583A Middlesbrough 54.569 −1.221 Manchester
NL00444 De Zilk-Vogelaarsdreef 52.298 4.51 De Bilt
PL0105A Parzniewice 51.291 19.517 Belsk
NL00133 Wijnandsrade-Opfergeltstraat 50.903 5.882 Uccle
GB0038R Lullington Heath 50.794 0.181 Reading
CH0005R Rigi 47.067 8.463 Arosa
CH0002R Payerne 46.813 6.944 Aosta
fulfilled the above-mentioned criteria and were included in the current analysis. Observed data from the AirBase network were available in hourly resolution, from which we calculated daily surface SO2 values. We note here that
SO2 in the troposphere over western Europe is very low
(e.g. Zerefos et al., 2009; Wild, 2012), and therefore plumes from volcanic eruptions are easy to detect against a lower background level.
2.2 Satellite data
The columnar SO2records from remote-sensing
spectropho-tometers over Europe, Canada, USA and Taiwan were com-pared with space-borne measurements from (a) the OMI aboard the EOS (Earth Observing System)-Aura (e.g. Ia-longo et al., 2015) satellite and (b) the GOME-2 aboard the A (e.g. Rix et al., 2009) satellite. We use MetOp-A instead of MetOp-B because it covers a longer time period. Both OMI and GOME-2 satellite SO2 data
prod-ucts were downloaded from the Aura Validation Data Cen-ter (AVDC) (available from http://avdc.gsfc.nasa.gov/index. php?site=_245276100). GOME-2 level-2 overpass data have been processed with the GOME Data Processor (GDP) ver-sion 4.7. We analysed station overpass data for the various midlatitude stations listed in Table 2 and for the low-latitude stations at Mauna Loa, Izaña and T’aipei. The available OMI version 1.2.0 overpass (collection 3) data analysed in this study include pixels within 50 km radius from the near-est Brewer site and is not affected by OMI row anomalies. The available GOME-2 level-2 overpass data include pixels within 100 km radius from the Brewer sites.
For the case of OMI, the SO2 data are provided from
October 2004 to the present. There are four SO2products:
(1) the planetary boundary layer SO2 column (PBL),
cor-responding to a centre of mass altitude (CMA) at 0.9 km; (2) the lower tropospheric SO2column (TRL) corresponding
to CMA of 2.5 km; (3) the middle-tropospheric SO2column
(TRM), usually produced by volcanic degassing, correspond-ing to CMA of 7.5 km; and (4) the upper-tropospheric and stratospheric SO2 column (STL), usually produced by
ex-plosive volcanic eruptions, corresponding to CMA of 17 km. Details on OMI SO2columns can be found in various
stud-ies (Levelt et al., 2006; Yang et al., 2007; Fioletov et al.,
2011, 2013; McLinden et al., 2012; Li et al., 2013; Ia-longo et al., 2015). In this study, we made use of the prod-uct for the middle-tropospheric SO2 column (TRM)
fol-lowing the recommendation that the TRM retrievals should be used for volcanic degassing at all altitudes because the PBL retrievals are restricted to optimal viewing conditions and TRL data are overestimated for high-altitude emissions (>3 km) (Ialongo et al., 2015). Also, we analysed the STL data which are intended for use with explosive volcanic erup-tions where the volcanic cloud is placed in the upper tro-posphere/stratosphere. The standard deviation of TRM re-trievals in background areas is reported to be about 0.3 DU in low and midlatitudes and about 0.2 DU for the STL re-trievals. This is similar to the standard deviations (indicative of typical uncertainties of the measurements) that we find for the TRM and STL retrievals in the four bimonthly periods under this study. For the best data quality, we used data from the scenes near the centre of the OMI swath (rows 4–54) as recommended by Ialongo et al. (2015), who found that data from the edges of the swath tend to have greater noise.
For GOME-2, we analysed the total SO2 columns from
April 2007 to the present. The standard deviation found in our study for the GOME-2 retrievals is on the order of 0.4 DU. We analysed satellite SO2measurements whenever
the O3column was between 250 and 450 DU and the solar
zenith angle was less than 73.5◦. We used SO2data defined
as having a cloud radiance fraction (across each pixel) of less than 50 %, as they were found to have a smaller standard de-viation than all sky data. Moreover, a range of SO2values
between−35 and 35 DU was used to screen for outliers. In cases of multiple daily data matched to the station overpass, all available measurements within a radius of 50 (100) km from the Brewer site in the case of OMI (GOME-2) are aver-aged.
Table 4.SO2column departures at midlatitude stations averaged in bimonthly periods following volcanic eruptions.
August–September 2008 April–May 2010 September–October 2014 (Kasatochi) (Eyjafjallajökull) (Bárðarbunga)
(a) latitude mean σ mean σ mean σ
Sodankylä 67.36 0.6 2.1 0.1 0.7 −0.5 1.8
Vindeln 64.24 0.4 1.4 0.0 0.4 −0.2 0.9
Jokioinen 60.82 0.5 0.6 ∗ ∗ 0.4 0.5
Oslo 59.90 ∗ ∗ 0.7 0.6 −0.1 1.0
Churchill 58.74 0.6 0.8 −0.3 1.1 0.4 1.0
Norrköping 58.58 0.4 0.8 −0.1 0.2 0.1 0.8
Copenhagen 55.63 0.3 0.8 0.5 0.9 −0.4 0.7
Obninsk 55.10 ∗ ∗ 0.1 0.5 0.3 0.9
Edmonton 53.55 0.4 0.6 0.4 0.4 0.0 0.4
Manchester 53.47 0.6 0.7 0.0 0.6 0.4 1.6
Goose Bay 53.29 0.2 0.4 ∗ ∗ 0.3 0.3
Warsaw 52.17 ∗ ∗ ∗ ∗ 0.1 0.4
De Bilt 52.10 0.1 0.9 −0.3 0.9 0.2 0.8
Belsk 51.84 0.3 0.6 −0.4 0.4 0.4 0.5
Reading 51.44 0.2 0.7 1.2 1.2 0.3 1.7
Uccle 50.80 0.1 0.6 −0.5 0.6 0.7 1.3
Regina 50.20 0.0 0.9 ∗ ∗ ∗ ∗
Hradec Králové 50.18 0.2 0.4 −0.3 0.4 −0.6 0.7
Saturna Island 48.78 0.4 1.1 0.0 0.2 0.4 0.5
Hohenpeißenberg 47.80 0.0 0.5 0.5 0.6 −0.1 1.6
Davos 46.81 0.2 0.5 −0.1 0.3 −0.1 0.2
Arosa 46.78 0.6 1.5 −0.5 1.5 −0.1 0.5
Aosta 45.74 −0.1 0.6 0.0 0.6 −0.6 0.8
Toronto 43.78 0.5 1.0 −0.2 0.5 0.4 0.5
Kislovodsk 43.73 −0.3 0.3 −0.1 0.3 0.2 0.2
Rome 41.90 −0.1 1.1 −0.8 1.3 −0.2 0.5
Thessaloniki 40.63 0.4 0.7 −0.7 0.9 ∗ ∗
Boulder 40.03 0.1 0.5 0.1 0.9 ∗ ∗
Athens 37.99 0.9 0.8 −0.4 0.6 0.0 0.4
(b) mean±SE (N ) mean±SE (N) mean±SE (N)
All Brewers 0.29±0.03 (1051) −0.04±0.03 (1064) 0.07±0.03 (861)
GOME-2 0.23±0.02 (1057) 0.08±0.01 (971) −0.03±0.02 (677)
OMI (TRM) 0.15±0.02 (741) 0.00±0.02 (438) 0.01±0.02 (395)
OMI (STL) 0.12±0.01 (741) 0.00±0.01 (438) 0.01±0.02 (395)
SE: standard error.∗Missing values are those possessing<25 days of data in each bimonthly period or no data.
only if at least 25 daily values were available. The bimonthly averages for each station in the examined periods are pre-sented in Table 4a. Table 4b shows the mean and standard error (σ/√N )of all bimonthly averages in each studied vol-canic period. Averaging the departures from the pre-volvol-canic baseline for all Brewer stations and for all bimonthly periods gives a mean SO2 columnar departure of 0.10±0.03 DU. This estimate is on the same order of magnitude as the cor-responding statistics for OMI (TRM) SO2 column
depar-tures (0.05±0.02 DU), OMI (STL) (0.04±0.01 DU) and that measured by GOME-2 (0.09±0.02 DU). The standard deviation of the bimonthly averages relative to their base-lines, which was calculated from a large sample of data, was
taken here as an approximation of the typical uncertainties in the columnar SO2measurements performed by the group of
Brewers, OMI and GOME-2 instruments following volcanic eruptions.
2.3 Modelling tools
Figure 2.Integrated column of SO2(DU) from Bárðarbunga emissions as simulated with FLEXPART-WRF model,(a)22 September 2014 00:00 UTC;(b)22 September 09:00 UTC. Dashed lines indicate the orientation of the two distinct plumes overlapping over central Europe.
WRF model are taken from the National Center for Envi-ronmental Prediction (NCEP) final analysis (FNL) dataset at a 1◦×1◦ resolution. The sea surface temperature (SST)
is initialized from the NCEP 1◦×1◦ analysis. A total of
40 000 tracer particles are assumed for each release in FLEX-PART simulations. The use of 1-hourly WRF meteorologi-cal fields at a 45×45 km spatial resolution allows a more detailed representation of the volcanic plume dispersion but also implies a significant increase in computational time. To overcome this computational time cost, source–receptor re-lationships between station measurements and volcanic ac-tivity are also analysed with the use of HYSPLIT (Hybrid Single-Particle Lagrangian Integrated Trajectory) model tra-jectories (Stein et al., 2015) of long-range transport driven by the 3-hourly meteorological dataset Global Data Assimi-lation System (GDAS) at a resolution of 1◦×1◦.
3 Results and discussion 3.1 The 2014 Bárðarbunga case
Bárðarbunga was continuously active during September– October 2014, but it was only during 18–26 September when meteorological conditions favoured transport towards Eu-rope as shown by back trajectory analyses. A detailed de-scription of the transport of Bárðarbunga plumes towards the station of Hohenpeißenberg is provided using the FLEX-PART Lagrangian particle dispersion model offline coupled with the WRF_ARW atmospheric model. The simulation pe-riod is 18–26 September 2014. We assume a constant SO2
release rate of 119 kilotons per day as reported by Gíslason et al. (2015) from near the source SO2measurements
dur-ing the first weeks of the eruption. Similar emission rates are also suggested by Schmidt et al. (2015) through comparisons between NAME simulations (UK Met Office’s Numerical Atmospheric-dispersion Modelling Environment) and OMI
satellite retrievals. The emission height is set to between 0 and 3500 m above ground level, consistent throughout the simulation period. The establishment of an anticyclonic flow over the British Isles on 21 September 2014 (not shown here) resulted in the separation of the volcanic SO2field into
two distinct plumes (Fig. 2a). On 22 September the primary plume (plume 1) becomes stagnant over the topographic bar-rier of the Alps (Fig. 2b). The secondary plume is advected southwards by the intense northerly winds over the North Sea. The two plumes overlap at about 09:00–11:00 UTC. Taking a closer look at the surface SO2values sampled
dur-ing this event by surface air quality stations in the Nether-lands, several days of enhanced SO2were discovered, which
indicate an area of stagnation or blocking of the flow. Trajec-tory calculations performed at the Royal Netherlands Mete-orological Institute (KNMI) correspond well to the calcula-tions shown in Fig. 2 but also show that the air parcels stayed over northern Europe for some time after a very fast flow over the North Sea, which agrees with the spikes found in the surface SO2records observed over the Netherlands
dur-ing a period of several days.
The high SO2concentrations, which were recorded almost
simultaneously at stations over Europe at various sites during the period 21–29 September 2014, are thus associated with the activity of Bárðarbunga volcano (Ialongo et. al., 2015; Table A1, see Appendix A). This is also supported by the back trajectory analysis performed with the HYSPLIT dis-persion model that is shown in Fig. 3. All back trajectories start at 12:00 UTC on the day of maximum SO2observations
for each of the Brewer stations and indicate that the arrival of air masses originated from Iceland.
As shown in Fig. 4a, the SO2plume was detected by the
Brewer instruments located in the passage of the volcanic SO2plume and from different ground-based networks.
ex-Figure 3.HYSPLIT 120 h back trajectories of air masses arriving on the day of maximum SO2records for each of the Brewer stations at De Bilt, Hohenpeißenberg, Hradec Králové, Jokioinen, Obninsk and Sodankylä.
Figure 5.Mean surface SO2measured by AirBase class 1–2 sta-tions located within 150 km from seven nearest Brewer stasta-tions in Europe as listed in Table 3. The arrow marks the starting date of the eruption (beginning on 31 August 2014 and continuing to be active throughout the whole bimonthly period and beyond).
cursions. Also it should be noted here that no enhanced SO2
columns were detected by the Brewers located outside of the geographical area covered by the volcanic plume (Fig. 4b). In all volcanic cases we have applied a criterion according to which each daily average from either OMI or GOME-2 should be calculated if and only if more than half of the indi-vidual overpasses had data on a given day.
The eruption took place at the beginning of Septem-ber 2014, and several European countries experienced high concentrations of SO2 at ground level during the rest of
September. Figure 5 shows the response of ground-level Air-Base stations under the plume located within 150 km from the nearest Brewer station plotted together with the coin-cident Brewer SO2 column measurements. Interestingly, it
suggests that the highest amount of the SO2 column
mea-sured by the majority of the Brewers on 21 September 2014 due to the volcano reached the surface with a time lag of about 1 day. The high volcanic concentrations were success-fully measured by the ground-based AirBase network. Due to strong European efforts over the last decades to reduce SO2
emissions, high concentrations of SO2are now quite rare in
western Europe (e.g. Vestreng et al., 2007) except in the areas affected by industrial or shipping emissions. In situ air qual-ity stations observed high values of SO2at the ground level
on the coast of France, in the United Kingdom, the Nether-lands and Germany between 21 and 25 September 2014. This all points towards a volcanic episode with a large spatial ex-tent.
As can be seen from Fig. 4a, the highest SO2column
de-partures from the pre-volcanic baseline were observed from 21 to 22 September 2014. The mean SO2column measured
by the Brewers under the plume was 2.4±0.8 DU, which was 5 times greater than the mean column of SO2measured
by the Brewers outside of the plume (−0.1±0.1 DU) by 2.5 DU on average. The error bars show the standard de-viation of the daily SO2 values of all stations during the
non-perturbed 10-day period prior to the volcanic eruption. These differences provide rough estimates of the additional SO2loading induced by the volcanic eruption over Europe
which exceeds 3σ. Comparison between satellite data and Brewer are limited for the purposes of interpretation be-cause satellite measurements are sparse, representing an av-erage SO2column over a relatively large satellite pixel, while
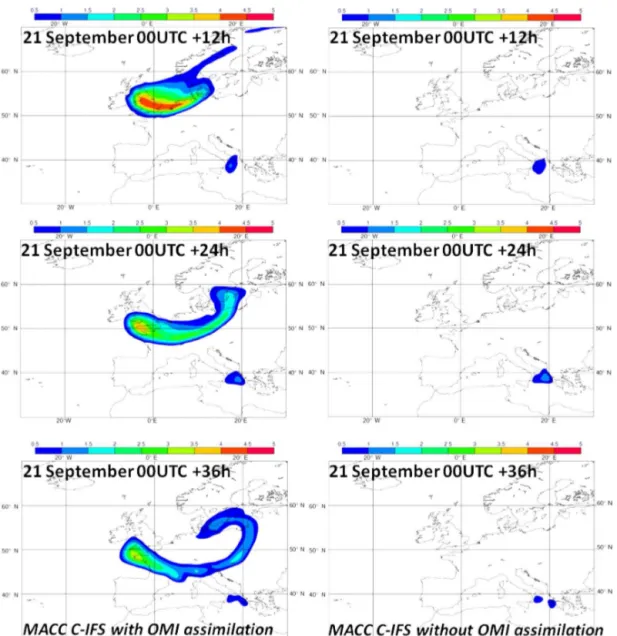
the Brewer observations are designed to provide a local point measurement. In spite of the sparsity of OMI observa-tions post Bárðarbunga volcanic eruption, satellite data were used for assimilation in the SO2analyses and forecasts
pro-duced with the MACC (Monitoring Atmospheric Composi-tion and Climate) system (http://atmosphere.copernicus.eu/). This near-real-time forecasting system assimilates satellite observations to constrain modelling forecasts (Inness et al., 2015; Flemming et al., 2015). The OMI instrument aboard the Aura satellite provided information about concentrations of volcanic SO2 emitted by the Icelandic Bárðarbunga
vol-cano on 20 September; these observations were assimilated in 2014 by the MACC system in cases of volcanic eruptions, i.e. when OMI values exceeded 5 DU. As shown in Fig. 6 (the charts of total column SO2 are taken from the
web-site http://atmosphere.copernicus.eu/), the subsequent fore-casts capture the transport of the plume of volcanic SO2
southward, while spreading over the continent on 21 and 22 September. The plume stretched all the way from Finland through Poland, Germany and France to southern England. A parallel forecast, for which no OMI data were used (Fig. 6, right), did not show any elevated SO2values, confirming that
“normal” emissions of SO2(including shipping and
indus-trial activities) could not explain the observed situation. Finally, it should be mentioned here that the thin aerosol layer that was detected by the PollyXT lidar (Engelmann et al., 2016) over Leipzig at around 2–3 km on 23 and 24 of September 2014 was mostly associated with volcanic ash ad-vection (Fig. 7). A corresponding cluster analysis of all 155-hourly HYSPLIT back trajectories during this period and for the heights of the layer detected by the lidar (∼2.5–3.5km) is shown in Fig. 8. The increased wind shear that is evident be-tween these heights does not allow a robust characterization of the air masses. However, the source contribution of about 20 % from Icelandic air masses supports the volcanic origin of the detected plume. During volcanic eruptions, ash and SO2 may be injected to different altitudes and may follow
Figure 6.Charts of forecasted total column SO2produced within the MACC system for 21 September 2014 with OMI data assimilation (left) and without OMI data assimilation (right).
the Brewer stations in this system will be the early detection of SO2plumes transported over continental areas that would
trigger the associated forecasting systems (models and net-works).
3.2 The 2011 Nabro volcano plume
A major eruption of Mt Nabro, a 2218 m high volcano on the border between Eritrea and Ethiopia (13.37◦N, 41.7◦E),
oc-curred on 12–13 June 2011. The volcanic eruption injected ash, water vapour and an estimated 1.3–2.0 Tg of SO2 into
the upper troposphere and lower stratosphere (Fairlie et al., 2014, and references therein). In the first phase of the erup-tion, the main transport pattern of emitted SO2followed the
strong anticyclonic circulation over the Middle East and Asia associated with the Asian summer monsoon at that time of
year (Clarisse et al., 2014, and references therein). In the first month after the eruption stratospheric aerosols were mainly observed over Asia and the Middle East and by day 60 cov-ered the whole Northern Hemisphere. Estimated aerosol alti-tudes from various instruments were between 12 and 21 km (Clarisse et al., 2014). By July 2011 Nabro had cumulatively emitted 5 to 10 % of what was released by Mount Pinatubo in 1991 (∼20 Tg), ranking it among the largest SO2
emis-sions in the tropical stratosphere (up to at least 19 km) since Pinatubo (Krotkov et al., 2011). Sulfur dioxide signals of vol-canic origin were detected both by Brewer and satellite mea-surements over East Asia, where the volcanic SO2plume was
Figure 7.Range-corrected signal at 1064 nm from the PollyXT li-dar in Leipzig on 23 (up) and 24 September 2014 (down). The red rectangle indicates the location of the volcanic ash layer.
Figure 8.Cluster analysis of the HYSPLIT back trajectories that arrive every hour (from 23 September 12:00 UTC up to 24 Septem-ber 18:00 UTC) at 2.5–3.5 km height over Leipzig. A 54 % cluster percentage means that there is 54 % chance that the SO2arriving anywhere between 2.5 and 3.5 km over Leipzig originates from the specific direction.
with the HYSPLIT dispersion model for T’aipei (Taiwan) as shown in Fig. 10a. The analysis indicates that the upper-tropospheric air masses arriving at T’aipei on 19 June, when the peak in SO2is observed, originate from Africa.
Figure 9. SO2 column departures from the unperturbed 10-day pre-volcanic baseline measured by Brewer, OMI (TRM, STL) and GOME-2 over T’aipei, Taiwan, during June–July 2011 following the 2011 Nabro volcanic eruption (on 12 June 2011).
The Nabro volcanic plume was mainly transported to East Asia and was detected by various satellite instruments which provide better spatial coverage than the Brewers. A special case study focuses on discrepancies found between ground-based and satellite observations of the volcanic SO2plume.
A Brewer located in Tenerife, Spain, detected an increase in the SO2column, which was not clearly detected by the OMI
and GOME-2 satellite overpasses.
More specifically, Fig. 10b shows back trajectories from Izaña (Tenerife) during 19–29 June 2011 at 15, 17.5 and 20 km heights. It appears that the upper-tropospheric–lower-stratospheric air masses arriving at Tenerife during 19– 29 June originated from Nabro. In June 2011 the Nabro vol-cano ash plume was detected by the Micropulse Lidar (MPL) located at Santa Cruz de Tenerife (Canary Islands, Spain). The volcanic plume height ranged from 12 km on 19 June to 21 km on 29 June (Sawamura et al., 2012). Figure 11 shows the columnar SO2 departures from the unperturbed 10-day
pre-volcanic baseline measured by the Brewer at Izaña fol-lowing Nabro. The daily mean SO2departures (Fig. 11) show
a 0.3 DU increase at the beginning of the event (19 June), reaching 0.6 DU on 29 June when the layer is found at a higher altitude. The signal is not strong and is near the error of 0.5 DU estimated for SO2measurement (Stanek, personal
communication, 2016), but the observations are consistent (independent of the ozone and air mass), since at Izaña about 100 O3/SO2measurements per day are performed resulting
in reduced standard errors associated with daily means as compared to individual observations. The Langley calibra-tion is tracked between calibracalibra-tions by measurements of the internal lamp (Langley and lamp are shown in Supplement Fig. S1). The increase in SO2due to the passage of the Nabro
Figure 10.HYSPLIT back trajectories of air masses(a)from T’aipei (Taiwan) on 19 June 2011 and(b)from Izaña (Tenerife) for days 19–29 June 2011. Nabro’s location is indicated by the black arrow.
Figure 11. SO2column departures from the unperturbed 10-day pre-volcanic baseline measured by the Brewer, OMI (TRM, STL) and GOME-2 over Izaña, Tenerife, during June–July 2011 follow-ing the 2011 Nabro volcanic eruption. SO2 calculations by the Brewer were performed using the Langley calibration and the zero calibration at Izaña (assuming SO2=0 during the days 6 and 7 June 2011).
In this case the Brewer at Izaña has been able to detect an SO2plume at a high altitude from a volcano located 7000 km
from the Canary Islands, indicating that the Brewer network is sensitive enough to be incorporated into columnar SO2
monitoring from volcanic eruptions in worldwide networks. The case of the 2011 Nabro eruption shows an example of the importance of the Brewer spectrophotometers in mea-suring and detecting changes in SO2 amounts in the
atmo-sphere due to volcanic eruptions, in cases where signal in the satellite overpasses is low. This is true for the case of Izaña (Tenerife), where it appears that OMI and GOME-2 did not clearly detect increases in SO2 column of volcanic
origin between 19 June and 1 July as was the case with the Brewer instrument (Fig. 11). During some days between 19 June and 1 July, the Brewer SO2columns at Izaña rose
above the uncertainty of 0.5 DU for the Brewer SO2
mea-surements at this station, whereas the satellite SO2columns
stayed mostly within the uncertainty of 0.4 DU estimated for OMI and GOME-2 satellite retrievals.
These findings can provide clues to the detection limits of such events from a well-calibrated Brewer network and a space-borne instrument. They need further clarification with more Brewers and a larger number of cases.
3.3 The case of the 2010 Eyjafjallajökull volcanic eruption
The Eyjafjallajökull volcano, Iceland (63.63◦N,
19.6215◦W; 1666 m a.s.l.), erupted explosively on
Figure 12.Mean SO2column departures from the unperturbed 10-day pre-volcanic baseline measured by Brewers, OMI (TRM, STL) and GOME-2 during April–May 2010 over Europe following the 2010 Eyjafjallajökull volcanic eruption for(a)stations under the volcanic SO2 plume and(b)stations outside of the plume. The error bars for the Brewer observations show the standard deviation of all daily values during the unperturbed 10-day period prior to the volcanic eruption. Brewer stations under the plume are Sodankylä, Obninsk, Manchester, De Bilt, Uccle, Belsk, Reading, Hohenpeißenberg, Davos and Arosa. Stations outside of the plume are Vindeln, Oslo, Norrköping, Copenhagen, Hradec Králové, Aosta, Kislovodsk, Rome, Thessaloniki and Athens. Each daily average from either OMI or GOME-2 was calculated if and only if more than half of the individual overpasses had data on a given day. The arrow marks the starting date of the eruption (beginning on 14 April until 24 May 2010).
considerably greater quantities of both ash and SO2 were
released (Thomas and Prata, 2011).
Figure 12 shows the responses of Brewer stations un-der the volcanic SO2 plume and the average of Brewer
sta-tions outside of the plume together with OMI and GOME-2 satellite observations. We determined 10 stations as being under the plume in 2010 and 10 stations as being outside of the plume based on the analysis of forward and back-ward trajectories of air masses following the volcanic erup-tion. The stations determined to be under the plume in 2010 (shown in Fig. 12a) are Sodankylä, Obninsk, Manchester, De Bilt, Uccle, Belsk, Reading, Hohenpeißenberg, Davos and Arosa. The stations determined to be outside of the plume are Vindeln, Oslo, Norrköping, Copenhagen, Hradec Králové, Aosta, Kislovodsk, Rome, Thessaloniki and Athens (Fig. 12b).
We should note here that volcanic clouds can be rather narrow plumes with diameters on the order of a few tens of kilometres (e.g. Stohl et al., 2011; Webley et al., 2012; Thorsteinsson et al., 2012; Kristiansen et al., 2012; Kokkalis et al., 2013), and thus it is possible that a volcanic layer de-tected at a specific station is not observed by neighbouring stations. The measurements at Uccle and De Bilt that are lo-cated at a horizontal distance of 150 km are different during the Eyjafjallajökull episode and provide a very good exam-ple. On 2 May 2010 the mean daily SO2 is 5.8 DU at De
Bilt and −0.2 DU at Uccle. As seen in the corresponding back trajectories for that day in Fig. 13, air masses origi-nating from Iceland arrive at De Bilt at heights of 6–7 km and have probably transported the volcanic cloud over that
station. In contrast similar back trajectories on the same day for the case of Uccle indicate transport of air masses from Iceland but at lower heights (3–4 km) that were probably not affected by the volcanic emissions. In another case of trans-port on 11 May 2010, Uccle was outside of the plume (see Fig. 13), while the mean daily SO2for De Bilt was 0.9 DU.
On 18 May 2010, both De Bilt and Uccle stations detected a volcanic cloud with SO2daily means of 1.7 and 1.2 DU
re-spectively. To summarize, in spite of the proximity of Uccle and De Bilt, the transport heights and trajectories can have a different result in transporting volcanic gases.
In Table A1 of Appendix A, we present the dates when the examined Brewer stations were either under or outside of the volcanic SO2plume. Careful analysis of the
trajecto-ries of the volcanic plumes in 2010 and 2014 helped verify these analyses. The distinction between stations outside of the plume and stations under the plume was done as follows: whenever SO2 at each station measuring exceeded 2 DU
(2σ), back trajectories were calculated and the origin was compared to the location of the volcanic eruption. All these stations have been considered to be under the SO2plume. All
other stations, for which columnar SO2amounts were within
2σ and did not originate from the area of the eruption, were considered to be outside of the volcanic SO2plume.
As we can see from Fig. 12, the columnar SO2departures
at stations located under the passage of the volcanic SO2
plume exceeded 0.3 DU (reaching 1.5 DU in some cases), whereas at stations located outside of the plume, the colum-nar SO2 departures did not exceed 0.3 DU. Moreover,
Figure 13.HYSPLIT 120 h back trajectories of air masses arriving at De Bilt (left column) and Uccle (right column) on 2 May 2010 (first row), 11 May 2010 (second row) and 18 May 2010 (third row).
which the volcanic aerosol content was observed by EAR-LINET over Europe: 15–26 April, 5–13 May and 17–20 May. These periods were determined from measurements of the integrated backscatter at 532 nm in the volcanic layers (Pap-palardo et al., 2013). We estimate high SO2 columnar
de-partures measured by the Brewers under the plume during
14 April and 23 May 2010 of up to 6.0 DU (e.g. Arosa, 18 May 2016).
We note here that the ash cloud caused further disruptions to air transportation on 4–5 May and 16–17 May 2010, par-ticularly over Ireland and the UK. The average SO2columnar
Figure 14.Mean SO2column departures from the unperturbed 10-day pre-volcanic baseline measured by Brewers, OMI (TRM, STL) and GOME-2 during August–September 2008 over Europe and Canada and the USA following the 2008 Kasatochi volcanic eruption. The error bars for the Brewer observations show the standard deviation of all daily values during the unperturbed 10-day period prior to the volcanic eruption. Stations in Europe include Sodankylä, Vindeln, Jokioinen, Norrköping, Copenhagen, Manchester, De Bilt, Belsk, Reading, Uccle, Hradec Králové, Hohenpeißenberg, Davos, Arosa, Aosta, Kislovodsk, Rome, Thessaloniki and Athens. Stations in Canada and the USA include Churchill, Edmonton, Goose Bay, Regina, Saturna Island, Toronto, Boulder and Mauna Loa. Each daily average from either OMI or GOME-2 was calculated if and only if more than half of the individual overpasses had data on a given day. The arrow marks the date of the eruption (7 August 2008).
UK (Manchester and Reading) during these two periods were estimated to 1.1±0.3 and 1.5±0.4 DU respectively. These amounts were higher than the amounts measured outside of the plume (−0.1±0.2 and−0.1±0.1 DU, accordingly) by almost 1.4 DU on average.
3.4 An eruption of larger-scale importance – the 2008 Kasatochi case
The eruption of Kasatochi volcano on 7–8 August 2008 in-jected large amounts of material and SO2 into the
tropo-sphere and lower stratotropo-sphere of the northern middle lat-itudes during a period of low stratospheric aerosol back-ground concentrations. The Kasatochi volcano in the central Aleutian Islands of Alaska (52.17◦N, 175.51◦W) erupted
three times between 22:01 UTC on 7 August and 04:35 UTC
on 8 August 2008 (Bitar et al., 2010). Aerosols from the vol-canic eruption were detected by lidar in Halifax shortly af-ter the eruption (Bitar et al., 2010). The total mass of SO2
injected into the atmosphere by the eruption is estimated at 1.7 Tg, with about 1 Tg reaching the stratosphere (above 10 km a.s.l.) (Kristiansen et al., 2010).
We have studied the columnar SO2 amounts following
the Kasatochi eruption in August 2008 from ground-based and satellite data. Figure 14 shows the columnar SO2
Table 5.Correlation coefficients between the mean columnar SO2measured by the Brewers in Europe and provided by the satellite products of OMI and GOME-2 during the volcanic eruptions of Kasatochi (2008), Eyjafjallajökull (2011) and Bárðarbunga (2014) for stations located under the volcanic SO2plume.
Europe August–September 2008 April–May 2010 September–October 2014
Brewers and GOME-2 0.86[59] (p <0.0001) 0.31[54] (p=0.02336) 0.44[39] (p=0.00496) Brewers and OMI (TRM) 0.86[50] (p <0.0001) (∗) [23] (∗) [15] Brewers and OMI (STL) 0.86[50] (p <0.0001) (∗) [23] (∗) [15] GOME-2 and OMI (TRM) 0.92[48] (p <0.0001) (∗) [21] (∗) [15] GOME-2 and OMI (STL) 0.93[48] (p <0.0001) (∗) [21] (∗) [15]
Bold: all the above correlations are significant at confidence level 95 % or greater (ttest).∗Missing correlations are those possessing less than 30
days of data in each bimonthly period. In square brackets: number of pairs.
The SO2plume was clearly seen by the Brewers in Canada
and the USA (Fig. 14), and it was also detected by the major-ity of the Brewers in Europe with a delay of about 3 days. The total SO2columnar departures averaged over Canada during
the period 12–20 August 2008 are estimated to 0.9±0.2 DU. Accordingly over Europe, we estimate a mean SO2columnar
departure of 1.0±0.1 DU during the period 15–22 August 2008. This number gives a rough estimate of the average vol-canic SO2 column measured by the Brewers over Europe.
We note here that the e-folding time of the Kasatochi SO2,
i.e. the time where the volcanic SO2 amount decayed, was
estimated to be about 8–9 days (Krotkov et al., 2010). The high amounts of SO2 and the variability of SO2
measured in Europe by the Brewers after the eruption of Kasatochi in August 2008 are in line with OMI and GOME-2 satellite observations. More specifically, OMI (TRM) shows an average SO2columnar departure of 0.5±0.1 DU during the period 15–22 August 2008, OMI (STL) an average SO2
columnar departure of 0.4±0.1 DU and GOME-2 an aver-age SO2columnar departure of 0.8±0.1 DU.
The Brewer data have been correlated with those from OMI and GOME-2. The Pearson’s correlation coefficients between the three datasets were all highly statistically signif-icant (>99 %). The correlation between SO2from the
Brew-ers and SO2 from GOME-2 at 19 stations averaged over
Europe is +0.86 (t value=12.54; p value<0.0001; N= 59). Accordingly, the correlation between Brewer and OMI (TRM) SO2data is+0.86 (tvalue=11.77;p <0.0001;N= 50), and between GOME-2 and OMI (TRM) data, it is+0.92 (t value=16.32, p <0.0001,N =48). The same correla-tions are found for the Brewer–OMI (STL) and GOME–OMI (STL) data pairs. These correlations were calculated from 60 daily averages during the Kasatochi volcanic eruption in August–September 2008. The statistical tests gave significant results and verified the capability of the Brewers in detecting natural SO2emitted by volcanoes when the volcanic plume
of SO2passes over the ground sites. We note here that there
is a general consistency between all three datasets (Brewers, OMI and GOME-2) on the changes in SO2column following
the Kasatochi volcanic eruption.
Table 5 summarizes the correlation coefficients between the mean columnar SO2measured by all Brewers over
Eu-rope and provided by the satellite products of OMI and GOME-2 during the globally extended Kasatochi event. The correlation coefficients have high statistical significance ex-plaining more than 70 % of the total variance between the columnar SO2measurements from the ground and space in
the case of Kasatochi. However, the discrepancies found be-tween satellite and Brewer observations during the other vol-canic eruptions could be impacted by the sparsity of co-incident measurements and thus cannot confirm or deny Kasatochi case findings at high significance levels.
4 Conclusions
In this work we provide evidence that the current network of Brewer spectroradiometers is capable of identifying colum-nar SO2plumes of volcanic origin. The study is based on the
results from the three largest volcanic eruptions (VEI≥4) in the past decade when elevated SO2plumes have passed over
Brewer stations in the Northern Hemisphere. The analysis included a fourth eruption, namely Bárðarbunga, because it perturbed the SO2regime over large parts of Europe and
ex-tended from the free troposphere down to the surface. Back and forward trajectory analysis have been used to aid identi-fying and selecting measurements taken under and outside of the volcanic SO2plume. When the plume was passing over
a site, the SO2signal was found to be quite high, exceeding
3σ of daily values relative to the average levels taken during the unperturbed measurements over 10 days preceding each eruption. On average, the mean SO2columnar amount to be
attributed to the volcano is estimated to be on the order of 2 DU as discussed in Sect. 3. In addition to the Brewer net-work, comparisons were made with other instruments (e.g. surface SO2 sensors) that were located under the volcanic
SO2plumes. Moreover, satellite measurements of columnar
SO2from OMI and GOME-2 collocated with the Brewer
net-work were used for comparisons.
after the eruption. Starting with the Kasatochi eruption, as it appears from Fig. 14, the plume can be detected 4 days after the eruption over Canada and the US and about 7 days over Europe with an average amplitude on the order of 2 DU com-pared to the unperturbed 10-day pre-volcanic period (base-line). All estimates are based obviously on measurements taken under the plume. The Kasatochi eruption provided a very good example for a volcanic SO2plume to be observed
not only by the ground-based instruments but by space-borne ones as well (OMI and GOME-2). Relative to the undis-turbed period before Kasatochi, the amplitude of the signal is 2 DU for GOME-2 and 1.5 DU for OMI. The results for the other volcanic eruptions are similar for the Brewer net-work, but unfortunately because of the sparsity of satellites passing over the Brewer stations, the satellite data concur with those from the Brewers only in Kasatochi. Based on the above discussion, it appears that currently no single net-work can independently and fully monitor the evolution of volcanic SO2 plumes. Among a few reasons are a lack of
measurements during peak values, complications from mete-orological events, ejection heights and exposure conditions. The evidence presented here suggests that a combination of observations from various instruments, aided by chemical transport models and operated in synergy, could address such a complex issue.
The combination of the observation discussed above and modelling tools can assist in detecting existing volcanic plumes but also in forecasting their evolution, which can have importance not only for air traffic warnings but also for air pollution in the lower layers of the atmosphere. Therefore, an automated source–receptor modelling tool could be pro-posed as follows: a modelling system based on FLEXPART and HYSPLIT backward-trajectory simulations could be au-tomatically triggered whenever high SO2values are detected
at a Brewer station above a specific threshold (e.g. 3σof sta-tion’s daily values) or when a lidar instrument detects highly depolarizing layers that were not advected from a geograph-ical location over a desert. The operational use of such syn-ergistic activity could provide near-real-time and forecasting information on the evolution of volcanic episodes and also develop a comprehensive database of measurements useful to improve model forecasts. This new well-tuned and orga-nized synergistic activity of monitoring networks, observa-tions and modelling from the ground and space could create a promising monitoring tool for volcanic and other extreme emissions, which would form the basis of a new regional SO2
columnar forecasting facility.
5 Data availability
SO2columns at Churchill, Goose, Edmonton, Regina,
Sat-urna Island and Toronto in Canada, T’aipei in Taiwan, and Boulder and Mauna Loa in the US were obtained from the World Ozone and Ultraviolet Radiation Data Centre (WOUDC; http://www.woudc.org/; last access: 10 October 2016) and the NOAA-EPA Brewer Spectrophotometer UV and Ozone Network (NEUBrew; http://www.esrl.noaa.gov/ gmd/grad/neubrew/; last access: 10 October 2016). OMI and GOME-2 satellite SO2data products were downloaded
from the Aura Validation Data Center (AVDC) (available from http://avdc.gsfc.nasa.gov/index.php?site=_245276100; last access: 10 October 2016). Surface SO2 concentrations
Appendix A
Table A1.Dates at which the Brewers were determined to be under or outside of the volcanic SO2plume, based on analysis of back trajectories of the volcanic plumes in 2010 and 2014. The distinction between stations outside of the plume and stations under the plume was done as follows: at each station measuring SO2exceeding 2 DU (2σ), we calculated back trajectories and found that their origin was at the volcanic eruption. All these stations have been considered to be under the SO2plume. All other stations, for which columnar SO2amounts were within 2σ and did not originate from the area of the eruption, were considered to be outside of the volcanic SO2plume. During the Kasatochi eruption all Brewers were considered to be under the volcanic SO2plume.
Station Lat (deg) Long (deg) Alt (m) 2010 2014
Sodankylä 67.36 26.63 180 20 Apr 27 and 29 Sep
Vindeln 64.24 19.77 225 Outside the plume 29 Sep
Jokioinen 60.82 23.50 106 No data 27 Sep
Oslo 59.90 10.73 50 Outside the plume Outside the plume
Norrköping 58.58 16.15 43 Outside the plume 30 Sep
Copenhagen 55.63 12.67 50 Outside the plume 24 Sep
Obninsk 55.10 36.60 100 23 and 25 Apr 28 Sep
Manchester 53.47 −2.23 76 16 May 21 Sep
Warsaw 52.17 20.97 107 No data Outside the plume
De Bilt 52.10 5.18 24 2, 11, 18 May 21 Sep
Belsk 51.84 20.79 180 10 May Outside the plume
Reading 51.44 −0.94 66 16 May 21 Sep
Uccle 50.80 4.36 100 18 May 21–22 Sep
Hradec Králové 50.18 15.84 285 Outside the plume 24 Sep
Hohenpeißenberg 47.80 11.01 985 18 May 22 Sep
Davos 46.81 9.84 1590 27 Apr and 18–19 May Outside the plume
Arosa 46.78 9.67 1840 18 May Outside the plume
Aosta 45.74 7.36 569 Outside the plume 23 Sep
Kislovodsk 43.73 42.66 2070 Outside the plume Outside the plume
Rome 41.90 12.52 75 Outside the plume Outside the plume
Thessaloniki 40.63 22.95 60 Outside the plume No data