ACPD
14, 21101–21148, 2014Scattering and absorption properties
of near-surface aerosol
U. C. Dumka et al.
Title Page
Abstract Introduction
Conclusions References
Tables Figures
◭ ◮
◭ ◮
Back Close
Full Screen / Esc
Printer-friendly Version Interactive Discussion
Discussion
P
a
per
|
Discus
sion
P
a
per
|
Discussion
P
a
per
|
Discussion
P
a
per
|
Atmos. Chem. Phys. Discuss., 14, 21101–21148, 2014 www.atmos-chem-phys-discuss.net/14/21101/2014/ doi:10.5194/acpd-14-21101-2014
© Author(s) 2014. CC Attribution 3.0 License.
This discussion paper is/has been under review for the journal Atmospheric Chemistry and Physics (ACP). Please refer to the corresponding final paper in ACP if available.
Scattering and absorption properties of
near-surface aerosol over
Gangetic–Himalayan region: the role of
boundary layer dynamics and long-range
transport
U. C. Dumka1, D. G. Kaskaoutis2, M. K. Srivastava3, and P. C. S. Devara4
1
Aryabhatta Research Institute of Observational Sciences, Nainital, India 2
Department of Physics, School of Natural Sciences, Shiv Nadar University, Tehsil Dadri, India 3
Department of Geophysics, Banaras Hindu University, Varanasi, India 4
Amity Institute of Laser Technology & Optoelectronics, Amity University Haryana, Gurgaon, India
Received: 27 June 2014 – Accepted: 31 July 2014 – Published: 18 August 2014
Correspondence to: U. C. Dumka ([email protected]; [email protected])
ACPD
14, 21101–21148, 2014Scattering and absorption properties
of near-surface aerosol
U. C. Dumka et al.
Title Page
Abstract Introduction
Conclusions References
Tables Figures
◭ ◮
◭ ◮
Back Close
Full Screen / Esc
Printer-friendly Version Interactive Discussion
Discussion
P
a
per
|
Discus
sion
P
a
per
|
Discussion
P
a
per
|
Discussion
P
a
per
|
Abstract
Knowledge of light scattering and absorption properties of atmospheric aerosols is of vital importance in evaluating their types, sources and radiative forcing. This is of par-ticular interest over the Gangetic–Himalayan (GH) region due to large aerosol loading over the plains and the uplift over the Himalayan range causing serious effects on
5
atmospheric heating, glaciology and monsoon circulation. In this respect, Ganges Val-ley Aerosol Experiment (GVAX) was initiated over the region aiming to examine the aerosol properties, source regions, uplift mechanisms and aerosol-cloud interactions. The present study examines the temporal (monthly, seasonal) evolution of scattering (σsp) and absorption (σap) coefficients, their wavelength dependence, and the role of 10
the Indo-Gangetic plains (IGP), boundary-layer dynamics (BLD) and long-range trans-port (LRT) in the aerosol uplift over the Himalayas. The measurements are performed at the elevated site Nainital via the Atmospheric Radiation Measurement Mobile Facil-ity including several instruments (Nephelometer, Particle Soot Absorption Photometer, etc.) during June 2011 to March 2012. Theσspandσapexhibit a pronounced seasonal
15
variation with monsoon low and post-monsoon (November) high, while the scattering wavelength exponent exhibits higher values during monsoon, in contrast to the ab-sorption Ångström exponent which maximizes in December–March. The analysis is performed separately for particles bellow 10 and 1 µm in diameter in order to examine the influence of the particle size on optical properties. The elevated-background
mea-20
suring site provides the advantage of examining the LRT of natural and anthropogenic aerosols from the IGP and southwest Asia and the role of BLD in the aerosol lifting processes, while the aerosols are found to be well-mixed and aged-type dominant.
1 Introduction
Light scattering and absorption by atmospheric aerosol cause reduction in solar
radi-25
ACPD
14, 21101–21148, 2014Scattering and absorption properties
of near-surface aerosol
U. C. Dumka et al.
Title Page
Abstract Introduction
Conclusions References
Tables Figures
◭ ◮
◭ ◮
Back Close
Full Screen / Esc
Printer-friendly Version Interactive Discussion
Discussion
P
a
per
|
Discus
sion
P
a
per
|
Discussion
P
a
per
|
Discussion
P
a
per
|
atmosphere’s radiative and energy budget (Antón et al., 2012). On the other hand, the backscattering ratio is a crucial parameter for quantifying the cooling effect of aerosols on climate, as it is a measure of the fraction of radiation scattered back to space. Al-though it is weakly dependent on aerosol concentration, it provides useful information of the refractive index, angular dependence of scattering, size and shape of aerosols
5
(Gopal et al., 2014). Wide-spread aerosol pollution mostly from anthropogenic sources is a common phenomenon over the south Asia, with serious effects on atmospheric circulation, climate and human health (Lawrence and Lelieveld, 2010 and references therein). This aerosol-pollution layer, especially over the Indo-Gangetic Plains (IGP), is clearly observed by the satellite imagery as a thick haze layer (Atmospheric Brown
10
Clouds, ABC) over the region (Di Girolamo et al., 2004; Ramanathan et al., 2007), spreading also over the Himalayas with significant light absorption due to large Black Carbon (BC) concentration (Adhikary et al., 2007; Nakajima et al., 2007; Kopacz et al., 2010; Gautam et al., 2011).
During the last decades, the IGP has experienced increasing aerosol and pollutant
15
emissions mainly from anthropogenic sources, fossil-fuel and bio-fuel combustion and agricultural biomass burning (Lu et al., 2011; Kaskaoutis et al., 2012), which along with the natural dust emissions and long-range transport (LRT) have led to severe turbid at-mospheres (Kaskaoutis et al., 2013). As a consequence, aerosols can strongly modify the regional climate via radiative forcing (Ramanathan et al., 2005; Lau et al., 2006;
20
Gautam et al., 2010) and changes in cloud microphysics, monsoon rainfall and dy-namics (Randles and Ramaswamy, 2008, Bollasina and Nigam, 2009; Ganguly et al., 2012; Manoj et al., 2011; Dipu et al., 2013). Due to their significant influence on regional weather, climate, monsoon circulation, glaciology and human health, aerosols are sys-tematically examined over Indian Himalayas, mostly focusing on columnar properties
25
ACPD
14, 21101–21148, 2014Scattering and absorption properties
of near-surface aerosol
U. C. Dumka et al.
Title Page
Abstract Introduction
Conclusions References
Tables Figures
◭ ◮
◭ ◮
Back Close
Full Screen / Esc
Printer-friendly Version Interactive Discussion
Discussion
P
a
per
|
Discus
sion
P
a
per
|
Discussion
P
a
per
|
Discussion
P
a
per
|
initiative (Hyvärinen et al., 2009, 2011a, b). Furthermore, Raatikainen et al. (2014) ex-amined the influence of boundary-layer dynamics (BLD) and the effect of changes in boundary-layer height (BLH) on aerosol concentrations over the IGP and their trans-port up to the Himalayas foothills. Panwar et al. (2013) analyzed the PM and BC aerosol mass concentrations at Mukteshwar, while Komppula et al. (2009) and Neitola
5
et al. (2011) focused on the aerosol size distribution and new particle formation at the same site.
To improve the knowledge of radiative properties of atmospheric aerosols, their origin and spatio-temporal distribution over the Gangetic–Himalayan (GH) region, the Ganges Valley Aerosol Experiment (GVAX) was initiated during June 2011 to March 2012. The
10
GVAX project was a joint research campaign between US Department of Energy (DoE) Atmospheric Radiation Measurement (ARM) Program, and Indian Institute of Science, Bangalore conducted at Manora Peak, Nainital, in the central part of Indian Himalayas (29.21◦N, 79.27◦E, 1958 m a.m.s.l.). More details about the GVAX project and its
op-eration can be found in Kotamarthi and Satheesh (2011), while some initial results
15
have recently been published by Manoharan et al. (2014) and Dumka and Kaskaoutis (2014).
The objective of the present work is to investigate the intensive and extensive proper-ties (scattering and absorption coefficients, their wavelength dependence and relation-ship between them) of near-surface aerosol over the GH region during the framework
20
of GVAX campaign. Moreover, seasonal and diurnal evolution of absorption and scat-tering aerosol properties as a function of particle size (D10 µm and D1 µm) reveals the specific role of particle size in the optical properties, BLD, uplift of aerosols and LRT. The nearly backgro und measuring site (i.e. Nainital), gives us the possibility of explor-ing the specific role of aerosol-pollution uplift from the IGP to the Himalayan foothills
25
ACPD
14, 21101–21148, 2014Scattering and absorption properties
of near-surface aerosol
U. C. Dumka et al.
Title Page
Abstract Introduction
Conclusions References
Tables Figures
◭ ◮
◭ ◮
Back Close
Full Screen / Esc
Printer-friendly Version Interactive Discussion
Discussion
P
a
per
|
Discus
sion
P
a
per
|
Discussion
P
a
per
|
Discussion
P
a
per
|
2 Measurements and data analysis
2.1 Observational site
The aerosol measurements were conducted by DoE/ARM Mobile Facility (AMF) de-ployed at the mountain-top (1958 m a.m.s.l.) Manora Peak, Nainital, in the GH region (Dumka and Kaskaoutis, 2014). The observational site is far from any major pollution
5
sources, such as industrialized areas and metropolitan cities, with a total population of∼0.5 million (as per census 2011) and population density of∼50 people km−2. The
site is bounded by high-altitude mountain peaks in the north and east directions and opens to the IGP region (densely populated, high polluted and aerosol laden) in the south and west. By considering the elevated nature of the site, the growth of
plane-10
tary boundary layer (PBL) in the late afternoon hours (usually above 3–3.5 km a.m.s.l.) plays a major role in bringing-up aerosols from the IGP, causing significant perturba-tions in atmospheric physics and chemistry (Dumka et al., 2010; Prabha et al., 2012). The major aerosol sources at Nainital during winter are local/regional biomass-burning emissions (domestic use and heating purposes) and transport of pollutants from the
15
IGP (Dumka et al., 2008). During pre-monsoon (March–June), the site is influenced by transporting dust plumes from Thar desert and southwest Asia (Hegde et al., 2007; Ku-mar et al., 2014) with a relative decrease in carbonaceous aerosols (Ram et al., 2008), while in post-monsoon, smoke-laden air masses from agricultural crop-residue burning in Punjab affect the site. Rain-washout process during the monsoon period decreases
20
the aerosol concentration.
2.2 Measurements and techniques
In-situ measurements of near-surface aerosol absorption (σap) and scattering (σsp) co-efficients were carried out using the aerosol observing system (AOS) (Dumka and Kaskaoutis, 2014 and references therein). The AOS was housed in an air conditioned
25
ACPD
14, 21101–21148, 2014Scattering and absorption properties
of near-surface aerosol
U. C. Dumka et al.
Title Page
Abstract Introduction
Conclusions References
Tables Figures
◭ ◮
◭ ◮
Back Close
Full Screen / Esc
Printer-friendly Version Interactive Discussion
Discussion
P
a
per
|
Discus
sion
P
a
per
|
Discussion
P
a
per
|
Discussion
P
a
per
|
(∼21.4 cm inner diameter), protected with a rain cap and a metal screen designed
to exclude insects. The aerosols were passed from the stack through a manifold and into several sampling lines that deliver the sample air to the various instruments. Be-fore the light scattering and absorption measurements were made, each aerosol sam-ple passes through an inertial impactor with a cut-offparticle diameter at either 1 µm
5
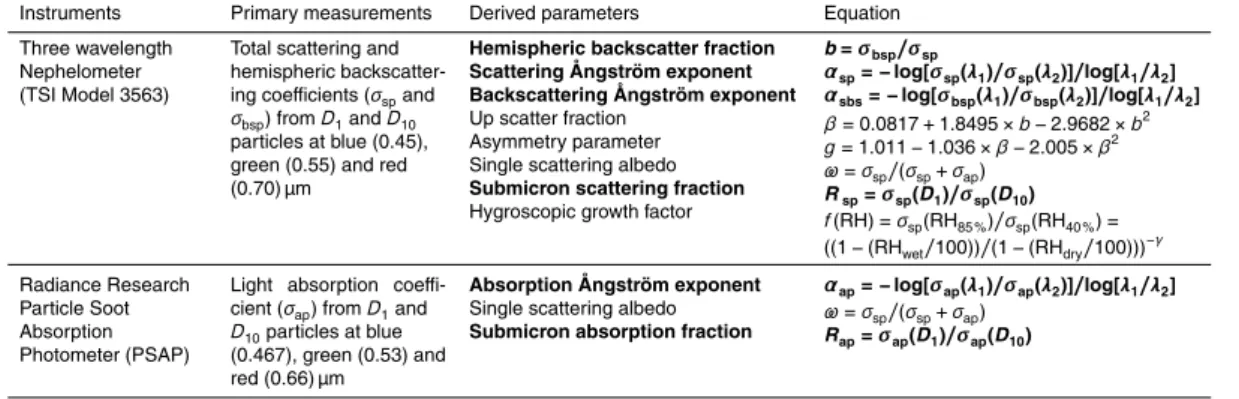
(D1 µm) or 10 µm (D10 µm). An automated inlet switch operating at 5 min frequency is used to direct the air sample to D1 µm and D10 µm impactors in order to remove the larger particles. The AOS instrumentation that is used in the current work consists of Nephelometer and Particle Soot Absorption Photometer (PSAP) from which several extensive and intensive aerosol properties have been analyzed (see Table 1). Some of
10
them (bold highlighted) are examined in the current work, while others are subjected of further analysis.
The σap was measured via the three wavelengths (0.47, 0.53 and 0.66 µm) PSAP. The PSAP uses a filter-based technique in which aerosols are continuously deposited onto a glass fibre filter and the change in the transmitted light is related to the σap
15
of the deposited particles using the Lambert Beer’s law (Bond et al., 1999). The fil-ter was changed whenever the amount of transmitting light achieved is∼70 % of the
initial intensity, while the data averaging time was 1 min. The response of PSAP de-pends on aerosol loading on the filter, amount of light scattered by particles, flow rate (1.5 L min−1) and spot size (Virkkula et al., 2011). Following the methodology from
sev-20
eral previous works (Bond et al., 1999; Virkkula et al., 2011), the raw PSAP data were processed to estimate theσapby incorporating the flow and spot size calibrations. The additional biases are due to the scattering and multi-sample loading on the filter, in-strument noise (∼6 % of total absorption, Bond et al., 2001) and uncertainty in the PSAP measurements (1–4 M m−1 for the 1 min averaged data samples, Manoharan
25
et al., 2014). The total uncertainty of the PSAP measurements after the transmission and scattering correction is∼20–30 % (Bond et al., 1999).
ACPD
14, 21101–21148, 2014Scattering and absorption properties
of near-surface aerosol
U. C. Dumka et al.
Title Page
Abstract Introduction
Conclusions References
Tables Figures
◭ ◮
◭ ◮
Back Close
Full Screen / Esc
Printer-friendly Version Interactive Discussion
Discussion
P
a
per
|
Discus
sion
P
a
per
|
Discussion
P
a
per
|
Discussion
P
a
per
|
measured with an integrating Nephelometer (Model 3563, TSI). The Nephelometer operated at a relative humidity (RH) below 40 % to minimize the effects of changing RH on measurements, while a second Nephelometer was also connected to a humid-ity scanning system to provide measurements ofσsp and σbsp as a function of RH for
studying the light scattering enhancement factor (work under preparation). The angular
5
non-idealities (i.e. truncation error) and non-Lambertian light source were corrected fol-lowing the methodology described by Anderson and Ogren (1998) and details given in Dumka and Kaskaoutis (2014 and references therein). These corrections are needed to subtract the light scattering by air molecules, the instrument walls and the detec-tor background noise. The averaging time was set to 1 min, and the Nephelometer
10
was calibrated using CO2as high span gas and air as low span gas. On an average, the calibration constant is within±2 % and the overall uncertainty in theσsp is ∼7 %
(Heintzenberg et al., 2006).
The aerosol coefficientsσap,σbspandσspmeasured directly by the AOS are referred to as “extensive properties”, because they are mainly pertain to the amount of aerosols
15
in the atmosphere. These measurements were used to determine several other aerosol parameters (known as “intensive properties”), such as hemispheric backscatter fraction (b), up-scatter fraction (β), scattering Ångström exponent (SAE), absorption Ångström exponent (AAE), single scattering albedo (SSA, ω), asymmetry parameter (g), sub-micron scattering (Rsp) and absorption (Rap) fractions, which are involved in the
ra-20
ACPD
14, 21101–21148, 2014Scattering and absorption properties
of near-surface aerosol
U. C. Dumka et al.
Title Page
Abstract Introduction
Conclusions References
Tables Figures
◭ ◮
◭ ◮
Back Close
Full Screen / Esc
Printer-friendly Version Interactive Discussion
Discussion
P
a
per
|
Discus
sion
P
a
per
|
Discussion
P
a
per
|
Discussion
P
a
per
|
3 Results and discussion
3.1 Variations in meteorological parameters
In terms of weather conditions and climatology, the observational site is character-ized by four different seasons: winter (December-January-February; DJF), spring/pre-monsoon (March-April-May; MAM), summer/spring/pre-monsoon (June-July-August-September;
5
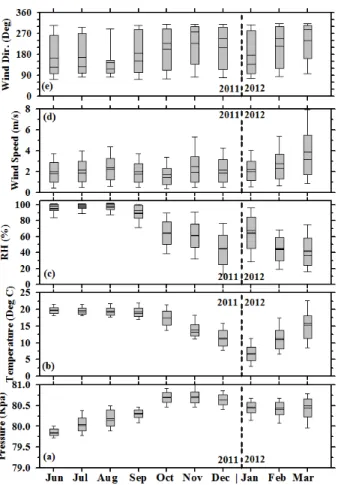
JJAS) and autumn/post-monsoon (October–November; ON), respectively. During the study period (June 2011 to March 2012), the ambient pressure, temperature (Temp), relative humidity (RH), wind speed (WS) and wind direction (WD) were continuously monitored using the surface meteorological instrumentation (MET) data from the ARM AMF facility.
10
The ambient atmospheric pressure varies between 79 and 81 Kpa, gradually increas-ing from monsoon to winter and then, slightly decreasincreas-ing towards sprincreas-ing (Fig. 1a). The monthly-mean temperature remains nearly steady (∼20◦C) between June and
September, with a gradual decrease thereafter to a minimum value of∼7◦C in
Jan-uary (Fig. 1b). The RH is greater than 90 % during summer monsoon and decreases
15
to about 60 to 40 % during the remaining period, also exhibiting larger fluctuation due to changing weather conditions involving arrival of humid or dry air masses (Fig. 1c). In general, the wind speed (Fig. 1d) varies between 2 and 6 m s−1 with an average
of∼2 m s−1 for most of the time. Westerly-to-northwesterly winds (Fig. 1e) dominate
during October–March period, carrying aerosols and pollutants from western IGP and
20
ACPD
14, 21101–21148, 2014Scattering and absorption properties
of near-surface aerosol
U. C. Dumka et al.
Title Page
Abstract Introduction
Conclusions References
Tables Figures
◭ ◮
◭ ◮
Back Close
Full Screen / Esc
Printer-friendly Version Interactive Discussion
Discussion
P
a
per
|
Discus
sion
P
a
per
|
Discussion
P
a
per
|
Discussion
P
a
per
|
3.2 Temporal evolution of near-surface aerosol properties
This section analyzes the temporal evolution of near-surface aerosol properties at Nainital and discusses them as a function of wavelength, particle size and prevailing atmospheric and meteorological conditions.
3.2.1 Extensive properties
5
The mean values (averaged during the entire study period) of spectralσsp,σbspandσap
forD1 µmandD10 µm are shown in Fig. 2a–c. All the examined parameters show a slight decreasing trend with wavelength, but the largest differences are seen as a function of the particle size, sinceD10 µm particles exhibit higher scattering, backscattering and absorption as well. On the other hand, the range of all parameters is much larger for
10
D10 µm particles since their size distribution is much more expanded, suggesting larger
variation in source regions, mixing processes and optical properties. Although such a behavior is expected for the scattering and backscattering processes via the Mie the-ory (the larger particles are more efficient scatters especially at longer wavelengths), the higher absorption by the larger particles is an important finding that merits further
15
investigation. In this respect, Manoharan et al. (2014) reported a 30 % greater ab-sorption forD10 µmcompared toD1 µmduring October–November 2011 (GVAX results),
which was found to be the largest difference, since the two particle-size groups exhibit similar absorption efficiency (7.63±5.32 and 6.38±3.91 forD10 µm andD1 µm,
respec-tively) during monsoon. The post-monsoon season coincides with the post-harvest
20
agricultural biomass burning period in Punjab, northwestern India (Kaskaoutis et al., 2014), implying that these absorbing aerosols can be also of larger size via mixing processes in the atmosphere (gas-to-particle conversion, coagulation, condensation, ageing) during their transportation up to Nainital. These aerosols are mostly emitted over IGP, whereas the local freshly-emitted aerosols at Nainital (mostly in the D1 µm
25
ACPD
14, 21101–21148, 2014Scattering and absorption properties
of near-surface aerosol
U. C. Dumka et al.
Title Page
Abstract Introduction
Conclusions References
Tables Figures
◭ ◮
◭ ◮
Back Close
Full Screen / Esc
Printer-friendly Version Interactive Discussion
Discussion
P
a
per
|
Discus
sion
P
a
per
|
Discussion
P
a
per
|
Discussion
P
a
per
|
that the difference in absorption efficiency betweenD10 µm and D1 µm was found to be
larger for higher aerosol loading. On the other hand, the scattering is much larger (∼40 %) for theD10 µm, especially at longer wavelengths, while theσbsp exhibits rather
neutral wavelength dependence.
The differences in the three parameters, namely,σsp,σbspandσapas a function of the
5
particle size are examined via the frequency distribution histograms (Fig. 3a–c). A large difference between the two size groups is seen in the distribution of the σsp values, whereas the frequency distributions for σbsp and σap are similar for both size groups with larger frequency at higher (lower) values for theD10 µm (D1 µm). The averageσsp
andσapduring the whole study period were found to be 177.2 and 10.9 M m−1,
respec-10
tively, for theD10 µm and 104.4 and 8.95 M m−1 for theD1 µm, with significant seasonal variation, which is examined in the following. The mean value ofσspis similar to earlier observations over the site (Pant et al., 2006; Beegum et al., 2009). Theσspvalues over central Indian Himalayas (present study and Hyvärinen et al., 2009) are comparable to those found over central India during February 2004 (Jayaraman et al., 2006), but are
15
much lower than those (250–2000 M m−1) reported at polluted Indian megacities, like Delhi (Ganguly et al., 2006). Lower values ofσsp (97±9.2) M m−1 and higher of σbsp
(14±0.93 M m−1) at 550 nm compared to Nainital were found at Anantapur in
south-ern India during the period January–December 2011 (Gopal et al., 2014), suggesting dominance of different aerosol types. σsp value of 75.2±41.7 M m−1 at 550 nm was
20
reported by Andreae et al. (2002) at Sde Boker, Israel, which was typical of moderate-polluted continental air masses, while values of 26 and 410 M m−1were found for clean and heavy-smog days, respectively, in Los Angeles (Seinfeld and Pandis, 1998). Ta-ble 2 summarizes the extensive and intensive aerosol properties over Nainital during the GVAX campaign along with those measured over mountainous sites.
ACPD
14, 21101–21148, 2014Scattering and absorption properties
of near-surface aerosol
U. C. Dumka et al.
Title Page
Abstract Introduction
Conclusions References
Tables Figures
◭ ◮
◭ ◮
Back Close
Full Screen / Esc
Printer-friendly Version Interactive Discussion
Discussion
P
a
per
|
Discus
sion
P
a
per
|
Discussion
P
a
per
|
Discussion
P
a
per
|
3.2.2 Intensive properties
The monthly values of SAE and AAE determined at three spectral bands are shown in Figs. 4 and 5, respectively, for bothD1 µm andD10 µm size groups. Starting from the SAE (Fig. 4), a similar temporal variation is revealed for both size groups, but with much larger values for theD1 µm (mean of 1.21±0.35 at 0.45–0.70 µm) compared to
5
D10 µm (mean of 0.72±0.42 at 0.45–0.70 µm). Their between ratio is nearly constant to
1.68 suggesting thatD10 µm particles possess higher scattering at longer wavelengths
leading to a more neutral spectrum (Manoharan et al., 2014). Except this, the SAE val-ues are higher at the shorter wavelength bands, suggesting higher decreasing rate of the scattering process at shorter wavelengths, which is expected according to the Mie
10
theory. Thus, despite the fact thatD1 µmandD10 µm particles exhibit similar annual pat-tern either for scattering or for absorption, the values and the wavelength dependence may be quite different. This indicates that although the seasonal variation in aerosol properties may be similar, mostly attributed to changes in weather conditions and as-sociated air masses, the composition of the super-micron and sub-micron aerosols
15
may alter significantly their optical properties and wavelength dependence, even if the initial source remains the same.
The monthly variability depends on the dominant aerosol type, the contribution of local and transported aerosols, the prevailing meteorological conditions and the mix-ing processes in the atmosphere. The maximum monthly-mean SAE is observed in
20
August (1.11±0.31 and 1.53±0.26 forD10 µm andD1 µm, respectively) and, in general,
the wavelength dependence of scattering seems to be higher during monsoon. On the other hand, the minimum values are shown in October and November, when the site is under significant influence of the smoke-laden air masses from northwestern India, and both scattering and absorption are at their highest levels (Manoharan et al.,
25
ACPD
14, 21101–21148, 2014Scattering and absorption properties
of near-surface aerosol
U. C. Dumka et al.
Title Page
Abstract Introduction
Conclusions References
Tables Figures
◭ ◮
◭ ◮
Back Close
Full Screen / Esc
Printer-friendly Version Interactive Discussion
Discussion
P
a
per
|
Discus
sion
P
a
per
|
Discussion
P
a
per
|
Discussion
P
a
per
|
and winter seasons due to the dominance of anthropogenic aerosols and biomass burning, and much lower AE values during pre-monsoon and monsoon due to influ-ence of dust. Thus, the current findings seem to deviate from these results, suggesting different characteristics and types of aerosols between surface and vertical. In this respect, Hyvärinen et al. (2009) found lowest values of Aitken-to-Accumulation mode
5
ratio during the pre- and post-monsoon seasons over central Indian Himalayas indicat-ing largest influence of LRT, which was also justified by the highest particle number concentrations (as in the present study). In contrast, during the monsoon season, the Aitken-to-Accumulation ratio was higher due to more efficient removal of accumulation mode by the rain-washout process, implying that the aerosols are less aged and mostly
10
freshly emitted. This explains the larger wavelength dependence of scattering and the highest SAE values during July–September. The lowest SAE in November is an indi-cator of the abundance of aged aerosols over the site. Furthermore, the local primary emissions are mostly at the Aitken size, thus contributing to the much larger SAE for theD1 µmparticles, and to the general increase in SAE during winter due to the
influ-15
ence of bio-fuel burning. Similar values of SAE but with different annual pattern were found in Anantapur, south India with maximum (1.5±0.09) in January and minimum
(0.7±0.07) in September (Gopal et al., 2014) indicating significant difference in source apportionment, influence of local emissions and seasonal meteorological conditions between the GH region and the southern peninsula.
20
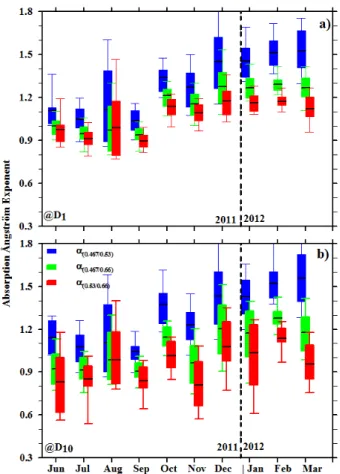
The monthly variation of the AAE at the three wavelength bands exhibits similar pat-tern for both size groups with larger values at shorter wavelengths (Fig. 5). However, the wavelength dependence of the AAE strongly differentiates as a function of season and particle size. It is higher forD10 µm particles and increases from monsoon to win-ter and pre-monsoon (for both particle groups), suggesting differences in the source
25
ACPD
14, 21101–21148, 2014Scattering and absorption properties
of near-surface aerosol
U. C. Dumka et al.
Title Page
Abstract Introduction
Conclusions References
Tables Figures
◭ ◮
◭ ◮
Back Close
Full Screen / Esc
Printer-friendly Version Interactive Discussion
Discussion
P
a
per
|
Discus
sion
P
a
per
|
Discussion
P
a
per
|
Discussion
P
a
per
|
a fingerprint of the larger contribution from dust particles either locally emitted or long-range transported. The AAE for theD1 µmis found to be larger (mean of 1.14±0.18 at 0.47–0.60 µm) than that ofD10 µm (mean of 1.07±0.20 at 0.47–0.60 µm), with a
maxi-mum during December–March (∼1.3) and minimum during monsoon (∼1.0).
Manoha-ran et al. (2014) found that the absorption spectrum was much less wavelength
de-5
pendent forD10 µm particles during October–November, suggesting either a reduction in absorption at 0.47 µm with respect to 0.66 and/or enhanced absorption at 0.66 µm resulting in less difference between 0.47 and 0.66 µm. This indicates that a signifi-cant amount of theD10 µm particles contributes to the ambient aerosols that cause an increase in absorption. The AAEs forD1 µmand D10 µm have shown a correlation
coef-10
ficient of∼0.9 and most of the data points lie close to the 1-1 line (Manoharan et al.,
2014), suggesting rather consistency in the sources, at least for the absorption capabil-ity. The increase in both absorption and scattering coefficients during the last week of October and November due to enhanced biomass burning activity over northwestern India is associated with a weaker wavelength dependence of both scattering (Fig. 4)
15
and absorption (Fig. 5), especially for D10 µm particles, suggesting an abundance of super-micron aerosols that absorb in the whole spectrum (Manoharan et al., 2014).
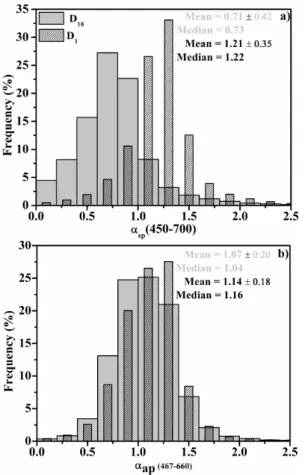
The frequency distribution of the SAE and AAE for both D1 µmand D10 µm is shown in Fig. 6 along with the mean and median values. The SAE provides information about the average size distribution of the particles. In this respect, the percentage occurrence
20
could be roughly grouped into two categories i.e., SAE<1 (coarse-mode aerosols) and SAE>1 (fine-mode aerosols). The SAE follows an anti-correlation with the coarse-to-fine mode ratio exhibiting much higher values for sub-micron aerosols especially at shorter wavelengths (Andreae et al., 2002). The frequency distribution of SAE clearly differentiates the D1 µm and D10 µm particles, which exhibit means of 1.21±0.35 and
25
0.71±0.42, respectively. This indicates the large sensitivity of scattering on the
par-ticle size that can be used as a measure for the aerosol-type identification. On the other hand, the wide range (∼0.1–2.4) of SAE values for both particle groups suggests
ACPD
14, 21101–21148, 2014Scattering and absorption properties
of near-surface aerosol
U. C. Dumka et al.
Title Page
Abstract Introduction
Conclusions References
Tables Figures
◭ ◮
◭ ◮
Back Close
Full Screen / Esc
Printer-friendly Version Interactive Discussion
Discussion
P
a
per
|
Discus
sion
P
a
per
|
Discussion
P
a
per
|
Discussion
P
a
per
|
shown in Fig. 4. The average value of SAE at 0.45–0.7 µm was found to be 1.02±0.3
at Anantapur (Gopal et al., 2014), which is well within the average values forD1 µmand
D10 µm at Nainital.
In contrast to the SAE, the frequency distribution of the AAE shows a more compli-cated pattern withD1 µmand D10 µm values to strongly overlap. However,D1 µm shows
5
higher values (1.14±0.18), suggesting larger wavelength dependence of the
absorp-tion. Similar to Nainital, the frequency distribution of AAE at Kanpur (Giles et al., 2012) showed significant overlap among different aerosol types, suggesting large difficulty in their discrimination based only on absorption properties. A wide range (from 0.16–2.16) in AAE values was also found by Andreae et al. (2002), with a mean of 1.43±0.41,
in-10
dicative of very contrasting air masses and aerosol absorption efficiencies in arid Israel. Monthly-mean AAE values in the range of 1.0–1.6 are reported for Mukteshwar, near to Nainital (Hyvärinen et al., 2009), exhibiting larger values during winter as also observed in the present study (Fig. 5).
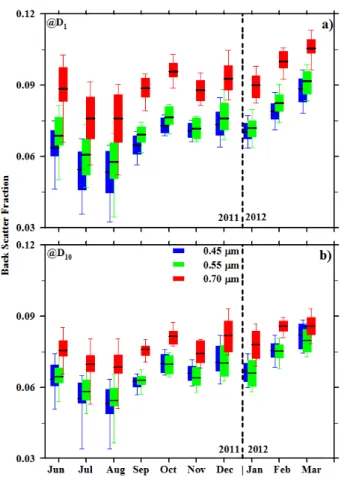
The monthly evolution of the spectral backscatter fraction (b) is shown in Fig. 7 for
15
both particle sizes. The results show that the b is strongly wavelength dependent, with larger values at longer wavelengths (opposite to that found forσspand σap, SAE and AAE). The larger SAE that was found in monsoon (Fig. 4) indicates particles of smaller size, which is expected to produce more isentropic scattering leading to smaller
bvalues. During post-monsoon and winter, the bincreases (except a small decrease
20
in November) reaching its highest value in March suggesting more irregular type of scattering and favoring of backscatter, which is characteristic of the dust particles (Liu et al., 2008). Thebis larger at longer wavelengths, especially for the D1 µmparticles,
since the backscatter wavelength dependence is lower than that of total scattering (Fig. 2) and, therefore, the backscatter-to-total scattering ratio (b) is more enhanced at
25
longer wavelengths.
A slight higherb values are found for the sub-micron particles over Nainital at 0.45 and 0.55 µm, which become significantly higher at 0.7 µm compared to those ofD10 µm
ACPD
14, 21101–21148, 2014Scattering and absorption properties
of near-surface aerosol
U. C. Dumka et al.
Title Page
Abstract Introduction
Conclusions References
Tables Figures
◭ ◮
◭ ◮
Back Close
Full Screen / Esc
Printer-friendly Version Interactive Discussion
Discussion
P
a
per
|
Discus
sion
P
a
per
|
Discussion
P
a
per
|
Discussion
P
a
per
|
asymmetry parameter and smallerb) than the smaller particles. On average, theb val-ues at 0.55 µm were found to be 0.067±0.009 forD10 µm and 0.073±0.012 forD1 µm, which are much lower than those (0.13±0.09) reported at Anantapur (Gopal et al.,
2014), suggesting presence of more aged aerosols and of larger size over Nainital. Backscatter ratio value of 0.13 was reported at the Negev desert, Israel under
conti-5
nental pollution conditions (Formenti et al., 2001; Andreae et al., 2002), while similar values (0.14±0.02) were found for polluted air masses in the northwestern and
east-ern United States (Anderson et al., 1999; Sheridan and Ogren, 1999). Thebat 0.55 µm lies in the range 0.034–0.089 (0.027–0.100) with higher values in March 0.080±0.005
(0.092±0.006) and lower in August 0.054±0.010 (0.058±0.012), where the values
10
inside parentheses represent theD1 µm. Previous studies (Carrico et al., 2003; Doherty et al., 2005) have shown that the b values are higher for dust and particles emitted from forest fires than other types of aerosol, while they may be also sensitive to com-position (organic content and particle size distribution) of aerosol (Twardowski et al., 2001; Boss et al., 2004).
15
Figure 8 shows the temporal evolution of theσsp andσap for the sub-micron (D1 µm) particles as fraction of the respective efficiencies ofD10 µm(i.e.D1 µm/D10 µm). Both frac-tions are below 1, especially for the scattering as was seen in Figs. 2 and 3, suggesting that the particles larger than 1 µm are responsible for the largest fractions of scattering and absorption. The decreasing trend with the wavelength for the sub-micron scattering
20
fraction implies more wavelength sensitivity compared toD10 µm, whereas it becomes rather neutral for the absorption, suggesting that the spectral absorption is similar for bothD1 µm andD10 µm. The sub-micron absorption fraction is higher than that of scat-tering suggesting that the single scatscat-tering albedo would be higher forD1 µm. Indeed, in a previous study (Dumka and Kaskaoutis, 2014) we found higher (0.93) SSA forD1 µm
25
compared to that ofD10 µm(0.91). The high (>0.9) SSA values are attributed to the rel-atively high (7.7±3.4) values of the OC/EC ratio over Nainital suggesting dominance
ACPD
14, 21101–21148, 2014Scattering and absorption properties
of near-surface aerosol
U. C. Dumka et al.
Title Page
Abstract Introduction
Conclusions References
Tables Figures
◭ ◮
◭ ◮
Back Close
Full Screen / Esc
Printer-friendly Version Interactive Discussion
Discussion
P
a
per
|
Discus
sion
P
a
per
|
Discussion
P
a
per
|
Discussion
P
a
per
|
Both absorption and scattering sub-micron fractions exhibit a similar pattern with higher values during July–August, which are decreasing in the post-monsoon, increase again in December–January and decrease in March. The larger SAE in monsoon (Fig. 4) implies abundance of fine aerosols (large Aitken-to-Accumulation ratio, Hyväri-nen et al., 2009) leading to enhanced sub-micron scattering. The concurrent high
val-5
ues of sub-micron absorption fraction in July–August suggest that eitherD1 µmparticles are more absorbing than the rest of the year orD10 µmwould be less absorbing in mon-soon. Sub-micron scattering and absorption are sensitive to the local anthropogenic emissions (at the Aitken size) during the monsoon and winter months, thus exhibiting higher fractions compared to the rest of the period. Except of the particle size and
10
shape that mostly define the scattering processes, the aerosol chemical composition plays a vital role in the absorption efficiency. The carbonaceous aerosols were found to contribute about 25 % of the total aerosol mass in Nainital (Ram et al., 2010), while the WSOC/OC (water soluble organic carbon / organic carbon) ratio (0.55±0.15)
was found to be larger than that over the IGP locations, suggesting enhanced
con-15
tribution from secondary organic aerosols (mostly in the Aitken size). Concerning the coarse-mode particles, except of the LRT dust from the arid and semi-arid regions in southwestern Asia, dust particles may originate from local wind-blown dust, dust re-suspension due to road traffic or dust from farming activity over the GH region (Raatikainen et al., 2014).
20
3.3 Diurnal cycle of aerosol properties
The monthly-mean diurnal evolutions ofσsp,σap, SAE and AAE are shown in Fig. 9a– d, respectively, for bothD1 µm and D10 µm. Theσsp and σap exhibit similar diurnal and seasonal patterns, with post-monsoon to winter (and March) highs and monsoon lows. Both maxima are observed in November due to significant influence of transported
25
ACPD
14, 21101–21148, 2014Scattering and absorption properties
of near-surface aerosol
U. C. Dumka et al.
Title Page
Abstract Introduction
Conclusions References
Tables Figures
◭ ◮
◭ ◮
Back Close
Full Screen / Esc
Printer-friendly Version Interactive Discussion
Discussion
P
a
per
|
Discus
sion
P
a
per
|
Discussion
P
a
per
|
Discussion
P
a
per
|
1 µm during periods of high aerosol loading. Aerosol scattering and absorption over Nainital is dominated by the concurrent contribution of soil or desert dust in the coarse fraction, and the anthropogenic sulfate and carbonaceous aerosols in the fine fraction. The factor that seems to contribute to the increase inσsp and σap during noon to
af-ternoon hours, is the slope up-stream of the polluted air masses coming from the IGP
5
after deepening (>2.5–3 km) of the PBL over the Ganges valley. Local-scale daily wind patterns, like valley wind cells, may also influence the diurnal patterns of spectralσsp
and σap; upslope winds are expected to increase the aerosol loading over the site, while downslope winds result in atmospheric cleansing. Furthermore, synoptic-scale transport and changing air-mass origin affect the aerosol loading over the Himalayan
10
sites (Xu et al., 2014; Bucci et al., 2014). The annual variation of the σap seems to follow that of the BC mass fraction, which was found to be∼1 % during monsoon and
7.6 % during winter (Ram et al., 2010), associated with variation inσap (at 0.678 µm) from 0.9 to 33.9 M m−1. However, no significant difference in σap and σsp was found between weekdays and weekends in contrast to Indian cities where a 7.8 % reduction
15
inσspwas reported in weekends (Gopal et al., 2014).
Similar annual variation ofσspwas found at Mukteshwar, close to Nainital, with July– August lows (25–36 M m−1) and February (94 Mm−1) and April–June highs
(Hyväri-nen et al., 2009). They also reported lower winter (December–January) values mostly because the IGP pollution layer was trapped below the site altitude, as well as
sev-20
eral peaks in post-monsoon due to influence of smoke plumes from agricultural crop-residue burning in northwestern India. A marked annual cycle with higher values dur-ing March–June and October–November was observed for the σap over Mukteshwar (Hyvärinen et al., 2009), while the lowest values were observed during monsoon and December–January, similar to the present study. Afternoon-to-evening peaks inσspand
25
ACPD
14, 21101–21148, 2014Scattering and absorption properties
of near-surface aerosol
U. C. Dumka et al.
Title Page
Abstract Introduction
Conclusions References
Tables Figures
◭ ◮
◭ ◮
Back Close
Full Screen / Esc
Printer-friendly Version Interactive Discussion
Discussion
P
a
per
|
Discus
sion
P
a
per
|
Discussion
P
a
per
|
Discussion
P
a
per
|
The seasonal pattern of SAE reveals larger values during monsoon, which can be ex-plained by the rain washout of the coarser aerosols, and a secondary increase during December–January mostly associated with local emissions from biofuel combustion (morning and evening maxima). The diurnal variation observed in December–January is smoothed during the rest of the year for both particle groups. In contrast to SAE, the
5
diurnal pattern of AAE exhibits significant variability during October–March, indicating dominance of different aerosol types and mixing processes. Higher AAE values (>1.3– 1.4) are observed during night-to-early morning hours in the winter season, while dur-ing noontime the AAE goes down to 1–1.2. Peaks in AAE durdur-ing the morndur-ing and evening hours were also found over Mukteshwar (Hyvärinen et al., 2009) suggesting
10
influence of local biomass burning i.e. burning of leaves and wood for heating, which were not so obvious in the diurnal patterns ofσspandσap(Fig. 9a and b) because they are mostly affected by the LRT from IGP. The diurnal pattern of AAE reveals the influ-ence of different aerosol sources and combustion processes, i.e. local emissions from biofuel burning in the early morning and evening (high values of AAE) and transport of
15
mostly aged aerosols from fossil-fuel combustion in IGP during noon to early afternoon (low values of AAE) (Bergstrom et al., 2007). In contrast, any diurnal pattern flattens out during monsoon, when the low AAE values (below 1) are associated with lowest
σap.
Raatikainen et al. (2014) noted that the air masses up to Himalayan sites in winter
20
travel at higher altitudes than the maximum BLH (∼1–1.5 km) over the IGP, thus not being able to carry significant amount of aerosol and pollutants. Such pollution trans-portation is very much favored during pre-monsoon when the BLH is at its maximum (>3–3.5 km) and the dilution of aerosols in the vertical favors their uplift to Himalayan foothills. As a consequence, the role of the IGP to the aerosol concentrations over the
25
ACPD
14, 21101–21148, 2014Scattering and absorption properties
of near-surface aerosol
U. C. Dumka et al.
Title Page
Abstract Introduction
Conclusions References
Tables Figures
◭ ◮
◭ ◮
Back Close
Full Screen / Esc
Printer-friendly Version Interactive Discussion
Discussion
P
a
per
|
Discus
sion
P
a
per
|
Discussion
P
a
per
|
Discussion
P
a
per
|
3.4 The role of wind and LRT in aerosol properties
The seasonal variation in the aerosol composition and optical properties over Nainital is a function of the emission sources, meteorological conditions (rainfall, wind pattern) and LRT. In this respect, theσsp, σap, SAE and AAE are examined against the wind
speed and direction (Fig. 10). In general, the results show that the west/southwest flow
5
enhances the scattering and absorption coefficients, while the northern (coming from Tibetan Plateau) and east air masses are usually clean. The air masses from south-east direction are mostly associated with the monsoonal flow, higher rainfall and lower aerosol concentrations; however, it was found that the concentrations from this sector are similar to southwest during the other seasons. Similar findings (lower values for
10
both scattering and absorption associated with east/southeast directions) were found at Mukteshwar (Hyvarinen et al., 2009), while the highest values were found for west-ern and southwestwest-ern sectors. The maximumσspandσapvalues are mostly associated
with moderate winds (4–6 ms−1), supporting the higher contribution of the transported aerosols at the observational site. In contrast, the accumulation of pollutants over the
15
urban areas is favored by calm winds resulting in larger values of theσsp(almost dou-ble for wind speed<0.5 m s−1compared to wind speed>3 m s−1) at Anantapur (Gopal
et al., 2014).
The valley-breeze circulation was found to have a strong impact on the aerosol com-position even at the high-altitude (5079 m) Nepal Climate Observatory – Pyramid site
20
in the Everest area (Decesari et al., 2010) and, therefore, can be considered as the major mechanism for the aerosol transport from the polluted IGP up to Himalayas. This was further supported by chemical analysis of the WIOC/EC ratios between Nainital and IGP (Ram and Sarin, 2010), which showed great similarities and aerosol of similar sources. The east flow carries smaller particles with SAE greater than 1.2, which can
25
ACPD
14, 21101–21148, 2014Scattering and absorption properties
of near-surface aerosol
U. C. Dumka et al.
Title Page
Abstract Introduction
Conclusions References
Tables Figures
◭ ◮
◭ ◮
Back Close
Full Screen / Esc
Printer-friendly Version Interactive Discussion
Discussion
P
a
per
|
Discus
sion
P
a
per
|
Discussion
P
a
per
|
Discussion
P
a
per
|
emissions as discussed in Fig. 9. Combination of the results (Figs. 4, 5, 9, and 10) establishes that the influence of the source region and LRT play the major role in the aerosol field and evolution over Nainital in all seasons except monsoon, when the rain washout is the main process.
The BLH over the site was found to exhibit a significant diurnal variation (not
pre-5
sented) ranging from lower than 100 m during cold nights to up to 2 km during noontime in March. The BLH estimated via radio-sonde measurements at Nainital during GVAX (4 profiles per day, around 05:30, 11:30, 17:30 and 23:30 LST) was found to range from
∼1150 m, on average, during monsoon and post-monsoon to∼1550 m during March.
Therefore, the BLD play a crucial role in aerosol properties on daily (majorly) and
sea-10
sonal basis. For longer time intervals (e.g. month, season), the changing air masses carrying aerosols of different origin and characteristics is the main factor influencing the aerosol field.
3.5 Relationship among aerosol parameters
Correlation between different aerosol properties is able to reveal specific characteristics
15
and modification processes in the aerosol field at the observational site. The scatter plot ofσsp vs.σap for the two size groups (Fig. 11) shows a strong correlation suggesting covariance in the scattering and absorption properties, which is stronger for theD10 µm
(larger slope value), since the scattering effect enhances for the coarse particles. The scatter plot also reveals higher absorption capability for the large particles, which is well
20
documented in the work by Manoharan et al. (2014). For a certain absorption value, the scattering of D10 µm particles seems to be larger than that of D1 µm for σsp values above 200 M m−1indicating that for clean atmospheres the discrimination of the optical
properties between coarse and sub-micron aerosols is really difficult.
Correlation of properties related to aerosol loading with those related to particle size
25
ACPD
14, 21101–21148, 2014Scattering and absorption properties
of near-surface aerosol
U. C. Dumka et al.
Title Page
Abstract Introduction
Conclusions References
Tables Figures
◭ ◮
◭ ◮
Back Close
Full Screen / Esc
Printer-friendly Version Interactive Discussion
Discussion
P
a
per
|
Discus
sion
P
a
per
|
Discussion
P
a
per
|
Discussion
P
a
per
|
respectively, for both particle sizes revealing a general decrease in SAE with increasing
σsp. This suggests an increase in size and ageing processes in aerosols (condensa-tion, coagulation) under more turbid atmospheres (Sinha et al., 2012). The respec-tive scatter plots for absorption result in similar findings, but the large scatter in data points does not allow the extraction of safe conclusions about the dominant aerosol,
5
suggesting a rather mixing during the whole campaign period. Changing in chemical composition and humidity impacts may also influence the intensive and extensive prop-erties of aerosols. Such variations usually occur in south Asia and along with alteration in meteorology strongly influence the aerosol concentration and properties (Léon and Legrand, 2003).
10
Many studies (Eck et al., 2010; Russell et al., 2010; Giles et al., 2012; Vijayaku-mar et al., 2012; VijayakuVijayaku-mar and Devara, 2014) have suggested the use of correla-tions between the aerosol absorption and scattering properties for the determination of different aerosol types. In such an approach, we correlate the SAE with AAE for the whole set of measurements at Nainital for bothD1 µmand D10 µm groups (Fig. 13).
15
Such a graph is able to reveal the existence of different aerosol types, since the wave-length dependence of scattering and absorption differentiates for the various types. As far as the scattering is concerned, the fine-mode aerosols (biomass burning, soot, urban/industrial emissions) exhibit higher values, while sea-salt and desert dust show lower values of SAE. The AAE is commonly used for aerosol characterization with
val-20
ues around 1 to correspond to vehicle exhausts or fossil fuel combustions, whereas the AAE values in excess of biomass burning or dust aerosol are around 2 or even more (Kirchstetter et al., 2004; Bergstrom et al., 2007). Using AERONET retrievals, Russell et al. (2010) found AAE values varying between 1.2 and 3.0 for dust, 0.75 and 1.3 for urban/industrial, and 1.2 and 2.0 for biomass burning. The range of these
val-25
ACPD
14, 21101–21148, 2014Scattering and absorption properties
of near-surface aerosol
U. C. Dumka et al.
Title Page
Abstract Introduction
Conclusions References
Tables Figures
◭ ◮
◭ ◮
Back Close
Full Screen / Esc
Printer-friendly Version Interactive Discussion
Discussion
P
a
per
|
Discus
sion
P
a
per
|
Discussion
P
a
per
|
Discussion
P
a
per
|
The SAE and AAE are somewhat homogeneously distributed around the mean values of SAE (0.9–1.1) and AAE (1–1.2), while few cases present large values of SAE asso-ciated with AAE of 1.0–1.5 revealing the presence of carbonaceous aerosols of mixed fossil and biofuel combustions.
4 Conclusions
5
A comprehensive analysis of several extensive and intensive properties (total scatter-ing, backscatterscatter-ing, light absorption and their wavelength dependence) of near-surface aerosols was performed in the current study, aiming to investigate the temporal evo-lutions, variety of aerosol types and influence of transported plumes. The measure-ments via AMF were made in the framework of GVAX campaign during June 2011–
10
March 2012 at Nainital, located in the foothills of central Indian Himalayas. More specif-ically, the light scattering and absorption measurements, using three wavelengths inte-grated Nephelometer and PSAP, were analyzed along with meteorological parameters at the experimental site. The main findings of the study are summarized as follows:
1. the meteorological field exhibited a seasonal-changing pattern, which along with
15
the boundary layer dynamics and the upslope valley winds control the temporal evolution and the aerosol characteristics at Nainital. The surface wind showed a clear dominance of the northwest (winter and pre-monsoon) and southeast (summer monsoon) directions.
2. The scattering coefficient showed higher values during November and March due
20
to the significant influence of biomass-burning aerosols and dust mixed with an-thropogenic pollution, respectively, both uplifting from Ganges valley and north-western India. The absorption coefficient followed a similar pattern, while both parameters exhibited very low values during monsoon due to rain washout pro-cess.
ACPD
14, 21101–21148, 2014Scattering and absorption properties
of near-surface aerosol
U. C. Dumka et al.
Title Page
Abstract Introduction
Conclusions References
Tables Figures
◭ ◮
◭ ◮
Back Close
Full Screen / Esc
Printer-friendly Version Interactive Discussion
Discussion
P
a
per
|
Discus
sion
P
a
per
|
Discussion
P
a
per
|
Discussion
P
a
per
|
3. The wavelength dependence of scattering and absorption, which is defined via the Ångström exponents of scattering (SAE) and absorption (AAE), respectively, exhibited a marked seasonal variation, with monsoon high for SAE and late winter-to-March high for AAE. The higher values of SAE during monsoon may be related to rain washout and the removal of the coarser aerosol particles, while a
sec-5
ondary increase of SAE during winter was associated with local emissions from bio-fuel combustion. The latter seems to have an effect in increasing AAE values during the same period, in association with increased dust occurrence in March.
4. The particle size played a major role in the scattering coefficient and SAE, while its effect was much lesser in absorption processes. Thus, the absorption fraction
10
by the sub-micron particles (<1 µm) was about 0.9 of that of <10 µm particles, while the respective scattering fraction was only 0.6.
5. The diurnal variation of both scattering and absorption coefficients revealed a noon-to-early afternoon maximum, which was clearly defined during October to March, while it was negligible during monsoon. This suggests that the higher
15
aerosol concentrations were mostly attributed to transport of air masses from the Ganges valley and not to local emissions, while the rain washout effect modulates the diurnal cycle. Furthermore, the diurnal patterns of SAE and AAE revealed that the local emissions, mostly observed during early morning and evening hours, increased both parameters during these parts of the day. This suggests that the
20
local emissions, although they did not have a clear signal in scattering and absorp-tion coefficients, showed different characteristics than the transported air masses from the Ganges valley and affect mostly the aerosol intensive properties.
6. The highest values for both scattering and absorption were associated with south-west air flow, suggesting strong influence of transported aerosols from northsouth-west-
northwest-25
ACPD
14, 21101–21148, 2014Scattering and absorption properties
of near-surface aerosol
U. C. Dumka et al.
Title Page
Abstract Introduction
Conclusions References
Tables Figures
◭ ◮
◭ ◮
Back Close
Full Screen / Esc
Printer-friendly Version Interactive Discussion
Discussion
P
a
per
|
Discus
sion
P
a
per
|
Discussion
P
a
per
|
Discussion
P
a
per
|
7. Analysis of the correlations between the aerosol properties showed that a well-mixed aerosol field dominated over the site, whereas a specific aerosol type can be detected only in a few cases. This suggests the influence of well-mixed and aged polluted air masses over the GH region.
In summary, analysis of the aerosol optical properties revealed that Nainital, although
5
its elevated terrain and remoteness from urban and industrialized regions, usually re-ceives substantial amounts of anthropogenic aerosols, in addition to mineral dust and biomass burning, rendering the site moderately polluted (see Table 2). Most of the aerosol is long-range transported from the Ganges valley and southwest Asian regions. This supports the diurnal pattern of the scattering and absorption coefficients that
re-10
vealed higher values during noon-to-early afternoon hours associated with higher mix-ing depth and up-slope of pollutants. Local emissions were found to partly contribute to the aerosol loading and evolution, mostly defined via bio-fuel combustion during the winter season (morning and evening peaks in the AAE).
Acknowledgements. We thank the US Department of Energy for deploying the Atmospheric
15
Radiation Measurements Climate Research Facility. We are grateful to the technical staff of Atmospheric Radiation Measurements for providing valuable data. This study is carried out un-der GVAX project in collaboration among the DoE, IISc, SPL, ISRO and ARIES. We would like to thank the participants (scientists and technical staff) of the campaign for valuable support. Thanks are also due to the Editor and anonymous reviewers for their insightful comments and
20
valuable suggestions, which improved the scientific content and clarity of the paper.
References
Adhikary, B., Carmichael, G. R., Tang, Y., Leung, L. R., Qian, Y., Schauer, J. J., Stone, E. A., Ramanathan, V., and Ramana, M. V.: Characterization of the seasonal cycle of south Asian aerosols: a regional-scale modeling analysis, J. Geophys. Res., 112, D22S22,
25
doi:10.1029/2006JD008143, 2007.
ACPD
14, 21101–21148, 2014Scattering and absorption properties
of near-surface aerosol
U. C. Dumka et al.
Title Page
Abstract Introduction
Conclusions References
Tables Figures
◭ ◮
◭ ◮
Back Close
Full Screen / Esc
Printer-friendly Version Interactive Discussion
Discussion
P
a
per
|
Discus
sion
P
a
per
|
Discussion
P
a
per
|
Discussion
P
a
per
|
Anderson, T. L., Covert, D. S., Wheeler, J. D., Harris, J. M., Perry, K. D., Trost, B. E., Jaffe, D. J., and Ogren, J. A.: Aerosol backscatter fraction and single scattering albedo: measured values and uncertainties at a coastal station in the pacific north west, J. Geophys. Res., 104, 793– 807, 1999.
Andreae, T. W., Andreae, M. O., Ichoku, C., Maenhaut, W., Cafmeyer, J., Karnieli, A., and
5
Orlovsky, L: Light scattering by dust and anthropogenic aerosol at a remote site in the Negev Desert, Israel, J. Geophys. Res., 107, 4008, doi:10.1029/2001JD900252, 2002.
Antón, M., Valenzuela, A., Cazorla, A., Gil, J. E., Fernández-Gálvez, J., Lyamani, H., Foyo-Moreno, I., Olmo, F. J., and Alados-Arboledas, L.: Global and diffuse shortwave irradi-ance during a strong desert dust episode at Granada (Spain), Atmos. Res., 118, 232–239,
10
doi:10.1016/j.atmosres.2012.07.007, 2012.
Beegum, S. N., Moorthy, K. Krishna, Babu, S. S., Satheesh, S. K., Vinoj, V., Badarinath, K. V. S., Safai, P. D., Devara, P. C. S., Singh, S., Vinod, Dumka, U. C., and Pant, P.: Spatial distribution of aerosol black carbon over India during pre-monsoon season, Atmos. Environ., 43, 1071–1078, doi:10.1016/j.atmosenv.2008.11.042, 2009.
15
Bergstrom, R. W., Pilewskie, P., Russell, P. B., Redemann, J., Bond, T. C., Quinn, P. K., and Sierau, B.: Spectral absorption properties of atmospheric aerosols, Atmos. Chem. Phys., 7, 5937–5943, doi:10.5194/acp-7-5937-2007, 2007.
Bollasina, M. and Nigam, S.: Absorbing aerosols and pre-summer monsoon hydroclimate vari-ability over the Indian subcontinent: the challenge in investigating links, Atmos. Res., 94,
20
338–344, doi:10.1016/j.atmosres.2009.06.008, 2009.
Bond, T. C.: Spectral dependence of visible light absorption by carbonaceous particles emitted from coal combustion, Geophys. Res. Lett., 28, 4075–4078, 2001.
Bond, T. C., Anderson, T. L., and Campbell, D.: Calibration and intercomparison of filter-based measurements of visible light absorption by aerosols, Aerosol Sci. Tech., 30, 582–600, 1999.
25
Boss, E., Pegau, W. S., Lee, M., Twardowski, M., Shybanov, E., Korotaev, G., and Baratange, F.: Particulate backscattering ratio at LEO 15 and its use to study particle composition and distribution, J. Geophys. Res., 109, C01014, doi:10.1029/2002JC001514, 2004.
Bucci, S., Cagnazzo, C., Cairo, F., Di Liberto, L., and Fierli, F.: Aerosol variability and atmo-spheric transport in the Himalayan region from CALIOP 2007–2010 observations, Atmos.
30
ACPD
14, 21101–21148, 2014Scattering and absorption properties
of near-surface aerosol
U. C. Dumka et al.
Title Page
Abstract Introduction
Conclusions References
Tables Figures
◭ ◮
◭ ◮
Back Close
Full Screen / Esc
Printer-friendly Version Interactive Discussion
Discussion
P
a
per
|
Discus
sion
P
a
per
|
Discussion
P
a
per
|
Discussion
P
a
per
|
Carrico, C. M., Kus P., Rood M. J., Quinn P. K., and Bates T. S.: Mixtures of pollution, dust, sea salt, and volcanic aerosol during ACE-Asia: radiative properties as a function of relative humidity, J. Geophys. Res., 108, 8650, doi:10.1029/2003JD003405, 2003.
Decesari, S., Facchini, M. C., Carbone, C., Giulianelli, L., Rinaldi, M., Finessi, E., Fuzzi, S., Mari-noni, A., Cristofanelli, P., Duchi, R., Bonasoni, P., Vuillermoz, E., Cozic, J., Jaffrezo, J. L., and
5
Laj, P.: Chemical composition of PM10and PM1at the high-altitude Himalayan station Nepal Climate Observatory-Pyramid (NCO-P) (5079 m a.s.l.), Atmos. Chem. Phys., 10, 4583–4596, doi:10.5194/acp-10-4583-2010, 2010.
Di Girolamo, L., Bond, T. C., Bramer, D., Diner, D. J., Fettinger, F., Kahn, R. A., Martonchik, J. V., Ramana, M. V., Ramanathan, V., and Rasch, P. J.: Analysis of Multi-angle Imaging
Spec-10
troradiometer (MISR) aerosol optical depths over greater India during winter 2001–2004, Geophys. Res. Lett., 31, L23115, doi:10.1029/2004GL021273, 2004.
Dipu, S., Prabha Thara, V., Pandithurai, G., Dudhia, J., Pfister, G., Rajesh, K., and Goswami, B. N.: Impact of elevated aerosol layer on the cloud macrophysical properties prior to monsoon onset, Atmos. Environ., 70, 454–467, 2013.
15
Doherty, S. J., Quinn, P. K., Jefferson, A., Carrico, C. M., Anderson, T. L., and Hegg, D.: A com-parison and summary of aerosol optical properties as observed in situ from aircraft, ship, and land during ACE-Asia, J. Geophys. Res., 110, D04201, doi:10.1029/2004JD004964, 2005. Dumka, U. C. and Kaskaoutis, D. G.: In-situ measurements of aerosol properties and estimates
of radiative forcing efficiency over Gangetic–Himalayan region during the GVAX field
cam-20
paign, Atmos. Environ., 94, 96–105, doi:10.1016/j.atmosenv.2014.05.021, 2014.
Dumka, U. C., Satheesh, S. K., Pant, P., Hegde, P. and Krishna Moorthy, K.: Surface changes in solar irradiance due to aerosols over central Himalayas, Geophys. Res. Lett., 33, L20809, doi:10.1029/2006GL027814, 2006.
Dumka, U. C., Krishna Moorthy, K., Satheesh, S. K., Sagar, R., and Pant, P.: Short-period
mod-25
ulations in aerosol optical depths over the central Himalayas: role of mesoscale processes, J. Appl. Meteorol. Clim., 47, 1467–1475, doi:10.1175/2007JAMC1638.1, 2008.
Dumka, U. C., Krishna Moorthy, K., Kumar, R., Hegde, P., Sagar, R., Pant, P., Singh, N., and Babu, S. S.: Characteristics of aerosol black carbon mass concentration over a high altitude location in the central Himalayas from multi-year measurements, Atmos. Res., 96, 510–521,
30
ISSN 0169–8095, doi:10.1016/j.atmosres.2009.12.010, 2010.