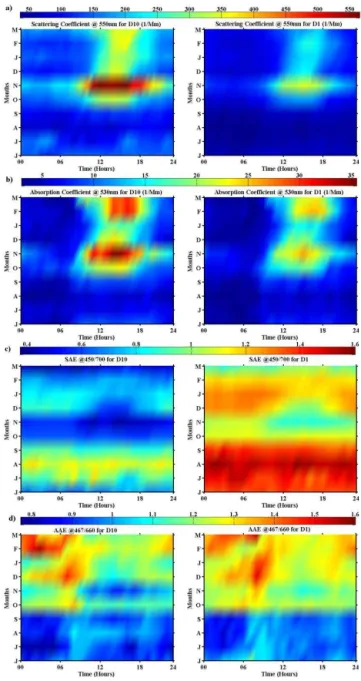
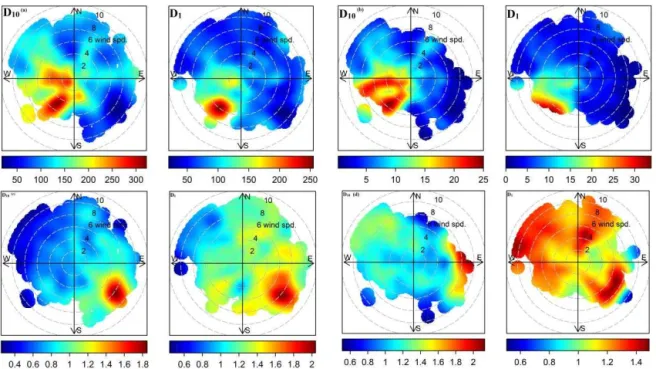
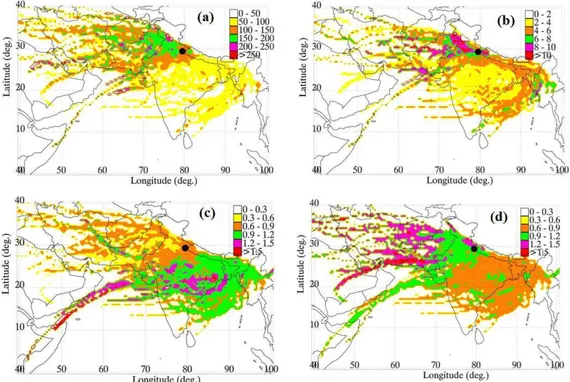
Scattering and absorption properties of near-surface aerosol over Gangetic–Himalayan region: the role of boundary-layer dynamics and long-range transport
Texto
Imagem


Documentos relacionados
α-amylase (1,4-α-D-glucan glucanohydrolase, EC 3.2.1.1) production by thermophilic Bacillus sp strain SMIA-2 cultivated in liquid media containing soluble starch reached a maximum
This paper analyzes the powerful role of px, yq as linker of spatial knowledge, and describes a practice, Geo Linked Data, that transforms the juxtaposition into a formal link
A comparative study of physicochemical properties (specific surface area, morphology analysis, bulk density, moisture absorption) and the medicinal characterization (dracorhodin
We stress, however, that the retrieval algorithm assumes a non-polarising, Lambertian surface and fixed types of aerosol and cloud whose scattering properties are specified, so
It was observed from this table that the average roughness and the average grain size value decreases with increasing the annealing temperature... Atomic
This positive dependence of α on AOD for mostly scattering aerosols in cloudy scenes can be attributed to a combination of the (scattering) aerosol direct effect and the increase
Os imigrantes que vivem há menos tempo em Portugal e em Sesimbra são os que mais frequentemente afirmam que foram discriminados De acordo com a hipótese de similaridade, isso é porque
Temperature and particle number concentration profiles were measured at small height intervals above open and frozen leads and snow surfaces in the central Arctic.. The device used
