ACPD
11, 7781–7809, 2011Branch-level measurement of total
OH reactivity
S. Kim et al.
Title Page
Abstract Introduction
Conclusions References
Tables Figures
◭ ◮
◭ ◮
Back Close
Full Screen / Esc
Printer-friendly Version Interactive Discussion
Discussion
P
a
per
|
Dis
cussion
P
a
per
|
Discussion
P
a
per
|
Discussio
n
P
a
per
|
Atmos. Chem. Phys. Discuss., 11, 7781–7809, 2011 www.atmos-chem-phys-discuss.net/11/7781/2011/ doi:10.5194/acpd-11-7781-2011
© Author(s) 2011. CC Attribution 3.0 License.
Atmospheric Chemistry and Physics Discussions
This discussion paper is/has been under review for the journal Atmospheric Chemistry and Physics (ACP). Please refer to the corresponding final paper in ACP if available.
Branch-level measurement of total OH
reactivity for constraining unknown BVOC
emission during the CABINEX
(Community Atmosphere-Biosphere
INteractions Experiments)-09 Field
Campaign
S. Kim, A. Guenther, T. Karl, and J. Greenberg
ACD/NESL NCAR, P.O. Box 3000, Boulder CO, 80307, USA
Received: 2 March 2011 – Accepted: 3 March 2011 – Published: 7 March 2011
Correspondence to: S. Kim ([email protected])
ACPD
11, 7781–7809, 2011Branch-level measurement of total
OH reactivity
S. Kim et al.
Title Page
Abstract Introduction
Conclusions References
Tables Figures
◭ ◮
◭ ◮
Back Close
Full Screen / Esc
Printer-friendly Version Interactive Discussion
Discussion
P
a
per
|
Dis
cussion
P
a
per
|
Discussion
P
a
per
|
Discussio
n
P
a
per
|
Abstract
We present OH reactivity measurements using the comparative reactivity method with a branch enclosure technique for four different tree species (red oak, white pine, beech and red maple) in the UMBS PROPHET tower footprint during the Community Atmo-sphere BioAtmo-sphere INteraction EXperiment (CABINEX) field campaign in July of 2009.
5
Proton Transfer Reaction-Mass Spectrometry (PTR-MS) was sequentially used as a detector for OH reactivity and BVOC including isoprene and monoterpenes (MT), in en-closure air, so that the measurement dataset contains both measured OH reactivity and calculated OH reactivity from well-known BVOC. The results indicate that isoprene and MT, and in one case a sesquiterpene, can account for the measured OH reactivity.
Sig-10
nificant discrepancy between measured OH reactivity and calculated OH reactivity from isoprene and MT is found for the red maple enclosure dataset but it can be reconciled by adding reactivity from emission of a sesquiterpene,α-farnesene, detected by GC-MS. This leads us to conclude that no significant unknown BVOC emission contributed to ambient OH reactivity from these trees at least during the study period. This
conclu-15
sion leads us to explore the contribution from unmeasured isoprene (the dominant OH sink in this ecosystem) oxidation products such as hydroxyacetone, glyoxal, methyl-glyoxal and C4 and C5-hydroxycarbonyl using recently published isoprene oxidation mechanisms (Mainz Isoprene Mechanism II and Leuven Isoprene Mechanism). Eval-uation of conventionally unmeasured first generation oxidation products of isoprene
20
and their possible contribution to ambient missing OH reactivity indicates that the ratio of OH reactivity from unmeasured products over OH reactivity from MVK+MACR is strongly dependent on NO concentrations. The unmeasured oxidation products can contribute ∼7.2% (8.8% from LIM and 5.6% by MIM 2 when NO=100 pptv) of the
isoprene contribution towards total ambient OH reactivity. This amount can explain
25
∼8.0% (9.7% from LIM and 6.2% from MIM 2) of missing OH reactivity, reported by Di
ACPD
11, 7781–7809, 2011Branch-level measurement of total
OH reactivity
S. Kim et al.
Title Page
Abstract Introduction
Conclusions References
Tables Figures
◭ ◮
◭ ◮
Back Close
Full Screen / Esc
Printer-friendly Version Interactive Discussion
Discussion
P
a
per
|
Dis
cussion
P
a
per
|
Discussion
P
a
per
|
Discussio
n
P
a
per
|
photochemical reactivity of BVOC that have important implications for both photochem-ical ozone and secondary organic aerosol formation.
1 Introduction
Total OH reactivity is defined as the quantity of total atmospheric constituents that can react with OH with reactivity scale units of s−1. It is equivalent to the inverse
5
of the lifetime of OH in the presence of those atmospheric constituents. The mea-surement results have provided quantitative information about how well we constrain reactive constituents in the atmosphere by comparing total calculated OH reactivity, represented by the sum of products between each measured concentration of reactive constituents in the atmosphere and the reaction constant with OH of the given
con-10
stituent. Lou et al. (2010) summarized the ratios of measured and calculated total OH reactivity reported in the range of 1 to 3 from 16 field campaigns. The higher ratios were often observed in rural and forested areas, where biogenic volatile organic compounds (BVOC) are a dominant player in regional photochemistry. The unaccounted measured OH reactivity relative to calculated OH reactivity is often called “missing OH reactivity”.
15
This higher degree of missing OH reactivity in BVOC dominant regions strongly sug-gests significant uncertainty in constraining BVOC and their oxidation products in the atmosphere. Considering the dominance of BVOC emission relative to anthropogenic VOC emission (ten times higher; Goldstein and Galbally, 2007), this uncertainty can be a potential problem in understanding photochemical ozone and secondary organic
20
aerosol (SOA) formation in the atmosphere, two important radiative forcing agents con-trolling global climate (IPCC, 2007). For this reason, a number of studies have tried to identify the sources of unexplored reactive compounds in BVOC dominated regions. The potential sources include (1) unmeasured reactive BVOC emissions, (2) unmea-sured reactive oxidation products from known BVOC such as isoprene and
monoter-25
ACPD
11, 7781–7809, 2011Branch-level measurement of total
OH reactivity
S. Kim et al.
Title Page
Abstract Introduction
Conclusions References
Tables Figures
◭ ◮
◭ ◮
Back Close
Full Screen / Esc
Printer-friendly Version Interactive Discussion
Discussion
P
a
per
|
Dis
cussion
P
a
per
|
Discussion
P
a
per
|
Discussio
n
P
a
per
|
(1) temperature dependence of missing OH reactivity closely following the temperature dependence of terpenoid emission (Di Carlo et al., 2004) (2) high sesquiterpene emis-sions from some ecosystems that are very reactive and have not been constrained by measurements (Bouvier-Brown et al., 2009) and (3) total MT concentrations, measured by the gas-chromatography technique (GC-FID) being consistently lower than those
5
measured by proton transfer reaction mass spectrometry (PTR-MS; Lee et al., 2005). On the other hand, other studies have shown that (1) ambient sesquiterpene concen-trations at the PROPHET site, where significant missing OH reactivity was reported, were too low to explain the missing OH reactivity (Kim et al., 2009), (2) missing OH reactivity could be reconciled by the addition of unmeasured oxidation products
esti-10
mated with a box model calculation (Lou et al., 2010), (3) new oxidation mechanisms of isoprene elucidate faster production of conventionally unmeasured oxidation prod-ucts (Karl et al., 2010; Paulot et al., 2009), and (4) there is good agreement between sensitivity-corrected PTR-MS mass spectra observed in ambient air with those from branch enclosures (Kim et al., 2010). These study results strongly suggest that the
15
source of unknown reactive species in the atmosphere, in at least some of these lo-cations, is poorly constrained oxidation products rather than unconstrained emitted species.
To directly constrain the source of missing reactive species, we conducted total OH reactivity measurement with a branch enclosure for four different tree species in the
20
PROPHET tower ecosystem, an isoprene dominated ecosystem, during the Commu-nity Atmosphere-Biosphere Interaction Experiment (CABINEX) field campaign in July, 2009. In this ecosystem, a significant amount of missing OH reactivity was reported by Di Carlo et al. (2004). In this study, we used the comparative reactivity method (CRM, Sinha et al., 2008) to measure total OH reactivity of emissions from individual branches
25
ACPD
11, 7781–7809, 2011Branch-level measurement of total
OH reactivity
S. Kim et al.
Title Page
Abstract Introduction
Conclusions References
Tables Figures
◭ ◮
◭ ◮
Back Close
Full Screen / Esc
Printer-friendly Version Interactive Discussion
Discussion
P
a
per
|
Dis
cussion
P
a
per
|
Discussion
P
a
per
|
Discussio
n
P
a
per
|
to quantitatively assess the contribution of missing OH reactivity from unknown BVOC emission. We also present calculation results using two up-to-date isoprene oxidation mechanisms (Mainz Isoprene Mechanism 2 (MIM2) Taraborrelli et al., 2009 and Leu-ven Isoprene Mechanism (LIM) Stavrakou et al., 2010) to assess possible contributions of unmeasured isoprene oxidation products towards total OH reactivity.
5
1.1 Methods
1.2 Branch enclosure-CRM OH reactivity measurement system
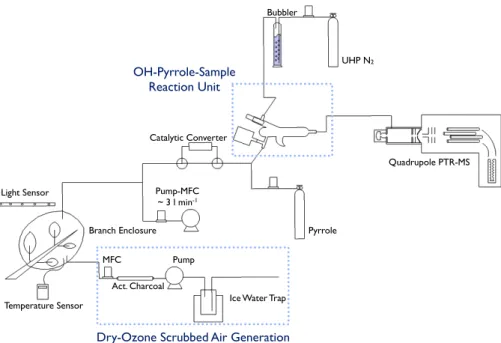
The schematic diagram of the measurement system deployed for the CABINEX field campaign is shown in Fig. 1. The CRM method to measure total OH reactivity is thoroughly described in Sinha et al. (2008) and the potential interferences from water
10
vapor variations are discussed in Sinha et al. (2009). We, therefore, provide a brief overview of the principle of the measurement as follows:
– Step 1 A known amount of pyrrole (C4H4NH) is introduced into the glass reactor
along with VOC free air, which has passed through the catalytic converter. The pyrrole signal is monitored by PTR-MS.
15
– Step 2 The UV lamp is turned on to generate OH from humidified UHP nitrogen. The pyrrole signal is expected to decrease because of rapid reaction with OH (kOH−Pyrrole=1.2×10⁻¹⁰cm3molecule−1s−1).
– Step 3 Sample air from the enclosure is introduced by switching the 3-way valve in Fig. 1. The pyrrole signal from Stage 2 will be increased due to OH reaction
20
competition with reactive constituents (mostly BVOC) in the sample air. Total OH reactivity of the sample air can be calculated from the signal differences as described in Sinha et al. (2008).
– Step 4 The UV lamp is turned off and isoprene and MT in the sample air are analyzed with PTR-MS to assess the contribution of these compounds to the
25
ACPD
11, 7781–7809, 2011Branch-level measurement of total
OH reactivity
S. Kim et al.
Title Page
Abstract Introduction
Conclusions References
Tables Figures
◭ ◮
◭ ◮
Back Close
Full Screen / Esc
Printer-friendly Version Interactive Discussion
Discussion
P
a
per
|
Dis
cussion
P
a
per
|
Discussion
P
a
per
|
Discussio
n
P
a
per
|
– In step 2, the pyrrole concentration inside of the glass reactor was maintained at 30 ppbv, significantly higher than the concentration of OH (∼2 ppbv) to achieve
the pseudo first order reaction regime so that total OH reactivity is only linearly dependent on the pyrrole concentration variation and independent of the OH concentration.
5
Since PTR-MS is only able to measure total MT concentration rather than speciated MT concentration, which are required to calculate the precise contribution of OH reac-tivity from MT, occasional sorbent cartridge (Tenax GR and Carbograph 5TD, Markes Int., Llanstrisant, UK) sampling was conducted for MT speciation information. In ad-dition, BVOC emission other than isoprene and MT can be detected by the cartridge
10
samplings.Adsorbed VOCs were measured using a Series 2 UltraTM TD autosampler coupled to a Unity 1 thermal desorption system (MARKES International, Llantrisant, UK) interfaced with a 7890A series Gas Chromatograph/5975C Electron Impact Mass Spectrometer (GCMS) with a triple-axis detector (Agilent Technologies, Santa Clara, CA, USA). The GC was fitted with a DB5 column (0.25 mm ID×30 m, 0.25 micron sta-15
tionary phase) and was temperature programmed with an initial hold of 1 min at 35◦C and subsequent temperature rampings of 6◦C min−1 to 80◦C, 3◦C min−1 to 155◦C, 10◦C min−1 to 190◦C, 25◦C min−1to 260◦C with a final hold of 5.2 min. to a final tem-perature of 300◦C.
The above procedures were conducted according to a programmed routine. The
20
volume of the Teflon branch enclosure was around 3 l and the ozone and VOC scrubbed air was introduced at the rate of∼6 l min−1. Temperature inside of the enclosure was
monitored and logged by K-type thermocouple with a portable data logger (HOBO, Onset, Pocasset, MA), Photosynthetically Active Radiation (PAR) above the enclosure was also measured using a Line Quantum Sensor (LI-191, LI-COR Lincoln, NE) and
25
ACPD
11, 7781–7809, 2011Branch-level measurement of total
OH reactivity
S. Kim et al.
Title Page
Abstract Introduction
Conclusions References
Tables Figures
◭ ◮
◭ ◮
Back Close
Full Screen / Esc
Printer-friendly Version Interactive Discussion
Discussion
P
a
per
|
Dis
cussion
P
a
per
|
Discussion
P
a
per
|
Discussio
n
P
a
per
|
1.3 Laboratory calibration
Before and after the field campaign, we tested the system response over a wide range of total OH reactivity. A standard gas mixture with methanol, acetonitrile, ac-etaldehyde, acetone, isoprene, methyl vinyl ketone, benzene, toluene, and camphene (1 ppmv±5%, NCAR) was mixed with zero air to generate standard samples for mul-5
tipoint OH reactivity calibrations. The calibration results are summarized in Fig. 2, indicating excellent linearity over a wide range of reactivity. The limit of detection is about 15 s−1 for a five minute averaging time from the signals at Step 2 using Pois-son statistics (3σ), which are routinely used to assess limit of detections for chemical ionization mass spectrometry techniques (Kim et al., 2009). For this study, there was
10
no attempt to lower the detection limit because the enclosure sample was expected to have much higher OH reactivity than the assessed detection limit. Readers who are interested in ambient measurements requiring lower detection limits are referred to Sinha et al. (2010).
1.4 Enclosure total OH reactivity measurement results and comparisons with
15
calculated total OH reactivity from known BVOC (isoprene and monoterpenes)
Total OH reactivity measurements of enclosed branches were conducted during the whole month of July of 2010. Climatologically, the experimental period was charac-terized by below normal temperature and above normal precipitation. Branches for
20
enclosure measurements were selected on trees near the lab in order to reduce wall loss of potential reactive emission compounds. This constraint allowed us to sample only the understory branches.
Ortega et al. (2007) reported specific tree species composition near the PROPHET tower ecosystem and isoprene and MT basal emission rates of the five major tree
25
ACPD
11, 7781–7809, 2011Branch-level measurement of total
OH reactivity
S. Kim et al.
Title Page
Abstract Introduction
Conclusions References
Tables Figures
◭ ◮
◭ ◮
Back Close
Full Screen / Esc
Printer-friendly Version Interactive Discussion
Discussion
P
a
per
|
Dis
cussion
P
a
per
|
Discussion
P
a
per
|
Discussio
n
P
a
per
|
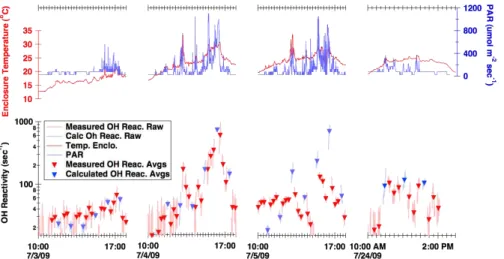
ecosystem. The daily variations of measured and calculated total OH reactivity for the oak tree branch enclosure are presented in the bottom panel of Fig. 3 along with branch enclosure temperature and PAR variations in the upper panel. In addition, the composition of BVOC, which was measured by sorbent cartridge sampling with GC-MS/FID analysis, from the oak tree enclosure is summarized in Table 1. The data for
5
the first three days were from one branch enclosure system (Oak Branch 1) and the data of 24 July was from another branch (Oak Branch 2). The variations of measured OH reactivity can be reasonably explained by the calculated OH reactivity variations from isoprene concentrations measured by PTR-MS except on 5 July. For compari-son purposes, in Fig. 4, afternoon temporal variations (2 p.m. to 6 p.m.) of measured
10
and calculated OH reactivity are presented for 4 July and 5 July along with enclosure temperature and PAR variations. The temperature and PAR variations of both days appear quite different – 4 July has a typical daily temperature evolution for no cloud conditions but the variation on 5 July indicates a few abrupt temperature changes just after the temperature reached the peak temperature of the day due to clouds blocking
15
solar radiation. The differences in the measured and calculated OH reactivity can be explained by this difference. On 4 July, as temperature smoothly varies, the calculated and measured OH reactivity variations are comparable but on 5 July the temperature drop in the middle of the day causes a depressed measured OH reactivity, which was caused by decreased terpenoid emissions. However, as the enclosure temperature
20
increased while the system was operated in the BVOC measurement mode, the cal-culated OH reactivity indicated a big increase. Shortly after, the temperature dropped offagain, while the system changed to the OH reactivity measurement mode. These differences are also confirmed by PAR variations, also plotted in Fig. 4. Thus, we can understand that the significant disagreement on 5 July was actually caused by rapidly
25
ACPD
11, 7781–7809, 2011Branch-level measurement of total
OH reactivity
S. Kim et al.
Title Page
Abstract Introduction
Conclusions References
Tables Figures
◭ ◮
◭ ◮
Back Close
Full Screen / Esc
Printer-friendly Version Interactive Discussion
Discussion
P
a
per
|
Dis
cussion
P
a
per
|
Discussion
P
a
per
|
Discussio
n
P
a
per
|
the most dominant BVOC emission of the enclosure and the calculated OH reactivity variations by MT emission are in range of measured OH reactivity variations as shown in Fig. 5.
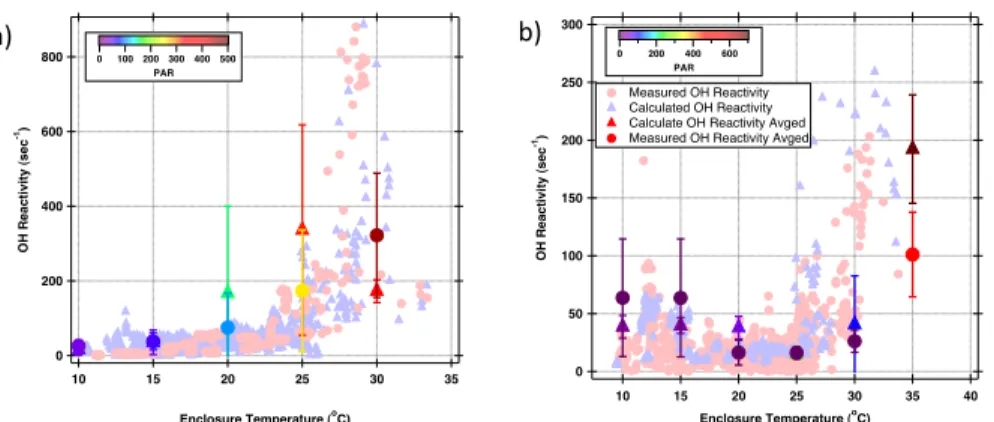
To quantitatively compare the measured and the calculated OH reactivity for the same conditions of PAR and temperature, the two dominant physical parameters
con-5
trolling BVOC emission, one-minute averaged measured and calculated OH reactivity were plotted as a function of temperature in Fig. 6. Overall, both the measured and calculated OH reactivity datasets closely followed the exponential function that is ex-pected for the temperature dependence of BVOC emissions (Guenther et al., 1995). A 5◦C running averaged measured and calculated OH reactivity with color-coding of
10
PAR on the plots clearly indicate that the difference of the measured and calculated OH reactivity in the 5◦C temperature bin can be explained by the differences in PAR. This comparison demonstrated the good agreement between measured and calculated OH reactivity. These results suggest that there is no significant missing OH reactivity asso-ciated with primary BVOC emission for red oak and white pine, which are the two main
15
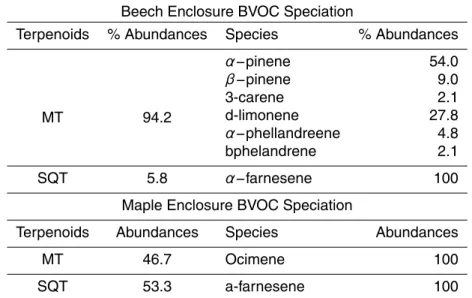
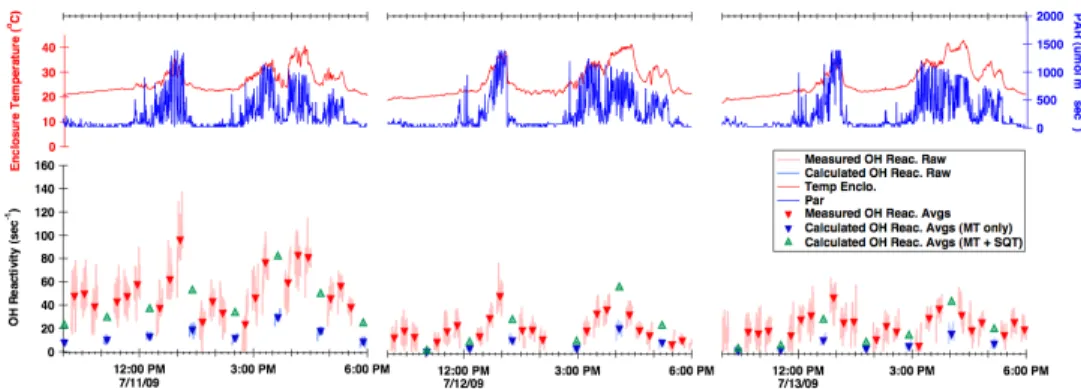
tree species dominating isoprene and MT emissions, respectively, in this ecosystem. The upper panel of Table 2 shows the BVOC composition of a beech tree branch enclosure determined by GC-MS measurement from cartridge sampling. BVOC emis-sion from beech in the PROPHET tower ecosystem was not previously characterized. MTs were the dominant emission of the particular branch investigated and
sesquiter-20
penes (SQT), primarily α-farnesene, composed a minor fraction of the emission. Al-though we measured two different beech branch enclosures during the study period, the cool and rainy weather resulted in only two days of datasets with detectable emis-sion rates. Overall, temporal variations of the measured and calculated (only MT con-sidered) OH reactivity show reasonable agreement as shown in Fig. 7. The cartridge
25
sampling analysis results, in the bottom panel of Table 2, indicate that the dominant emission from a red maple tree enclosure was α-farnesene. Since α-farnesene is a very reactive compound with OH (kOH=3.2×10⁻¹⁰), this results in an obvious
ACPD
11, 7781–7809, 2011Branch-level measurement of total
OH reactivity
S. Kim et al.
Title Page
Abstract Introduction
Conclusions References
Tables Figures
◭ ◮
◭ ◮
Back Close
Full Screen / Esc
Printer-friendly Version Interactive Discussion
Discussion
P
a
per
|
Dis
cussion
P
a
per
|
Discussion
P
a
per
|
Discussio
n
P
a
per
|
consistently higher than measured values when the calculated values only consider observed MT concentrations in the branch enclosure as shown in Fig. 8. To take into account α-farnesene contributions towards measured OH reactivity, the ratio of MT andα-farnesene concentrations, observed from sorbent cartridge analysis is used to include SQT in the calculated OH reactivity. The temporal variations of the calculated
5
OH reactivity including SQT, indicated by green triangles in Fig. 8 shows much closer agreement with measured OH reactivity.
To our knowledge, this study is the first published report of direct total OH reactivity measurement using an enclosure technique to constrain missing BVOC emission. Our measurement and data analysis clearly indicate that the temporal variations of branch
10
enclosure OH reactivity measurements of three different tree species can be explained by the variations of calculated OH reactivity from isoprene and MT, and other known BVOC. A fourth species, red maple, had consistently higher measured OH reactivity than could be explained by isoprene and MT but by consideration of the reactivity of a SQT,α-farnesene, we can reconcile the discrepancy between measured and
calcu-15
lated OH reactivity. These results, therefore, do not suggest that there is a significant unknown or unmeasured primary BVOC emission for the tree species that dominate this ecosystem. However, additional branch enclosure OH reactivity measurements are needed to characterize the dominant species in other ecosystems.
1.5 Possible contributions of first generation oxidation products of isoprene to
20
ambient total OH reactivity
If we conclude that there is no significant unknown primary BVOC emission that con-tributes to OH reactivity, then we must consider if there is any other source of missing OH reactivity in this forest canopy. One possibility is that unmeasured/unknown iso-prene oxidation products are responsible since isoiso-prene is the most dominant BVOC
25
ACPD
11, 7781–7809, 2011Branch-level measurement of total
OH reactivity
S. Kim et al.
Title Page
Abstract Introduction
Conclusions References
Tables Figures
◭ ◮
◭ ◮
Back Close
Full Screen / Esc
Printer-friendly Version Interactive Discussion
Discussion
P
a
per
|
Dis
cussion
P
a
per
|
Discussion
P
a
per
|
Discussio
n
P
a
per
|
isoprene oxidation have characterized kinetics, oxidation products and their yields in laboratories during the past few decades. Paulson and Seinfeld (1992) presented a comprehensive isoprene oxidation mechanism based on studies beginning in the late 70s and results from their chamber experiments. They confirmed that the major first ox-idation products of isoprene are methyl vinyl ketone, methacrolein, formaldehyde, and
5
alkyl nitrate under conditions of high NO and estimated that 22% of the carbon was not identified. The candidates of unidentified products were speculated as “multifunctional, mostly five carbon compounds that form via allylic rearrangement.” These speculated compounds were tentatively identified by PTR-MS from field experiments (Williams et al., 2001) and laboratory experiments (Zhao et al., 2004). As Paulson and Seinfeld
10
(1992) speculated, the compounds were C4 and C5 hydroxycarbonyl compounds and their yields were estimated to be∼31% (Zhao et al., 2004). These findings catalyzed
multi-platform (theoretical, laboratory and field) studies, revealing the complicated na-ture (e.g. Dibble, 2004a, b, and Paulot et al., 2009) of isoprene oxidation chemistry.
Recently, Karl et al. (2009) assessed a number of isoprene oxidation chemistry
15
mechanisms to explain unexpected high hydroxyacetone concentrations observed in the Amazon forest. Conventionally, hydroxyacetone was considered a major oxidation product of MACR by OH. The production rate of hydroxyacetone from MACR oxidation could only explain 10% of the observed hydroxyacetone. To reconcile the discrepancy, Karl et al. (2009) proposed direct production of hydroxyaetone from isoprene oxidation
20
by OH with a molar yield of 8.3%. Indeed, a number of recent findings from labora-tory experiments and theoretical mechanism studies report hydroxyacetone as a first generation oxidation product of isoprene. However, the reported hydroxyacetone yield from isoprene OH oxidation as the first generation product by Paulot et al. (2009) in high NOXcondition is significantly lower (3.8%) than what Karl et al. (2009) proposed.
25
ACPD
11, 7781–7809, 2011Branch-level measurement of total
OH reactivity
S. Kim et al.
Title Page
Abstract Introduction
Conclusions References
Tables Figures
◭ ◮
◭ ◮
Back Close
Full Screen / Esc
Printer-friendly Version Interactive Discussion
Discussion
P
a
per
|
Dis
cussion
P
a
per
|
Discussion
P
a
per
|
Discussio
n
P
a
per
|
urges more systematic laboratory studies with comprehensive measurement tools with various simulation conditions.
We evaluated possible contributions towards ambient total OH reactivity from re-cently published isoprene oxidation mechanisms (MIM and LIM), which have been embedded in global 3-D chemical transport models. Both models incorporated the
5
new findings on isoprene oxidation chemistry and show very strong NO dependence in their product distributions (Stavrakou et al., 2010 for LIM and Taraborelli et al., 2009 MIM). From the oxidation product distributions estimated with the model calcu-lation, we calculated total OH reactivity from each case and assessed the fraction from the routinely measured compounds (e.g. MVK and MACR) and the unmeasured
10
compounds (e.g. C5, C4-hydroxycabonyl compounds, hydroxyacetone, glyoxal, glyco-laldehyde etc.). Since HPALD1 and HPALD2 (two isomers of C5-hydroperoxyaldehyde) are only present in LIM, the first generation products from the 1.6-H shift of isoprene hydroxylperoxy radicals, have a very short photolysis lifetime (J=5×10⁻⁴s−1), we
re-garded photolysis products of HPALD1 and HPALD2 (hydroxyacetone, methylglyoxal,
15
glycolaldehyde, and CH2O) also as isoprene first generation oxidation products. Based
on the isoprene daily variation observed at the PROPHET tower site in the summer of 2005 by PTR-MS, we ran a time-dependent box model to obtain isoprene first genera-tion oxidagenera-tion product producgenera-tion. Daily variagenera-tions of OH, HO2and RO2are constrained
by daily maximum concentrations of 2.5×10⁶, 1×10⁹, and 1×10⁹. The daily varia-20
tion of OH concentration is assumed to follow daily variation of JNO
2 from the TUV 4.1 model run for the site. The HO2, RO2 daily variations are assumed to be similar with
the OH daily variation and the difference from the OH variation maintained at a level of 25% of the daytime maximum before dawn and after sunset (Tan et al., 2001).
The calculation results are presented in Fig. 8. The left panels of the figures show
25
ACPD
11, 7781–7809, 2011Branch-level measurement of total
OH reactivity
S. Kim et al.
Title Page
Abstract Introduction
Conclusions References
Tables Figures
◭ ◮
◭ ◮
Back Close
Full Screen / Esc
Printer-friendly Version Interactive Discussion
Discussion
P
a
per
|
Dis
cussion
P
a
per
|
Discussion
P
a
per
|
Discussio
n
P
a
per
|
of Fig. 8 contain corresponding calculation results from the MIM oxidation scheme. Both schemes predict higher OH reactivity from the unmeasured compounds than OH reactivity from MVK+MACR in a low NO environment. However the ratios of OH reac-tivity from unmeasured compounds with MVK+MACR indicates significant differences between the mechanisms for different NO levels. Especially for 50 pptv of NO, the
5
LIM scheme indicates that OH reactivity from unmeasured compounds is∼3.2 times
higher than that from MVK+MACR. On the other hand, the MIM scheme indicates
∼1.5 times higher OH reactivity from unmeasured compounds than OH reactivity from
MVK+MACR. It is also noticeable that in the high NO simulation, MIM predicts higher ratios than those from LIM. These exercises suggest that the contribution of
convention-10
ally unmeasured oxygenated VOC to total OH reactivity should be carefully evaluated for appropriate NO conditions to constrain the source of missing OH reactivity in clean forest environments where relatively high missing OH reactivity has been reported. These ratios indicate the OH reactivity contribution that first generation unmeasured oxygenated compounds could contribute to ambient total OH reactivity in the PROPET
15
tower forest canopy. Apel et al. (2002) reported MVK, MACR, and isoprene mea-surement results at the PROPHET tower in 1998. The median mixing ratios of MVK, MACR, and isoprene during the daytime (10:00 a.m. to 02:00 p.m., local time) were 0.14 ppbv, 0.07 ppbv and 1.90 ppbv, respectively. Therefore, the OH reactivity ratio of MVK+MACR relative to isoprene from the ambient concentrations is 0.026. Since the
20
PROPHET site is in the low NOXregime (Tan et al., 2001), we applied the calculated
ra-tios of OH reactivity from MVK+MACR and the unmeasured first generation oxidation products in low NO regime (∼100 pptv of NO, S. Bertman, personal communication,
2010 and Thornberry et al., 2001) to assess potential contributions of the unmeasured first generation oxidation products of isoprene. The calculation results indicate that the
25
unmeasured oxidation products can contribute∼7.18% (8.8% from LIM and 5.6% by
MIM 2) of the isoprene contribution towards total ambient OH reactivity. This amount can explain ∼8.0% (9.7% from LIM and 6.2% from MIM 2) of missing OH reactivity,
ACPD
11, 7781–7809, 2011Branch-level measurement of total
OH reactivity
S. Kim et al.
Title Page
Abstract Introduction
Conclusions References
Tables Figures
◭ ◮
◭ ◮
Back Close
Full Screen / Esc
Printer-friendly Version Interactive Discussion
Discussion
P
a
per
|
Dis
cussion
P
a
per
|
Discussion
P
a
per
|
Discussio
n
P
a
per
|
isoprene oxidation products. As noted by Karl et al. (2009), the contributions from fur-ther generation oxidation products towards total OH reactivity become significant (up to 150% of OH reactivity from isoprene) for a photochemically aged isoprene dominated air mass. Therefore, to resolve missing OH reactivity in this ecosystem our research results suggest that further investigation is needed to quantify unmeasured oxidation
5
products of isoprene.
2 Summary and conclusion
As an activity of the CABINEX-09 field campaign, we conducted branch enclosure OH reactivity measurements on four different tree species (red oak, white pine, beech, and red maple) using PTR-MS by applying the CRM approach with a pyrrole reagent
10
(Sinha et al., 2008). The system was set to measure OH reactivity about 75% of the time and isoprene and MT concentrations inside of the enclosure were observed about 25% of the time using PTR-MS so that we can compare total OH reactivity and calculated OH reactivity from biogenic compounds inside of the branch enclosure. The measurement from Red oak, the main isoprene emitter and white pine, the main MT
15
emitter in the ecosystem clearly indicate that the calculated OH reactivity from isoprene and MT can explain nearly all of the measured total OH reactivity. Branch enclosure measurements of beech, which emits both isoprene and MT, also shows reasonable agreement between measured and calculated OH reactivity. Finally, branch enclosure measurements of red maple indicated a systematic discrepancy between measured
20
and calculated OH reactivity from only isoprene and MT. However, if we include the OH reactivity from SQT (α-farnesene), detected by GC-MS from cartridge sampling, the discrepancy could be reconciled. The results indicate that contributions of ambient OH reactivity from unaccounted/unmeasured BVOC emission should be minimal during the field experiment period although additional measurements of more tree species
25
ACPD
11, 7781–7809, 2011Branch-level measurement of total
OH reactivity
S. Kim et al.
Title Page
Abstract Introduction
Conclusions References
Tables Figures
◭ ◮
◭ ◮
Back Close
Full Screen / Esc
Printer-friendly Version Interactive Discussion
Discussion
P
a
per
|
Dis
cussion
P
a
per
|
Discussion
P
a
per
|
Discussio
n
P
a
per
|
To further explore the possibility of contributions of conventionally unmeasured iso-prene oxidation products such as C5, C4 hydroxycarbonyl compounds, hydroxyace-tone, glyoxal, and methylglyoxal towards ambient OH reactivity, we evaluated their con-tributions using two isoprene oxidation schemes (LIM and MIM2) used for regional and global tropospheric chemistry models. The evaluation results indicate that the
conven-5
tionally unmeasured first generation products of isoprene that are produced during the day could contribute∼20% of OH reactivity from ambient isoprene. This can be
inter-preted to account for∼22% of the missing OH reactivity, reported in this ecosystem by
Di Carlo et al. (2004). Karl et al. (2009) pointed out that more photochemically aged air masses have even more significant contributions of OVOC to total OH reactivity, so
10
the contribution certainly can be even greater. These analyses indicate that we need to quantify these unconstrained isoprene oxidation products in order to constrain missing OH reactivity at this forest site. As Peeters and Muller (2010) claimed from their theo-retical studies, different laboratory conditions, especially NO level, can cause different distributions of oxidation products and serve as a guideline for oxidation mechanism
15
development. This, therefore, suggests the need for more systematically NO controlled laboratory experiments along with better calibration synthesis methods. In addition, the HO2–RO2 ratio, which makes significant differences in oxidation product distributions
(Navarro et al., 2010), should be very carefully considered in controlled laboratory ex-periments and interpreted for atmospheric implications (Paulot et al., 2010). This effort
20
should be combined with the effort to characterize primary BVOC emission such as sesquiterpenes, which may contribute to total OH reactivity in some ecosystems.
Acknowledgements. We are grateful to M. A. Carroll and University of Michigan Biological
Sta-tion for use of the PROPHET tower facility. We thank Tiffany Duhl for her assistance in analyzing cartridge samples. The National Center for Atmospheric Research is operated by the
Univer-25
ACPD
11, 7781–7809, 2011Branch-level measurement of total
OH reactivity
S. Kim et al.
Title Page
Abstract Introduction
Conclusions References
Tables Figures
◭ ◮
◭ ◮
Back Close
Full Screen / Esc
Printer-friendly Version Interactive Discussion
Discussion
P
a
per
|
Dis
cussion
P
a
per
|
Discussion
P
a
per
|
Discussio
n
P
a
per
|
References
Apel, E. C., Riemer, D. D., Hills, A., Baugh, W., Orlando, J., Faloona, I., Tan, D., Brune, W., Lamb, B., Westberg, H., Carroll, M. A., Thornberry, T., and Geron, C. D.: Measurement and interpretation of isoprene fluxes and isoprene, methacrolein, and methyl vinyl ketone mixing ratios at the PROPHET site during the 1998 intensive, J. Geophys. Res.-Atmos., 107, 4034,
5
doi:10.1029/2000JD000225, 2002.
Bouvier-Brown, N. C., Holzinger, R., Palitzsch, K., and Goldstein, A. H.: Large emissions of sesquiterpenes and methyl chavicol quantified from branch enclosure measurements, At-mos. Environ., 43, 389–401, 2009.
Di Carlo, P., Brune, W. H., Martinez, M., Harder, H., Lesher, R., Ren, X., Thornberry, T., Carroll,
10
M. A., Young, V., Shepson, P. B., Riemer, D., Apel, E., and Campbell, C.: Missing OH reactivity in a forest: Evidence for unknown reactive biogenic VOCs, Science, 304, 722– 725, 2004.
Dibble, T. S.: Intramolecular hydrogen bonding and double H-atom transfer in peroxy and alkoxy radicals from isoprene, J. Phys. Chem. A, 108, 2199–2207, doi:10.1021/JP0306702, 2004a.
15
Dibble, T. S.: Prompt chemistry of alkenoxy radical products of the double H-atom transfer of alkoxy radicals from isoprene, J. Phys. Chem. A, 108, 2208–2215, doi:10.1021/JP0312161, 2004b.
Goldstein, A. H. and Galbally, I. E.: Known and unexplored organic constituents in the earth’s atmosphere, Environm. Sci. Technol., 41, 1515–1521, 2007.
20
Guenther, A., Hewitt, C. N., Erickson, D., Fall, R., Geron, C., Graedel, T., Harland, R. J., Klinger, L., Lerdau, M., Mckay, M., Pierce, T., Scholes, B., Steinbrecher, R., Tallamraju, R., Taylor, J., and Zimmerman, P.: A global model of natural volatile organic compound emission, J. Geophys. Res., 100, 8873–8892, 1995.
IPCC: Climate change 2007-syntesis report, Geneva, Switzerland, 2007.
25
Karl, T., Guenther, A., Turnipseed, A., Tyndall, G., Artaxo, P., and Martin, S.: Rapid formation of isoprene photo-oxidation products observed in Amazonia, Atmos. Chem. Phys., 9, 7753– 7767, doi:10.5194/acp-9-7753-2009, 2009.
Kim, S., Karl, T., Guenther, A., Tyndall, G., Orlando, J., Harley, P., Rasmussen, R., and Apel, E.: Emissions and ambient distributions of Biogenic Volatile Organic Compounds (BVOC) in
30
ACPD
11, 7781–7809, 2011Branch-level measurement of total
OH reactivity
S. Kim et al.
Title Page
Abstract Introduction
Conclusions References
Tables Figures
◭ ◮
◭ ◮
Back Close
Full Screen / Esc
Printer-friendly Version Interactive Discussion
Discussion
P
a
per
|
Dis
cussion
P
a
per
|
Discussion
P
a
per
|
Discussio
n
P
a
per
|
Kim, S., Karl, T., Helmig, D., Daly, R., Rasmussen, R., and Guenther, A.: Measurement of at-mospheric sesquiterpenes by proton transfer reaction-mass spectrometry (PTR-MS), Atmos. Meas. Tech., 2, 99–112, doi:10.5194/amt-2-99-2009, 2009.
Lee, A., Schade, G. W., Holzinger, R., and Goldstein, A. H.: A comparison of new measure-ments of total monoterpene flux with improved measuremeasure-ments of speciated monoterpene
5
flux, Atmos. Chem. Phys., 5, 505–513, doi:10.5194/acp-5-505-2005, 2005.
Lou, S., Holland, F., Rohrer, F., Lu, K., Bohn, B., Brauers, T., Chang, C.C., Fuchs, H., Hseler, R., Kita, K., Kondo, Y., Li, X., Shao, M., Zeng, L., Wahner, A., Zhang, Y., Wang, W., and Hofzumahaus, A.: Atmospheric OH reactivities in the Pearl River Delta – China in summer 2006: measurement and model results, Atmos. Chem. Phys., 10, 11243–11260,
10
doi:10.5194/acp-10-11243-2010, 2010.
Ortega, J., Helmig, D., Guenther, A., Harley, P., Pressley, S., and Vogel, C.: Flux estimates and oh reaction potential of reactive biogenic volatile organic compounds (BVOCs) from a mixed northern hardwood forest, Atmos. Environ., 41, 5479–5495, 2007.
Paulot, F., Crounse, J. D., Kjaergaard, H. G., Kroll, J. H., Seinfeld, J. H., and Wennberg, P.
15
O.: Isoprene photooxidation: new insights into the production of acids and organic nitrates, Atmos. Chem. Phys., 9, 1479–1501, doi:10.5194/acp-9-1479-2009, 2009.
Paulson, S. E. and Seinfeld, J. H.: Development and evaluation of photooxidation mechanism for isoprene, J. Geophys. Res., 97, 20703–720715, 1992.
Sinha, V., Custer, T. G., Kluepfel, T., and Williams, J.: The effect of relative humidity on the
20
detection of pyrrole by PTR-MS for OH reactivity measurements, Int. J. Mass Spectrom., 282, 108–111, 2009.
Sinha, V., Williams, J., Crowley, J. N., and Lelieveld, J.: The Comparative Reactivity Method – a new tool to measure total OH Reactivity in ambient air, Atmos. Chem. Phys., 8, 2213–2227, doi:10.5194/acp-8-2213-2008, 2008.
25
Sinha, V., Williams, J., Lelieveld, J., Ruuskanen, T. M., Kajos, M. K., Patokoski, J., Hellen, H., Hakola, H., Mogensen, D., Boy, M., Rinne, J., and Kulmala, M.: OH reactivity measurements within a boreal forest: Evidence for unknown reactive emissions, Environ. Sci. Technol., 44, 6614–6620, 2010.
Stavrakou, T., Peeters, J., and Mller, J.-F.: Improved global modelling of HOx recycling in
iso-30
prene oxidation: evaluation against the GABRIEL and INTEX-A aircraft campaign measure-ments, Atmos. Chem. Phys., 10, 9863–9878, doi:10.5194/acp-10-9863-2010, 2010.
ACPD
11, 7781–7809, 2011Branch-level measurement of total
OH reactivity
S. Kim et al.
Title Page
Abstract Introduction
Conclusions References
Tables Figures
◭ ◮
◭ ◮
Back Close
Full Screen / Esc
Printer-friendly Version Interactive Discussion
Discussion
P
a
per
|
Dis
cussion
P
a
per
|
Discussion
P
a
per
|
Discussio
n
P
a
per
|
Carroll, M. A., Thornberry, T., Apel, E., Riemer, D., and Stockwell, W.: HOX budgets in a deciduous forest: Results from the prophet summer 1998 campaign, J. Geophys. Res.-Atmos., 106, 24407–24427, 2001.
Thornberry, T., Carroll, M. A., Keeler, G. J., Sillman, S., Bertman, S. B., Pippin, M. R., Ostling, K., Grossenbacher, J. W., Shepson, P. B., Cooper, O. R., Moody, J. L., and Stockwell, W.
5
R.: Observations of reactive oxidized nitrogen and speciation of NOy during the PROPHET summer 1998 intensive, J. Geophys. Res.-Atmos., 106, 24359–24386, 2001
Taraborrelli, D., Lawrence, M. G., Butler, T. M., Sander, R., and Lelieveld, J.: Mainz Isoprene Mechanism 2 (MIM2): an isoprene oxidation mechanism for regional and global atmospheric modelling, Atmos. Chem. Phys., 9, 2751–2777, doi:10.5194/acp-9-2751-2009, 2009.
10
Williams, J., Poschl, U., Crutzen, P. J., Hansel, A., Holzinger, R., Warneke, C., Lindinger, W., and Lelieveld, J.: An atmospheric chemistry interpretation of mass scans obtained from a proton transfer mass spectrometer flown over the tropical rainforest of Surinam, J. Atmos. Chem., 38, 133–166, 2001.
Zhao, J., Zhang, R. Y., Fortner, E. C., and North, S. W.: Quantification of hydroxycarbonyls from
15
ACPD
11, 7781–7809, 2011Branch-level measurement of total
OH reactivity
S. Kim et al.
Title Page
Abstract Introduction
Conclusions References
Tables Figures
◭ ◮
◭ ◮
Back Close
Full Screen / Esc
Printer-friendly Version Interactive Discussion
Discussion
P
a
per
|
Dis
cussion
P
a
per
|
Discussion
P
a
per
|
Discussio
n
P
a
per
|
Table 1.A summary of GC-MS analysis of BVOC emissions from red oak (top panel) and white pine (bottom panel) enclosures.
Red Oak Enclosure BVOC Speciation
Terpenoids % abundances Species % Abundances
Isoprene 98.9
Monoterpenes 1.1
α−pinene 24.8
β−pinene 25.6 camphene 11.4
β−phellandrene 20.7 limonene 18.2
White Pine Enclosure BVOC Speciation
Terpenoids Abundances Species Abundances
Monoterpenes 62.8
α−pinene 18.6
β−pinene 35.1 camphene 11 limonene 24.4 3-carene 7.96
Oxygenated monotperpenes 37.1 linalool 100
Sesquiterpenes 1.0 αβ−humulene 22.7
ACPD
11, 7781–7809, 2011Branch-level measurement of total
OH reactivity
S. Kim et al.
Title Page
Abstract Introduction
Conclusions References
Tables Figures
◭ ◮
◭ ◮
Back Close
Full Screen / Esc
Printer-friendly Version Interactive Discussion
Discussion
P
a
per
|
Dis
cussion
P
a
per
|
Discussion
P
a
per
|
Discussio
n
P
a
per
|
Table 2. A summary of GC-MS analysis of BVOC emission from beech (top panel) and red maple (bottom panel) enclosures.
Beech Enclosure BVOC Speciation
Terpenoids % Abundances Species % Abundances
MT 94.2
α−pinene 54.0
β−pinene 9.0 3-carene 2.1 d-limonene 27.8
α−phellandreene 4.8 bphelandrene 2.1
SQT 5.8 α−farnesene 100
Maple Enclosure BVOC Speciation
Terpenoids Abundances Species Abundances
MT 46.7 Ocimene 100
ACPD
11, 7781–7809, 2011Branch-level measurement of total
OH reactivity
S. Kim et al.
Title Page
Abstract Introduction
Conclusions References
Tables Figures
◭ ◮
◭ ◮
Back Close
Full Screen / Esc
Printer-friendly Version Interactive Discussion
Discussion
P
a
per
|
Dis
cussion
P
a
per
|
Discussion
P
a
per
|
Discussio
n
P
a
per
|
Dry-Ozone Scrubbed Air Generation!
Act. Charcoal!
Pump!
Ice Water Trap!
MFC!
Branch Enclosure!
Pump-MFC!
~ 3 l min-1!
Catalytic Converter !
Pyrrole!
OH-Pyrrole-Sample!
Reaction Unit!
UHP N2!
Bubbler!
Quadrupole PTR-MS!
Temperature Sensor!
Light Sensor!
ACPD
11, 7781–7809, 2011Branch-level measurement of total
OH reactivity
S. Kim et al.
Title Page
Abstract Introduction
Conclusions References
Tables Figures
◭ ◮
◭ ◮
Back Close
Full Screen / Esc
Printer-friendly Version Interactive Discussion
Discussion
P
a
per
|
Dis
cussion
P
a
per
|
Discussion
P
a
per
|
Discussio
n
P
a
per
|
1200
1000
800
600
400
200
0
OH Reactivity (sec
-1 )
2:00 PM 7/5/09
5:00 PM
U.S. Eastern Daylight Saving Time
32
28
24
20
Enclosure Temperature (
o
C)
2:00 PM 7/4/09
5:00 PM
1200
800
400
0
Calc. OH React. Mea. OH React. Mea. OH React. Avg. Calc. OH React. Avg. Enclosure Temp. PAR
ACPD
11, 7781–7809, 2011Branch-level measurement of total
OH reactivity
S. Kim et al.
Title Page
Abstract Introduction
Conclusions References
Tables Figures
◭ ◮
◭ ◮
Back Close
Full Screen / Esc
Printer-friendly Version Interactive Discussion
Discussion
P
a
per
|
Dis
cussion
P
a
per
|
Discussion
P
a
per
|
Discussio
n
P
a
per
|
300
250
200
150
100
50
0
OH Reactivity (sec
-1)
40 35 30 25 20 15 10
Enclosure Temperature (o
C)
600 400 200 0
PAR
Measured OH Reactivity Calculated OH Reactivity Calculate OH Reactivity Avged Measured OH Reactivity Avged
!"# $"#
800
600
400
200
0
OH Reactivity (sec
-1)
35 30 25 20 15 10
Enclosure Temperature (o C) 500
400 300 200 100 0
PAR
ACPD
11, 7781–7809, 2011Branch-level measurement of total
OH reactivity
S. Kim et al.
Title Page
Abstract Introduction
Conclusions References
Tables Figures
◭ ◮
◭ ◮
Back Close
Full Screen / Esc
Printer-friendly Version Interactive Discussion
Discussion
P
a
per
|
Dis
cussion
P
a
per
|
Discussion
P
a
per
|
Discussio
n
P
a
per
|