Materials Research, Vol. 11, No. 3, 387-390, 2008 © 2008
*e-mail:[email protected]
Influence of the Sodium Content on the Reactivity of Carbon Anodes
Jefferson dos Santos Batistaa, Benedito Inácio da Silveirab*
a
Red Area Management, Alumínio do Norte do Brasil S.A. – ALUNORTE,
Barcarena - PA, Brazil
b
Faculty of Chemical Engineering, Federal University of Pará – UFPA,
R. Augusto Correa, 01, Guamá, 66075-110 Belém - PA, Brazil
Received: March 7, 2008; Revised: September 19, 2008
Spent anodes, denominated butts in the aluminum industry, are recycled as part of the raw material used to produce new anodes. The fragmentation of the butt generates some sodium-rich powder, which is captured and included in the recycled material. This paper evaluates the influence of sodium content on anode reactivity. Six formulations with 0 to 25% butt powder were used. An average increase of 48 ppm of sodium from one to another formulation caused average increments of 3.38 and 2.72% for air and CO2 reactivity, respectively. The quality-related figures varied from 1.34 to 1.12 for CO2 and from 1.10 to 0.62 for air, showing quality loss in higher sodium content and higher impact on air reactivity. The Fischer formula predicted a carbon specific consumption of – 48.47 kg.t–1 Al for baked carbon anodes with 127 ppm to 367 ppm of sodium content, showing
that the sodium can cause relevant carbon losses and increase costs of the aluminum production.
Keywords: butt, aluminum, spent anode, anode reactivity
1. Introduction
The Hall-Héroult process is the only method currently used to produce aluminum in the primary aluminum industry. In this process, aluminum is produced in electrolytic pots into which alumina (Al2O3) is fed and dissolved in molten cryolite (Na3AlF6) at about 960 °C. Molten aluminum is formed on the base of the carbon cathode in the pot, while oxygen ions released from the dissociation of the alumina react with the carbon anode blocks, generating carbon dioxide (CO2). Good quality carbon anodes should be oxidation-resistant in gaseous environments in order to minimize losses due to air oxidation on the surface of the exposed piece (C + O2→ CO2) and carbon oxidation caused by the carbon dioxide generated during the aluminum pro-duction (CO2 + C ↔ 2CO)1. Some methods, such as the bench scale
method, are broadly used to measure anode reactivity with a quality control purpose. Finding out that the anodes have low quality when in use usually generates undesirable costs. For this reason, the pro-duction of test specimen in bench scale is one of the methods used to assess the quality of the anodes within the composition of interest and subsequent evaluation of some of their properties1. As the anode life
in the electrolytic cells comes to an end, the residual anodes, called butts, remain attached to the rod. These are recycled as a component of the anode production process. In this recycling process, the butts are crushed, generating a type of powder, which is captured and, despite containing some impurities, is also recycled into the proc-ess. These impurities have strong influence on the consumption of the anode in the electrolytic cells, and the main necessity to control them arises from the fact that they may have significant oxidation catalyzing effects in the operation of electrolytic cells. Amongst the main impurities acting as catalysts of the oxidation reactions is the chemical element sodium (Na). Although it is well documented that sodium acts as a catalyst of carbon oxidation reactions, no significant relationship with the oxidation of anodes was obtained1.
This paper aims at assessing the influence of sodium content in the powder generated by butt crushing on the carbon anode reactivity
and the impact of the impurities on the quality figures to both air and CO2, in addition to the predicted specific carbon consumption using the Fischer formula2.
2. Materials and Methods
Coke, pitch and butt powder were collected according to the mass balance for each required bench scale anode formulation. The compo-nents were mixed, homogenized and characterized through chemical analyses by X ray fluorescence and atomic absorption. The fractions of the formulations were obtained by grain size classification3. Based
on a sodium mass balance and considering the butt powder size distribution, six formulations were prepared with amounts of butt powder ranging from 0 to 25% of the fines fraction. The total sodium concentration (Natotal) (ppm) was calculated through equation:
(1 )
( )
total P
C M F B
Na Na P P
Na C Na M Na F Na B
= + −
+ + + (1)
where P, C, M, F and B are the percentages of pitch, coarse, medium and fine fractions and butt powder, respectively, used in the formu-lations. NaP, NaC, NaM, NaF and NaB are the sodium concentrations (ppm) in P, C, M, F and B, respectively. The preparation and devel-opment of the anodes from the formulations were carried out in an equipment called bench scale R & D Carbon 189-161 and based on the internal procedure of the Alumínio Brasileiro Company S.A. (ALBRAS)3. For each formulation, 50 mm diameter and 130 mm
height test specimens were prepared. The following analyses were carried out: X ray fluorescence, thermal conductivity4, air
perme-ability5, air reactivity6, and CO
2 reactivity 7.
per-388 Batista & Silveira Materials Research
meability (PM)8. In order to calculate the quality figure to the CO 2
(QCO
2), the following equation was used:
2
3.7 ( 2 ) 9.3
260
RRCO CO
x RRCO x xPM
Q = − σ − (2)
where RRCO, σRRCO, and PM are expressed in %, % and nPm, respectively.
The anode resistance to air oxidation is a function of the reactivity residue to the air (RRAir), RRAir standard deviation (σRRAir), thermal
conductivity (TC), and air permeability (PM)8. In order to calculate
the quality figure to the air (Qair), the following equation was used:
(
)
1.5 2 8.0 5.0 / 646
Air RRAir
Q = × RRAir− × σ − ×TC− ×PM (3)
where RRAir, σRRAir, TC and PM are expressed in %, w.mK–1, and
nPm, respectively.
The quality figures to the CO2 and air of the anodes were assessed and eventually used to evaluate the behavior of the anodes obtained in laboratory as a function of the sodium concentration. In order to foresee the impact of the sodium concentration on the specific carbon consumption concerning the main properties of the anode quality control, the Fischer formula was used. In this paper, in order for the Fischer formula to be applied, the reactivity residues to the air and CO22-9 in the following equation were used:
1.7 1.5
NC x RRCO x RRAir
∆ = − ∆ − ∆ (4)
where ∆NC, ∆RRCO and ∆RRAir are the variations of specific carbon consumption, reactivity residue to the CO2, and reactivity residue to the air, respectively.
3. Results and Discussion
The data of sodium concentration and the results obtained from the sodium mass balance with respect to the butt powder are presented in Table 1.
Table 1 data show that the lowest total sodium concentration, 118.45 ppm, is found in the formulation where butt powder is not added, and the highest one, 296.1 ppm, is in the formulation with 25% butt powder.
Table 2 shows the results of the analyses carried out with samples of baked anode prepared in bench scale with the six formulations.
From the results in Table 2, one can observe that the increase of sodium concentration in the carbon anodes causes an increase in CO2 and air reactivity. These results also show that only for the case where butt powder was not added, the values of RRAir can be considered as typical; values between 65 and 90%, for all the other results obtained in different sodium concentrations, the values of RRAir are out of the standards generally found for this pattern10. The TC values showed
in Table 2 are lower than the typical range found for this property, such as values between 3.0 and 4.5 W(m.K).
Figure 1 shows the changes in the residue from CO2 reactivity (RRCO) as a function of the increase in sodium concentration in the anodes.
The results shown in Figure 1 demonstrate that the values of RRCO decreased with the increase of the sodium concentration, in-dicating that there was an increase in CO2 reactivity with the increase in sodium concentration. In other words, there was an acceleration of the reaction CO2 + C ↔ 2 CO with the increase in the fraction of butt powder in the samples11. From the results, one can also observe
that, on average, 48 ppm of sodium cause a decrease of 2.72% in the RRCO values. Then, sodium is acting as a catalyst of CO2 reactivity, causing a total loss of RRCO by 13.6%. According to the determina-tion coefficient R2 obtained for the adjustment of the curve of the
Figure 1 there is a strong dependence on the RRCO with respect to sodium content12.
Figure 2 shows the changes of the RRAir as a function of the sodium concentration in the bench scale carbon anodes.
Figure 2 results show that the values of RRAir decreased with the increase of sodium concentration. The value of 367 ppm of
Table 1. Total sodium content in each formulation.
Component Sodium concentration (ppm)
Pitch 172 172 172 172 172 172
Coarse fraction 103 103 103 103 103 103
Medium fraction 101 101 101 101 101 101
Fine fraction 121 121 121 121 121 121
Butt’s powder 957 957 957 957 957 957
Butt’s powder (%) 0 5 10 15 20 25
Natotal 118.45 153.98 189.51 225.04 260.57 296.10
Table 2. Results of the analyses of the samples prepared in bench scale.
Butt’s powder (%)
Na (ppm)
TC W(m.K)
PM (nPm)
RRCO (%)
RRAir (%)
0 127 2.50 0.78 97.6 67.3
5 163 2.24 1.54 94.3 61.1
10 204 1.92 1.12 93.4 58.9
15 286 2.12 0.84 91.1 57.4
20 339 2.93 1.27 88.5 55.2
25 367 2.86 1.91 84.0 50.4
80 85 90 95 100
Sodium concentration (ppm)
RRCO (%)
100 150 200 250 300 350 400
Vol. 11, No. 3, 2008 Influence of the Sodium Content on the Reactivity of Carbon Anodes 389
sodium caused the lowest value for RRAir, 50.4%, indicating a negative effect of the sodium content on the reactivity residue to the air from the anodes. This means that it has an acceleration of reac-tion O2 + C ↔ CO2. On average, increments of 48 ppm of sodium content from one formulation to another caused an average loss of 3.38% of RRAir, and a total loss of the observed RRAir of 16.9%. This behavior shows the catalytic effect of sodium on air reactivity, confirming what is described in the literature13.
The catalytic effect of the sodium (Na) observed both for the CO2 reactivity and for air reactivity can cause, in addition to the deterioration of the carbon anode properties, an increase in the excessive consumption of anodes, temperature of the electrolytic bath as a function of the higher powder generation, loss of current efficiency, etc.11.
In the range of the studied sodium concentration, the data of Figure 2 were adjusted to a third order polynomial equation, and the determination coefficient R2 showed a strong dependence degree of
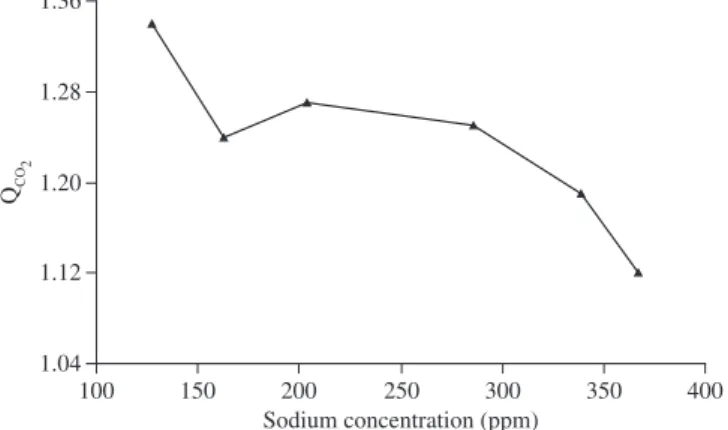
RRAir with respect to the sodium concentration. The profile for the quality figure to the CO2 (QCO
2) is shown in Figure 3.
From the results of Figure 3 it is observed that the values of QCO 2 are higher than 1, meaning that the obtained anodes are of good quality with respect to the CO28. When the sodium concentration changed
from 127 ppm to 367 ppm, the values of QCO
2decreased from 1.34 to 1.12 indicating a quality decrease of the anodes with respect to the CO2 reactivity.
In Figure 4 it is shown the profile for the quality figure to the air (QAir ) for the carbon anodes studied.
Figure 4 results show that the only formulation with QAir value higher than 1 was that prepared without the addition of butt powder. For all the others, QAir values are lower than 1, indicating that the sodium-rich anodes prepared with butt powder are of bad quality with respect to the air8. The strong quality drop observed in the
formulations prepared with 20 to 25% butt powder, is probably explained by the combined effect of the higher air permeability in those formulations (see results in Table 2). The QAir values shown in Figure 4 decreased from 1.10 to 0.62, while the values of QCO2shown in Figure 3 decreased from 1.34 to 1.12, showing that sodium had greater influence on air reactivity than on CO2 reactivity.
By applying the Fischer formula to estimate the specific carbon consumption, the following result was obtained.
1.7 (97.6 84.0) 1.5 (67.3 50.4) (1.7 13.6) (1.5 16.9) 48.47 / NC
kg t Al
∆ = − × − − × − =
− × − × = − (5)
On the basis of such result, it was estimated that if there is a range of sodium concentration from 127 ppm to 367 ppm in the baked carbon anode required for aluminum production, then there will be relevant losses that require greater amounts of anode pieces for the same production, thus increasing the specific consumption and production costs for this metal14.
4. Conclusions
The results have shown that the higher the sodium concentration in the carbon anodes, the lower the reactivity residues to air and CO2, thus demonstrating higher catalytic activity and susceptibility to the reactivity by the anodes produced. For sodium concentration changes from 127 to 367 ppm, the reactivity residues to CO2 changed from 97.6 to 84.0% and the air changed from 67.3 to 50.4%, respectively. For an average increase of 48 ppm in the sodium concentration from one formulation to another, there was an average loss of 2.72% for the reactivity residue to CO2 and 3.38% to air, showing higher catalytic effect on the reactivity to air.
The quality figure to the CO2 values obtained for carbon anodes manufactured with different sodium concentrations indicated that all the samples analyzed are of good quality, but with strong tendency to drop as the sodium concentration increases. The quality figure of the air oxidation had only one formulation without butt powder, which showed anodes of good quality, all the others with butt powder
30 40 50 60 70
100 150 200 250 300 350 400
Sodium concentration (ppm)
RRAir (%)
Figure 2. RRAir (%) changes as a function of the sodium concentration (ppm).
1.04 1.12 1.20 1.28 1.36
100 150 200 250 300 350 400
Sodium concentration (ppm) QCO
2
Figure 3. Quality figure to the CO2 (QCO2) as a function of the sodium con-centration (ppm).
0.40 0.60 0.80 1.00 1.20
100 150 200 250 300 350 400
Sodium concentration (ppm)
QAir
Figure 4. Quality figure to the air (QAir) as a function of the sodium
390 Batista & Silveira Materials Research
in their preparation showed bad quality; QAir values changed from 1.10 to 0.62. The Fischer formula prediction of the specific carbon consumption, taking into account the impact from sodium concentra-tion, resulted in the value of ∆NC = –48.47 kg.t–1 Al, which means
that there was a relevant increase in the specific carbon consumption and on aluminum production costs.
Acknowledgements
The authors are thankful to ALBRAS, Alumínio Brasileiro S. A. Co., for the financial support.
References
1. Hume SM. Anode Reactivity – Influence of Raw Material Properties. 2
ed. Sierre, Switzerland: R&D Carbon Ltd.; 1999.
2. Mori Z. Practical. Experience with a Formula for the Prediction of the
Anode Consumption, 1993. In: Anodes for the Aluminum Industry. 1 ed.
Sierre, Switzerland: R&D Carbon Ltd.; 1995. p. 369-379.
3. RDC 161. Bench Scale Plant: Instructions. Sierre, Switzerland: R&D Carbon Ltd; 1989.
4. RDC 143. Thermal Conductivity. Sierre, Switzerland: R&D Carbon Ltd;
1989.
5. RDC 145. Air Permeability. Sierre, Switzerland: R&D Carbon Ltd; 1989.
6. RDC 151. Air Reactivity of Electrodes. Sierre, Switzerland: R&D Carbon Ltd; 1989.
7. RDC 146. CO2 Reactivity of Electrodes. Sierre, Switzerland: R&D Carbon
Ltd; 1989.
8. Keller F. Anode Quality Figures. In: Anodes for the Aluminum Industry.
1 ed. Sierre, Switzerland: R&D Carbon Ltd.; 1995. p. 355-357.
9. Moura RR. Venda de Finos: Estudo de Viabilidade Econômica. Relatório
interno ALBRAS, 2001. Barcarena, PA: ALBRAS; 2001.
10. Hulse KL. Anode Manufacture – Raw Materials, Formulation and
Processing Parameters. 1 ed. Sierre. Switzerland: R&D Carbon Ltd.; 2000.
11. Meier MW. All about CO2 and Air Reactivity of Anodes. One Day Course,
Albras on 2003 May 14. Barcarena: R&D Carbon Ltd.; 2003.
12. Andriotti JLS. Fundamentos de Estatística e Geoestatística. São
Leopoldo: Ed. Unisinos; 2003. 165 p.
13. Naterstad T. Fundamentals of Aluminium Production. In: The 18th
International Course on Process Metallurgy of Aluminium; 1999 May 15-16. Norway: Norwegian University of Science and Technology Trondheim; 1999.