Using Raster Based Solutions to Identify Spatial Economic Agglomerations
Marian DÂRDALĂ, Adriana REVEIU
Bucharest Academy of Economic Studies, Romania [email protected], [email protected]
The efficient economic activities incline to be concentrated in space, and therefore there is an increased attention over the forces of spatial economic agglomerations and the role of loca-tion in economic development. This paper proposes some soluloca-tions to automate the identifica-tion of spatial agglomeraidentifica-tions and their intensities, funcidentifica-tion on the spatial distribuidentifica-tion of items in the geographical areas. The software components developed to accomplish this task are Geographic Information Systems specific tools.
Keywords: GIS, Spatial Agglomerations, Raster, Framework, Raster Symbology
Introduction
There are a lot of scientific papers sup-porting the idea that in the presence of ag-glomeration economies, the potential for growth is increasing in the level of economic activity [1].
The huge amount of spatial data generated by GIS (Geographical Information Systems) ex-pansion, the increasing number of geographic informatics applications available, the com-puterization of a large amount of information sources, and the availability of digital map has increased the opportunity and need for the usage of methods and techniques for spa-tial data analysis and integration with eco-nomic data, for both research and applied purposes. [3]
This paper proposes a GIS based solution to automate the identification of agglomerations in space, by determining the density of spa-tial elements, function on their physical loca-tions.
The proposed solutions suppose to use soft-ware components developed to automate and to reuse the same behavior, for a large set of applications, developed for many domains and economic applications. The software components could be used in scenarios based manner.
Scenarios developed in a certain field, can be reused in the same domain, extending or im-proving them, or in other scientific fields, by adapting them to new requirements. The pro-cess of reuse is dependent on the complexity of the information presented, describing the use of functions implemented readiness of
users in areas that have been developed for these scenarios. [5]
The proposed solutions use raster concept, as support to generate the level of density of spatial distributed economic items, i.e. the density of companies performing in one eco-nomic field, as they are distributed in space and the distribution of communication means like roads, in space, based on their densities. A raster consists of a matrix of cells, each containing a value representing information, such as: temperature or the presence of one economic phenomenon in a specific place. Rasters are digital aerial photographs, image-ry from satellites, digital pictures, or even scanned maps.
Data stored in a raster format represents real-world phenomena, like: thematic or discrete data, representing features such as land-use or soils data and continuous data, represent-ing phenomena such as temperature, eleva-tion or spectral data such as satellite images and aerial photographs.
Within a GIS, the uses of raster data fall un-der the following main categories:
raster as a basemap by using
raster as a surface map –are well suited rasters for representing data that changes continuously across a surface. They pro-vide an effective method of storing the continuity as a surface. They also provide a regularly spaced representation of sur-faces. Elevation values measured from the earth's surface are the most common ap-plication of surface maps, but other val-ues, such as rainfall, temperature, concen-tration, and population density, can also define surfaces that can be spatially ana-lyzed;
raster as a thematic map – are raster repre-senting thematic data, which can be de-rived from analyzing other data. Thematic maps can result from geoprocessing oper-ations, which combine data from various sources, such as vector, raster, and terrain data. For example, you can process data through a geoprocessing model to create a raster dataset that maps suitability for a specific activity;
raster as attributes of a feature - rasters used as attributes of a feature may be digi-tal photographs, scanned documents, or scanned drawings related to a geographic object or location[6].
The main advantages of storing the spatial data as a raster are: the simple data structure - because a matrix of cells with values repre-senting a coordinate and sometimes linked to an attribute table; a powerful format for
ad-vanced spatial and statistical analysis; the ability to represent continuous surfaces and to perform surface analysis; the ability to uni-formly store points, lines, polygons, and sur-faces; and the ability to perform fast overlays with complex datasets. [6]
2 Programmatic Solutions
To accomplish the tasks of this paper, solu-tions based on the raster processing are used. To develop the software components the
ArcObjects framework is used. ArcObjects is
a framework developed on COM (compo-nent) type technology, used to build ArcGIS software, developed by ESRI (Environmental Systems Research Institute) [4].
By using a framework to develop software applications, the advantage that allows de-velopers to reuse code and also to facilitate the building of new extensions is supported. In order to use the raster based symbology, that allow us to reflect the spatial data densi-ty in the territorial area, a hierarchy of classes has been developed. The hierarchy of classes enables the use of specialized coclasses for generating the symbology, based on spatial data types like point and polyline. The coclasses are used to generate new objects [3].
Figure 1 presents the developed of classes hi-erarchy.
Fig. 1.The hierarchy of classes used to display spatial data density in space
In ArcObjects, the raster is organized as a
matrix of values, having different types: byte, int, double, and so on, and it is organized into levels. A level contains a matrix which, se-mantically, expresses something. For exam-ple, if we include in ArcMap a bitmap image,
chro-matic point of view, like a combination of the
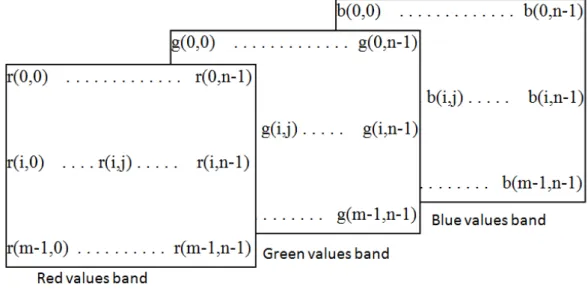
three values: the values of red, green and blue layers. Figure 2 illustrates this structure for an image having m x n resolution.
Fig. 2.The decomposition of one image into three bands, represented in RGB
Considering the terminology used by the ArcObjects framework, two coclasses has been defined (RS_Densitate_Linii and RS_Densitate_Puncte), and an abstract class
(RS_Densitate) having the goal to close the
hierarchy. RS_Densitate class contains
work-ing elements used by the two coclasses. It is an inheritance relationship between classes, in the sense that coclasses inherit attributes and methods of the base abstract class. Raster type symbology can be generated, from spa-tial data having specific types like: line or point. RS_Densitate class has been defined as
an abstract class, because it cannot be direct-ly instantiate. The Generare_Raster method
used to generate the raster has been described as a pure virtual method because it cannot be concretized inside the abstract class, but it makes sense to be defined the concrete clas-ses derived from it. Generare_Raster method
aims to generate raster, by using the input pa-rameters, some are common for both types of spatial data, and others are specific for each type of data. Once obtained, the raster can be appropriate symbolized, so that the areas from geographic studied are able to be dis-played as suggestive as possible, in terms of
density of spatial data generated. Because the symbology applies to the resulting raster, the specific methods used to generate the sym-bology were grouped into parent class (the abstract one). For this purpose three methods have been defined:
Afisare_Implicita used to display the
ras-ter by default, i.e. by using colors from black to white; the black color is associat-ed with the lowest density areas, and white color is associated with the highest density areas, intermediate density areas are coloured in shades of gray;
Afisare_Continua used to display the
ras-ter by using continuous tone of colors, the user provides, for this purpose, the start color that will match the lower density ar-eas and the last color has to be associated with the highest density areas; intermedi-ate areas will be colored with transitional tones, that make the transition from initial to final colors;
Afisare_Discreta used discrete color tones
to be set out, for the density values, and a color will be assigned for each group (range) of values to view these areas. In this case, the extreme colors will be pro-vided, and the intermediate groups will be then filled with transition colors.
To have a high degree of generality, for the hierarchy of classes, a constructor has been
defined. The constructor has the goal to cre-ate the connection with the document map, which is generated based on raster symbolo-gy. The input parameters are provided in the form of properties, which are of read-write type.
The abstract class RS_Densitate has the
fol-lowing content:
abstract class RS_Densitate {
//member data
// object that signifies no argument protected object miss = Type.Missing; // the cell size
protected double cels;
// the name of thematic layer for which the raster image will be generate protected string numel = null;
// the thematic layer which will generate the raster image protected ILayer l_dr = null;
// the working space
protected IWorkspace ws = null;
// extreme colours (initial and final colour) protected IRgbColor ci, cf;
// the generate raster
protected IRaster ries = null; // the map document
protected IMxDocument doc; // the map
protected IMap harta;
// rendering the raster image
protected IRasterRenderer rsrend = null;
// the factor for adjustment values, depending on the measure unit protected int fmum = 0;
// the constructor that takes as parameter the map document, // extracts the actual map and
// build two objects, for storing and manipulating colours public RS_Densitate(IMxDocument phdoc)
{
ci = new RgbColorClass(); cf = new RgbColorClass(); doc = phdoc;
harta = doc.FocusMap; }
// the property used to set / get the cell size public double Dim_cel
{
get { return cels; } set { cels = value; } }
// the property used to set / get spatial data, by the thematic layer name public string Data_sp
{
get { return numel; } set { numel = value;} }
// the property used to set / get the workspace public IWorkspace Sursa
{
get { return ws; } set { ws = value; } }
ci.Red = vr; ci.Green = vg; ci.Blue = vb; }
public void Set_culoare_end(byte vr, byte vg, byte vb) {
cf.Red = vr; cf.Green = vg; cf.Blue = vb; }
// pure virtual method used to generate the raster protected abstract void Generare_Raster(); // the default display of raster
public void Afisare_Implicita() {
// to generate raster – the method aims // setting IRaster type variable
Generare_Raster();
// a raster type layer is created, by using IRaster type variable IRasterLayer rl = new RasterLayerClass();
rl.CreateFromRaster(ries); // add raster layer to the map harta.AddLayer(rl);
// raster layer moves to the last position, to assure non overlapping other // spatial elements from the map
harta.MoveLayer(rl, harta.LayerCount - 1); // the TOC (Table of Content) is updated
doc.UpdateContents(); }
To display the density of spatial data like a raster, a raster with only one level has to be developed. The matrix stores the density val-ues, in the required points, so that on display-ing, the numeric values will be scaled on a color ramp. Thus, the points turn differently depending on their values. To have a better
accuracy in representing the densities, the raster has to contain an array of real values (double).
Get_minmax method aims to calculate the
minimum and maximum values of the raster matrix.
protected void get_minmax(ref double mn, ref double mx) {
// the access to the collection of layers of raster image IRasterBandCollection rbc = (IRasterBandCollection)ries;
// getting the first band
IRasterBand rb = rbc.Item(0); // calculate the statistics of raster rb.ComputeStatsAndHist();
// storing the statistics in the rs variable IRasterStatistics rs = rb.Statistics;
// getting the minimum value mn = rs.Minimum;
// getting the maximum value mx = rs.Maximum;
}
Simbologie_Raster_Interval method aims to
symbolize the raster, so that the pixels to be colored according with the values member-ship to a range of values. In this way, the us-er can specify the numbus-er of groups, namely the number of intervals that have to be gen-erated, and the pixels from each group will be separately colored. This view allows the user to mesh the raster, in terms of colors, so that the diversity of matrix of pixels values
will be displayed, by using fewer colors. This method has to surprise important changes in density within the geographical area studied. The method gets the number of groups (z),
which is the number of intervals of values that has to be generated, and vsup parameter
given by a symbolic constant which indicate the measure unit used in the labeling.
the following constants: public enum Suprafata { M_patrati, KM_patrati };
protected void Simbologie_Raster_Interval(int z, Suprafata vsup) {
int i;
double mxv = 0, miv = 0;
// create object of raster rendering type, // based on the classification into classes
rsrend = new RasterClassifyColorRampRendererClass(); IRasterRenderer rr = (IRasterRenderer)rsrend;
// set Raster property, with the value of raster that has to be symbolized rr.Raster = ries;
// specify the number of groups (ranges of values)
((IRasterClassifyColorRampRenderer)rsrend).ClassCount = z; // building an object of colour ramp type, that has to generate // algorithmically colours
IAlgorithmicColorRamp cramp = new AlgorithmicColorRampClass(); // establish the number of colours from the ramp (= the number of groups) cramp.Size = z;
// initial colour
cramp.FromColor = ci; // final colour
cramp.ToColor = cf; bool vb = true; // generate the colour ramp cramp.CreateRamp(out vb);
// calculate the minimum and maximum values from the raster get_minmax(ref miv, ref mxv);
// building an object for filling style
IFillSymbol fs = new SimpleFillSymbolClass(); // calculate the size of the range of values
double lbv = Convert.ToDouble((mxv - miv) / z); // updating the raster
rr.Update();
// symbolization for each interval for (i = 0;
i <= ((IRasterClassifyColorRampRenderer)rsrend).ClassCount - 1; i++) {
// getting colours from the colour ramp fs.Color = cramp.get_Color(i);
// setting the symbology for the desired range
((IRasterClassifyColorRampRenderer)rsrend).set_Symbol (i, (ISymbol)fs); // calculate the lower limit of the range
double h1 = (lbv * i) + miv; // calculate the highest limit of the range double h2 = (lbv * (i + 1)) + miv;
// displaying the range in the legend string sfmt = null;
if (vsup == 0) sfmt = "F9";
else { mxv *= fmum; miv *= fmum; h1 *= fmum; h2 *= fmum; sfmt = "F5"; }
((IRasterClassifyColorRampRenderer)rsrend).set_Label
(i, h1.ToString(sfmt) + "-" + h2.ToString(sfmt)); }
}
Afisare_Discreta method actually displays
the symbolized raster by nrg classes of
val-ues. It uses csup parameter, for the measure
unit used in labeling.
public void Afisare_Discreta(int nrg, Suprafata csup) {
// the raster it is generate Generare_Raster(); // the raster it is symbolised
// the raster layer it is build
IRasterLayer rl = new RasterLayerClass(); // the raster is named
rl.Name = "raster_rez"; // the layer is create from the raster rl.CreateFromRaster(ries);
// to raster is rendered based on the symbology generated // by the rsrend object
rl.Renderer = rsrend; // the raster is add to the map harta.AddLayer(rl);
// the thematic raster is moved on the last position, // so that do not overlap the existing spatial data harta.MoveLayer(rl, harta.LayerCount - 1); // the content of the TOC window it is updated
doc.UpdateContents(); }
Another way to display the raster, defined in-side the class, uses a continuous color pixel, and the matrix values have to be scaled on the color ramp used.
Simbologie_Raster_Rampa method achieves
this by defining extreme colors of the color
ramp, and by obtaining minimum and maxi-mum values of the generated raster. The method receives as parameter the measure unit used to express the numerical values of the legend (vsup).
protected void Simbologie_Raster_Rampa(Suprafata vsup) {
double mxv = 0, miv = 0; // create object of Stretch Renderer type
rsrend = new RasterStretchColorRampRendererClass(); IRasterRenderer rr = (IRasterRenderer)rsrend; // associate with the symbolized raster
rr.Raster = ries; // update the raster
rr.Update();
// build the colour ramp with 255 distinct colours
IAlgorithmicColorRamp cramp = new AlgorithmicColorRampClass(); cramp.Size = 255;
cramp.FromColor = ci; cramp.ToColor = cf; bool vb = true;
cramp.CreateRamp(out vb);
// rendering by using band 0 of raster (matrix 0 of raster)
((IRasterStretchColorRampRenderer)rsrend).BandIndex = 0; // previously generated colour ramp (cramp) is used
((IRasterStretchColorRampRenderer)rsrend).ColorRamp = cramp; // calculate the minimum and maximum values, from raster matrix
get_minmax(ref miv, ref mxv); string sfmt = null;
// adjustment to the measure Unit if (vsup == 0) sfmt = "F9";
else { mxv *= fmum; miv *= fmum; sfmt = "F5"; } // setting label to maximum value
((IRasterStretchColorRampRenderer)rsrend).LabelHigh = "Mare: " + mxv.ToString(sfmt);
// setting label to minimun value
((IRasterStretchColorRampRenderer)rsrend).LabelLow = "Mica: " + miv.ToString(sfmt);
}
Afisare_Continua method generates a layer
based on symbolized raster, and includes it to be viewed into the map. The parameter of
public void Afisare_Continua(Suprafata csup) {
Generare_Raster();
Simbologie_Raster_Rampa(csup);
IRasterLayer rl = new RasterLayerClass(); rl.Name = "raster_rez";
rl.CreateFromRaster(ries); rl.Renderer = rsrend; harta.AddLayer(rl);
harta.MoveLayer(rl, harta.LayerCount - 1); doc.UpdateContents();
} }
The derived classes implement specific ele-ments to generate raster, and to highlight spa-tial data densities, function on their type. Thus, RS_Densitate_Linii class is used to
de-termine the density of spatial data of line type, while RS_Densitate_Puncte type is
used for the point type data. In both classes the pure virtual method of abstract class (Generare_Raster) is defined to generate the
appropriate raster, corresponding to the type of spatial data.
The RS_Densitate_Linii class content is the following:
class RS_Densitate_Linii : RS_Densitate {
// the constructor that calls the base constructor and sets // adjustment value according to the specified measurement unit public RS_Densitate_Linii(IMxDocument phdoc) : base(phdoc)
{ fmum = 1000; } // raster generation method overloading
protected override void Generare_Raster() {
// identify the layer for which the raster has to be generate if (numel != null)
{
int i;
for (i = 0; i < harta.LayerCount; i++) if (harta.get_Layer(i).Name == numel) {
l_dr = harta.get_Layer(i); break;
}
if (i == harta.LayerCount)
throw new Dens_Ex("Nu exista layer-ul:" + numel); }
else throw new Dens_Ex("Nu a fost precizat layer-ul!"); IFeatureLayer fl = (IFeatureLayer)l_dr;
// testing the type of geometry for spatial data
if(fl.FeatureClass.ShapeType!=esriGeometryType.esriGeometryPolyline) throw new Dens_Ex("Layerul nu e tip LINIE!!");
IGeoDataset gds = (IGeoDataset)fl.FeatureClass; // building the object used to determine the density IDensityOp rdc = new RasterDensityOpClass(); // building the object used to define the elements // necessary to perform raster analysis
IRasterAnalysisEnvironment renv = (IRasterAnalysisEnvironment)rdc; // setting workspace
renv.OutWorkspace = ws; // setting raster cell size object ocels = cels; renv.SetCellSize
(esriRasterEnvSettingEnum.esriRasterEnvValue, ocels); // define locations in which the raster has to be generate
env.YMin = fl.AreaOfInterest.YMin; env.YMax = fl.AreaOfInterest.YMax; object obenv = env;
renv.SetExtent(esriRasterEnvSettingEnum.esriRasterEnvValue,
ref obenv, ref miss); // generate the raster to determine the density of line type spatial data ries = (IRaster)rdc.LineDensity(gds);
} }
In the code sequence we can observe that certain exceptions are thrown through the
Dens_Ex class. This class is derived from
Exception class and has the following
con-tent:
class Dens_Ex : Exception {
public Dens_Ex(string serr) : base(serr) { } }
To test the functionality of
RS_Densitate_Linii class we used the
themat-ic layer, with Romania’s roads named
drumuri, the working space is given by FileGeoDatabase which is stored in: d:\H_densitate\bds.gdb. The color ramp used
generate colors in the following space: from white - rgb (255,255,255), which is associat-ed with minimum value of the raster till rassociat-ed - rgb (255,0,0).
The code sequence is:
// define the type of workspace Type tip = Type.GetTypeFromProgID
("esriDataSourcesGDB.FileGDBWorkspaceFactory"); // building an instance for a type of workspace
IWorkspaceFactory wsf = (IWorkspaceFactory)Activator.CreateInstance(tip); // to generate an object of RS_Densitate_Linii type,
// that use elements from current map document
RS_Densitate_Linii obdl = new RS_Densitate_Linii(ArcMap.Document); // setting cell size
obdl.Dim_cel = 2000;
// setting the layer for which the raster will be generate obdl.Data_sp = "drumuri";
// open data source
obdl.Sursa = wsf.OpenFromFile(@"d:\H_densitate\bds.gdb", 0); // setting extreme colours
obdl.Set_culoare_start(255, 255, 255); obdl.Set_culoare_end(255, 0, 0);
// continuous type displaying, the measure unit is KM try { obdl.Afisare_Continua(Suprafata.KM_patrati); } catch (Dens_Ex err_ex) { MessageBox.Show(err_ex.Message); }
The code execution generates and allows displaying a raster, as presented in figure 3. The color space is scaled and it is associated with pixels having the values between the two extremes. In figure 3 we can observe that areas with a higher density of roads are in-tensely colored with red color, while other
Fig. 3. Symbology used to display continuous density
RS_Densitate_Puncte class has similar
con-tent, but it has one additional parameter indi-cating the radius used to identify a circular area around a point, which is taken as a
ref-erence area to calculate the density. A point is, in fact, a cell that has an associated di-mension.
class RS_Densitate_Puncte : RS_Densitate {
double r=1;
// object used to identify neighbouring area of the point IRasterNeighborhood rv = new RasterNeighborhood();
public RS_Densitate_Puncte(IMxDocument phdoc) : base(phdoc) { fmum = 1000000; }
// the property for the radius public double Raza {
get { return r; } set { r = value; } }
protected override void Generare_Raster() {
if (numel != null) {
int i;
for (i = 0; i < harta.LayerCount; i++) if (harta.get_Layer(i).Name == numel) {
l_dr = harta.get_Layer(i); break;
}
if (i == harta.LayerCount)
throw new Dens_Ex("Nu exista layer-ul:" + numel); }
else throw new Dens_Ex("Nu a fost precizat layer-ul!"); IFeatureLayer fl = (IFeatureLayer)l_dr;
if(fl.FeatureClass.ShapeType!=esriGeometryType.esriGeometryPoint) throw new Dens_Ex("Layerul nu e tip PUNCT!!");
(IRasterAnalysisEnvironment)rdc; renv.OutWorkspace = ws;
object ocels = cels;
renv.SetCellSize(esriRasterEnvSettingEnum.esriRasterEnvValue, ocels); IEnvelope env = new EnvelopeClass();
env.XMin = fl.AreaOfInterest.XMin; env.XMax = fl.AreaOfInterest.XMax; env.YMin = fl.AreaOfInterest.YMin; env.YMax = fl.AreaOfInterest.YMax; object obenv = env;
renv.SetExtent(esriRasterEnvSettingEnum.esriRasterEnvValue, ref obenv, ref miss); // area of circular neighbouring with the radius r, in map units
rv.SetCircle(r, esriGeoAnalysisUnitsEnum.esriUnitsMap);
// generate the raster to determine the density of spatial data of point type ries = (IRaster)rdc.PointDensity(gds, rv);
} }
Fig. 4. Symbology used to display the density, by using three groups of values To display the raster from the Figure 4, is
used the method for discreet displaying
obdp.Afisare_Discreta (3, Suprafata.KM_patrati), which indicate three
classes of values; obdp is the
RS_Densitate_Puncteobject.
3 The Case Study
The raster base solutions available to deter-mine the density of points of interest could be used in various economic fields. These could be applied to identify the target study areas of interest, for in deep studies in vari-ous economic analyses, such as: to identify the best location for establishing a new busi-ness, function on the businesses developed in
the proximity; to identify the location of one deposit-centre for a company with a lot of subsidiaries in one geographical area; to identify cluster based economic agglomera-tions function on the location of possible ac-tors of the cluster [7], and on the transport in-frastructure available to connect them.
Spatial data generated by GIS can be used in other various areas like in the hybrid support systems [8] in order to ensure effective sup-port for smart business decision-making pro-cesses, in analysis the competition between various regions [9], and to classify the geo-graphical areas function on population struc-ture as in [10].
functional-ity of proposed solutions, in the paper, we are trying to identify the cluster type economic agglomerations, in the pharmaceutical indus-try of Romania. To accomplish this task we have to identify the agglomerations of com-panies acting in pharmaceutical industry, lo-cated in a geographical proximity as the first step, and the second step supposes to identify
the geographical areas with a good agglom-eration of transport facilities (roads).
In the figure 5, the geographical distribution of companies performing in pharmaceutical industry of Romania is figured, by using points. On the same map, the layer with the available roads has been represented.
Fig. 5. Spatial agglomerations in pharmaceutical industry of Romania
By using the software components devel-oped, as they are presented in this paper in the previous sections, the density of compa-nies (points) and the density of roads availa-ble to link them (lines) have been identified, in each geographical area. The results are figured on the same map, and are presented in figure 5.
A strong economic agglomeration of compa-nies acting in pharmaceutical industry could be identified in the South part of Romania, in Bucharest-Ilfov-Prahova area. Even there are a lot of agglomerations of companies per-forming in this field, in various geographical
areas, because there is not good enough transport infrastructure available, to link them, we can conclude that there are not good conditions to identify a successful eco-nomic cluster in pharmaceutical field, in the-se regions.
4 Conclusions
definition of areas that are strictly related to the phenomenon of spatiality.
The raster based solutions facilitate to inte-grate the spatial and economic data and to perform analysis like the spatial distribution of economic issues in space. The software components presented in the paper automate the processing of both economic and spatial data and generate the appropriate maps con-taining both types of data.
Acknowledgement
This work was supported by the project “Per-formance and excellence in postdoctoral re-search in Romanian economics science
do-main”, POSDRU contract No.
89/1.5/S/59184.
References
[1] E.-L. Glaeser, H.-D. Kallal, J.-A. Sheinkman and A. Sheifler, “Growth in Cities”, Journal of Political Economics,
no. 100, 1992, pp. 1126-1152.
[2] K.-T., Chang, “Programming ArcObjects with VBA”, CRC Press, 2008.
[3] M. Dardala, A. Reveiu, ”Techniques for Statistical Data Visualization in GIS”, Informatica Economică Journal, vol 15, no. 3, 2011, pp. 72-79.
[4] R., Burke, “Getting to Know ArcObjects: Programming ArcGIS with VBA”, ESRI Press, 2003.
[5] V. D. Mihon, A. Minculescu, V. Colceriu and D. Gorgan, “Diagramatic description of distributed spatial data processing”,
Revista Romana de Interactiune Om-Calculator, vol. 5(3), 2012, pp. 59-80.
[6] ***, Exploring ArcObjects, ESRI Press, 2002.
[7] Boja, C., “Clusters Models, Factors and Characteristics”, International Journal of Economic Practices and Theories, no. 1
(2011), pp. 34 – 43.
[8] C. Brandas, “Hybrid Support Systems: a Business Intelligence Approach”, Journal of Applied Business Information Systems,
2(2), pp: 57 - 62, 2011.
[9] R. C. Mușetescu, “The Economics of State Aid Control in the European Union during the Financial Crisis: The Chal-lenge for a Post-Crisis Rhetoric.” Theo-retical and Applied Economics 6 (XIX),
2012: 175-184.
[10] C. Herţeliu, M.A. Farcasanu, “The Reli-gious Affiliation Structure of the Villages from Romania”, Journal of Applied Quantitative Methods, no. 1, 2011, pp.
121-128.
Marian DÂRDALĂ has graduated the Faculty of Cybernetics, Statistics and Economic Informatics. He holds a PhD diploma in Economic Cybernetics and Statistics. He is professor in Economic Informatics field and branches within Department of Economic Informatics at faculty of Cybernetics, Statis-tics and Economic InformaStatis-tics from Academy of Economic Studies. He is the author and co-author of 11 books and over 50 articles in journal and pro-ceedings of national and international conferences, symposiums, workshops in the fields of multimedia, human computer interaction - HCI, GIS, data bases and object oriented programming.