Volume: 04 Issue: 05 Pages: 1737-1743 (2013) ISSN : 0975-0290
Analysis of Multipath MANET Routing
Protocols under Variable Range
Transmission Power
V.Lalitha1,Dept. Of Computer Science,Govt. Arts College, Pudukkottai, TN, India [email protected]
Dr.R.S.Rajesh2,
Dept. Of Computer Science &Engg, M.S.University, Tirunelveli, TN, India [email protected]
---ABSTRACT--- A Mobile Ad Hoc Network is a collection of mobile wireless nodes connected together to form a dynamic network without the need for any fixed infrastructure. This dynamic and unpredictable nature of MANETs requires multi-path routing. In multipath routing multiple paths are established between a source and destination pair of nodes. Multi-path routing provides several benefits such as fault-tolerance, load balancing etc. Transmission power of nodes plays an important role in MANET communication. Now, let us assume that each node can dynamically control the transmission power it uses independently of other nodes. The objective of this work is to study the behavior and performance of the two multi-path MANET routing protocols with respect to different transmission range/power of individual nodes of the network. We have selected Ad Hoc On-Demand Multi-path Distance Vector (AOMDV) Routing Protocol and Multi-path Dynamic Address Routing (MDART) Protocol for this study. We will analyze the impact of increase in transmission range/power of individual nodes on the performance of these multi-path MANET routing protocols.
Key Words:Ad hoc Network, AOMDV, MANET, MDART, Transmission Range, Transmission Power.
--- Date of Submission: 23, February 2013 Date of Acceptance: 21, March 2013 --- 1. INTRODUCTION
A
Mobile ad hoc network [1] is a dynamic network that can be formed without fixed infrastructure. Nodes within the wireless range of each other are called neighbors. Neighbor nodes can communicate directly to send data. When a node needs to communicate with non-neighbor node the data is routed through a sequence of multiple hops where the intermediate nodes act as routers. Due to the limited transmission range of wireless nodes multiple hops are usually needed for communication with any non-neighbor node.The wireless mobile nodes change their position frequently. The topology of the MANET dynamically changes due to the mobility of nodes. When the nodes moves out of the wireless range of other nodes some of the links break and some new links are created. When multipath routing is used the number of link failures can be reduced.
The salient features of MANETs make them different from other kind of network such as wired or infrastructure wireless network. Prominent characteristics of MANET defined by Corson and Macker [2] are dynamic topologies, bandwidth-constrained operation, energy-constrained operation and limited physical security.
Energy conservation is one of the major things to be considered in protocol design. In MANET the nodes rely
on battery power for their energy. The topology of the ad hoc network depends on the transmission power of the nodes and the location of the mobile nodes, which may change from time to time [3]. In MANET there might be enormous unidirectional links where the individual node’s transmission power is affected by interference, buildings, mountains and other obstructions etc. or the nodes will use different transmission powers. To maintain high connectivity MANET require bidirectional links. The dynamic connectivity imposes major challenges for the network layer to determine the multi-hop route between a given pair of source and destination nodes.
1.1 About this Work
In a multi hop communication scenario, there may be frequent link failures due to rapid change in topology caused by node mobility. The transmission range of the node is a very important aspect which will have more influence on the network connectivity. The nodes with sufficiently higher transmission range can maintain connectivity even at higher mobility
their destinations. Thus, there exists an optimum value of the radio transmission range [4]. The optimization of transmission range as a system design issue was studied in [5].
Varying the transmission power requires determining the distances between nodes especially when nodes are mobile and the algorithm should be power aware and topology aware [6].
PARO [7] is a power aware routing algorithm which caters for variable transmission power network; it aims to directly minimize the total power consumed over the entire transmission path. Essentially, an intermediate node inserts itself to the routing path if it potentially leads to energy savings for the transmission.
In a multipath routing environment, the change in transmission range will have a great impact on the performance of the routing protocols. In this paper, we analyze the impact of change in transmission range/power on the performance of two multi-path MANET routing protocols.
2. MULTI-PATH MANET ROUTING
PROTOCOLS
2.1 Ad Hoc On-Demand Multi-path Distance Vector (AOMDV) Routing Protocol
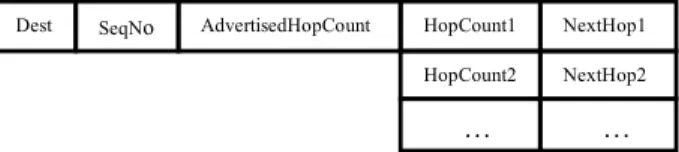
AOMDV [15] is an improvement of Ad-Hoc On Demand Distance Vector routing protocol (AODV). AOMDV [13], [14] is a multi-path routing protocol that provides multiple loop-free and link-disjoint paths. In each route discovery AOMDV find multiple paths between source and destination. When a route is required the source broadcasts the RREQ for the destination throughout the network. A node which receives the RREQ checks the destination field of RREQ packet. If the node itself is the destination or if it has routing information for the destination node, it will send the RREP packet to the sender. If no routing information is available it will send RRER message to the sender. The routing table entry contains the fields shown below.
For the same destination sequence number multiple routes are kept and only one of them is advertised to others and the hop count of that path is the advertised hop count. A route from a neighbour is accepted only if it has a smaller or equal advertised hop count.
2.2 Multi-path Dynamic Address Routing (MDART) Protocol
M-DART is an enhancement of shortest path routing protocol known as Dynamic Address Routing (DART) [16]. M-DART [17] discovers and stores multiple paths to the destination in the routing table. With dynamic addressing paradigm network addresses are assigned to
nodes on the base of the node position inside the network topology. M-DART has two main features compared to other multi-path routing protocols. First, the redundant routes discovered by M-DART are guaranteed to be communication-free and coordination-free, i.e., their route discovery and announcement though the network does not require any additional communication or coordination overhead. Second, M-DART discovers all the available redundant paths between source and destination, not by means of dynamic addressing. Since the whole routing process is based on the transient network addresses, they have to be efficiently distributed across the network. The mapping between node identities and network addresses is provided by a Dynamic Hash Table.
3. TRANSMISSION POWER MODEL AND
ENERGY CONSERVATION
3.1 Transmission Power Calculation
The transmission distance between two wireless devices depends on transmission power Tx of the sender, receiver sensitivity Rx, antenna gain, frequency and the data rate.
In the following table, the transmission power is calculated based on the needed coverage distance. If the transmission distance is smaller than the cross over distance, then the free space p r o p a ga t i o n model is used otherwise t he t wo-ray ground propagation model is used. H. T. Friis presented the following equation to calculate the received signal power Pr in free space at distance d from the transmitter [8] [9] [10] [11] [12]
L d G G P d
P t t r
r 2 2
2 ) 4 ( ) ( π λ
= ---(1)
Where Pt is the transmitted signal power, Gt and Gr are the antenna gains of the transmitter and the receiver respectively. L is the system loss, and λ is the wavelength. In ns simulations the antenna gains are set to 1 and the loss L is also set to 1. For longer distance more accurate prediction is obtained by using two r a y gr o und models and the equation is given by
L d h h G G P d
P t t r t r
r 4
2 2 )
( = ---(2) Where ht and hr are the heights of transmit and receive antennas respectively. To be consistent with the free space model L is added here. The above equation shows a faster power loss than Eqn. (1) as distance increases.
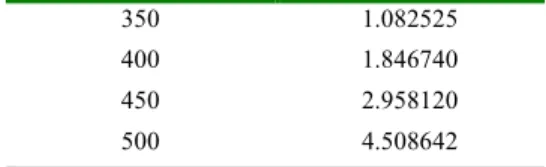
Table 1 :The Tx Power and Range of Transmission Distance m Transmission Power Needed 100 0.007214 150 0.036520 200 0.115421 250 0.281790 300 0.584320 Dest SeqNo AdvertisedHopCount HopCount1 NextHop1
HopCount2 NextHop2
Volume: 04 Issue: 05 Pages: 1737-1743 (2013) ISSN : 0975-0290
350 1.082525 400 1.846740
450 2.958120 500 4.508642
3.2 Transmission Power Control
The main objective of power control in mobile ad hoc networks is achieved by reducing the total energy consumed in packet delivery and increasing the network throughput by increasing the channel's spatial reuse of the available channels. In this work we change the transmission power to minimize interference and error rate of the transmission link. When transmission power/transmission range is modified based on distance between transmitter and receiver. In addition, the decreased interference allows greater spatial reuse and this increases the performance of the overall network. 4. SIMULATION
The simulations were done using network simulator ns2 [18] version 2.35 under Linux environment. Further, the random way point mobility model available in ns2 is used to create the random topology files.
4.1 Random Waypoint Mobility Model
The most commonly used model in research environments is the random waypoint mobility model. In this model, a node picks a destination at random and moves towards it with a speed chosen randomly from a uniform distribution [0,Vx], where Vx is the highest possible speed for every node. When it arrives at the destination, the node waits for a duration defined by the 'pause time' parameter. After this time has passed, it chooses a new random destination and repeats the process until the end of the simulation.
4.2 Metrics considered for Evaluation
In order to evaluate the performance of ad hoc network routing protocols, the following quantitative metrics were considered:
Packet Delivery Fraction/Ratio (PDF/PDR):. It is the ratio of the number of packets successfully received by all destinations to the total number of packets arrived from all network sources.
Routing Load: It is measured by the ratio of the number of routing messages propagated by every node in the network and the number of data packets successfully delivered to all destination nodes.
End-to-End Delay: The average time interval between the generation of a packet in a source node and the successfull delivery of the packet at the destination node. It counts all possible delays that can occur in the source and all intermediate nodes, including queuing time, packet transmission and propagation, and retransmissions at the MAC layer. The queuing time can be caused by network
congestion or unavailability of valid routes. It is measured in milli- seconds
Dropped Packets: Dropping of a packet will occur during a collision/error or due to other failure in routing process. Here the dropped packet count is the number of data packets that are not successfully sent or forwarded to the destination. It is measured in Numbers.
Throughput: The throughput metric measures how well the network can constantly provide data to the sink. Throughput is the number of bytes or bits arriving at the sink over time. It is generally measured in kilo bits per second or Mega Bits per second.
Energy Consumption: The average of the total consumed energy of all the nodes of the network. It is measured in Joules.
Mac Load: The ratio of the number of MAC layer messages propagated by every node in the network and the number of data packets successfully delivered to all destination nodes. In other words, the MC load means the average number of MAC messages generated to each data packet successfully delivered to the destination.
The Overhead: We also used the number of generated and forwarded routing messages as separate metric to understand the routing overhead in the scenario.
4.3 Simulation Parameters
The following table shows the some of the important parameters of the simulation. In our simulations, we used very low rate traffic because; we may consider this topology as a model for sensor network topology also.
Table 2: Parameters of the Simulation
Routing Protocols Total Nodes
AOMDV, MDART 40
Transmission Ranges
Rx Power
Idle Power Initial Node Energy
100m, 150m, 200m, 250m, 300m, 350m, 400m, 450m, 500m & 550m
0.2819 mw 0.14 mw 1000 Joules
Antenna Model Omni Antenna Propagation Model Two Ray Ground
Mac Type 802.11
Interface queue type DropTail/PriQueue
Topological Area 800 m X 800 m Node speed
Pause Time
10 m/s 10 s
CBR Traffic Parameters Interval : 1.0 sec
5. RESULTS AND DISCUSSION
The graphs in the following page shows the performance of the routing protocols with respect to different transmission range of the nodes. The values derived for each of the protocols are shown in Table 3 and Table 4 in Annexure I.
The following graph shows the performance of the two multi-path routing protocols in terms of overhead. As shown in the figure 1, the overhead in the case of MDART was very higher than AOMDV. But the overhead seems to be reducing along with the increase in transmission range.
Figure 1, Transmission Range vs Overhead The following graph shows the performance of the protocols in terms of average consumed energy. As shown in the figure 2, the MDART protocol consume much energy than the other protocols. Further, the average energy consumption seems to be incerasing along with the increase in transmission range. Between the range 250m to 450 m, the power consumption of MDART was low.
Figure 2, Transmission Range vs. Average Consumed Energy
The following graph shows the performance of the protocols in terms of end to end delay. As shown in the figure 3, the end do end delay below the transmission range of 250 was high. During low transmission power, the routing will happen through multiple hops and hence increase the end to end delay. But beyond the 300 m transmission range, the enf to end delay was very much reduced to a very lower level. Below 300m transmission
ranges, MDART provided poor performance than AOMDV.
Figure 3, Transmission Range vs. End to End Delay The following graph shows the performance of the protocols in terms of dropped packets. As shown in the figure 4, the protocols actually drop packet only during low transmission power. But beyond the 400m transmission range, the packet dropping was almost zero. Below 300m transmission ranges, MDART provided poor performance than AOMDV.
Figure 4, Transmission Range vs. Dropped Packets The following graph shows the performance of the protocols in terms of routing load. As shown in the figure 5, the protocols actually experience much routing load only during using low transmission power. But beyond the 300m transmission range, the routing load becomes almost constant. Below 300m transmission ranges, MDART provided poor performance than AOMDV.
Volume: 04 Issue: 05 Pages: 1737-1743 (2013) ISSN : 0975-0290
The following graph shows the performance of the protocols in terms of MAC load. As shown in the figure 6, the protocols actually experience much MAC load only during low transmission power. But beyond the 300m transmission range, the MAC load becomes very minimum and was almost constant. MDART provided overall poor performance than AOMDV.
Figure 6, Transmission Range vs. MAC Load The following graph shows the performance of the protocols in terms of PDF. As shown in the figure 7, the protocols provided poor packet delivery ratio during using low transmission power in the nodes. But beyond the 350m of the transmission range, the PDF was ideal and becomes almost constant. Below 300m transmission ranges, MDART provided poor performance than AOMDV.
Figure 7, Transmission Range vs. Packet Delivery Fraction
The following throughput graph looks exactly similar to the previous PDF graph. The only difference is the y axis metric. In the throughput graph, it is given in kbps. Below 300m transmission ranges, MDART provided poor performance than AOMDV.
Figure 8, Transmission Range vs. Throughput
The two routing algorithms performed almost equal while the transmission ranges of the nodes were half the length of the topological area. In other words, if all the nodes in the network can be reached one or two hops from any other node, then all the routing algorithms provided equal performance. We can understand this fact by closely observing the graphs after the Tx Range of 400 (half the length of topology). In fact, the two compared MANET routing algorithm can be classified as good or bad only based on its performance while the transmission ranges of the nodes were below the range of 350 or 400 meters.
6. CONCLUSION AND FUTURE WORK
We successfully evaluated the performance of routing protocols under different levels of transmission range/power of the nodes. Obviously the change in transmission range/power has a significant impact on the performance of the routing protocols. The multi-path routing protocols were not energy efficient throughout all the range of transmissions. While comparing the two, AOMDV performed better than MDART. The results in the previous section prove that fact.
The multi-hop nature in routing protocols delivers acceptably good performance only at particular levels of transmission ranges/powers. Even though the use of ‘high’ transmission range/power will reduce lot of overheads and give excellent performance, we cannot use any arbitrarily high level of transmission power in most of the applications like sensor networks.
It means the power aware routing protocol should also be aware of the size of the topology under which it is functioning. Further, it should use that “topology length/breadth” information while making decisions in reducing or changing the transmission power of any individual nodes in the network.
Considering all the facts identified during this experiments, one may design a more efficient, power aware and topology aware routing protocol for MANET. Our future work will address these issues and propose a new power aware routing protocol.
REFERENCES
[1] H.D.Trung, W.Benjapolakul, P.M.Duc, “Performance evaluation and comparison of different ad hoc routing protocols”, Department of Electrical Engineering, Chulalongkorn University, Bangkok, Thailand, May 2007.
[2] “Mobile Ad hoc Networking (MANET): Routing Protocol Performance Issues and Evaluation Considerations” http://www.ietf.org/rfc/rfc2501.txt [3] Performance Comparison of Mobile Ad-hoc network
Routing Protocol, International Journal of Computer Science and Network Security (IJCSNS), VOL.7 No.11, pp. 77-84 November 2007.
[4] Jing Deng, Yunghsiang S. Han, Po-Ning Chen, Pramod K. Varshney “Optimal Transmission Range for Wireless Ad Hoc Networks Based on Energy Efficiency” IEEE Transactions On Communications, Vol. 55, No. 9, September 2007.
[5] P. Chen, B. O’Dea, and E. Callaway, “Energy efficient system design with optimum transmission range for wireless ad hoc networks,” in Proc. IEEE ICC, 2002, pp. 945–952.
[6] Y.-C. Tseng and T.-Y. Hsieh, “Fully power-aware and location-aware protocols for wireless multi-hop ad hoc networks”, Proc. 11th Int’l Conf. on Computer Communications and Networks, Oct. ‘02, pp.608-613.
[7] J. Gomez, A. Campbell, M. Naghshineh and C. Bisdikian, “PARO: A Power-Aware Routing Optimization Scheme for Mobile Ad hoc Networks”, draft-gomez-paro-manet-00.txt, IETF, Work in Progress, February 2001.
[8] Ingo Gruber, Oliver Knauf and Hui Li,” Performance of Ad Hoc Routing Protocols in Urban Environments”, In Proceedings of European Wireless 2004 (EW'2004,Barcelona, Spain, February 24 - 27, 2004), Barcelona, Spain.
[9] http://www.cubinlab.ee.unimelb.edu.au/~jrid/Docs/M anuel-NS2/node196.html
[10] www.isi.edu/~weiye/pub/propagation_ns.pdf
[11] Arne Schmitz, Martin Wenig, ”The Effect of the Radio Wave Propagation Model in Mobile AdHoc Networks”, Torremolinos, Malga, Spain, MSWiM’06, October 2-6,2006
[12] Ibrahim Khider Eltahir, “The Impact of Different Radio Propagation Models for Mobile Ad hoc NETworks (MANET) in Urban Area Environment”, The 2nd International Conference on Wireless Broadband and Ultra Wideband Communications (AusWireless 2007)
[13] Elizabeth M.Royer, Charles E. Perkins “An Implementation study of AODV routing protocol” IEEE, 0-7803-6596- 8/00, 2000.
[14]J. Eriksson, M. Faloutsos and S. Krishnamurthy. “DART: Dynamic Address RouTing for Scalable Ad Hoc and Mesh Networks”. In IEEE- ACM Transactions on Networking, vol. 15, no. 1, April 2007, pp. 119-132.
[15] M. Z. Oo, M. Othman, “Performance Comparisons of AOMDV and OLSR Routing Protocols for Mobile Ad Hoc Network”, Second International Conference on Computer Engineering and Applications (ICCEA), 2010.
[16]J. Eriksson, M. Faloutsos and S. Krishnamurthy.“DART: Dynamic Address RouTing for Scalable Ad Hoc and Mesh Networks”. in IEEE- ACM Transactions on Networking, vol. 15, no. 1, April 2007, pp. 119-132.
[17]Marcello Caleffi and Luigi Paura, M-DART: multi-path dynamic address routing WIRELESS COMMUNICATIONS AND MOBILE COMPUTING 2011; 11:392–409 Published online 1 July 2010 in Wiley Online Library (wileyonlinelibrary.com). DOI: 10.1002/wcm.986 [18]K. Fall and K. Varadhan, “ns notes and
documentation”, the VINT Project, UC Berkeley, LBL, USC/ISI, and Xerox PARC, November 1997. Available from http://www-mash.cs.berkeley.edu/ns/.
Authors Biography
V.Lalitha, M.Sc, M.C.A, M.Phil is working as Assistant Professor in Computer Science, Govt. Arts College for women, Pudukkottai, India. Her area of interest is Mobile Ad Hoc Networks. She has more than 10 years of teaching experience and 5years of research experience.
Volume: 04 Issue: 05 Pages: 1737-1743 (2013) ISSN : 0975-0290
ANNEXURE I
The following table shows analysis results of the AOMDV routing protocol
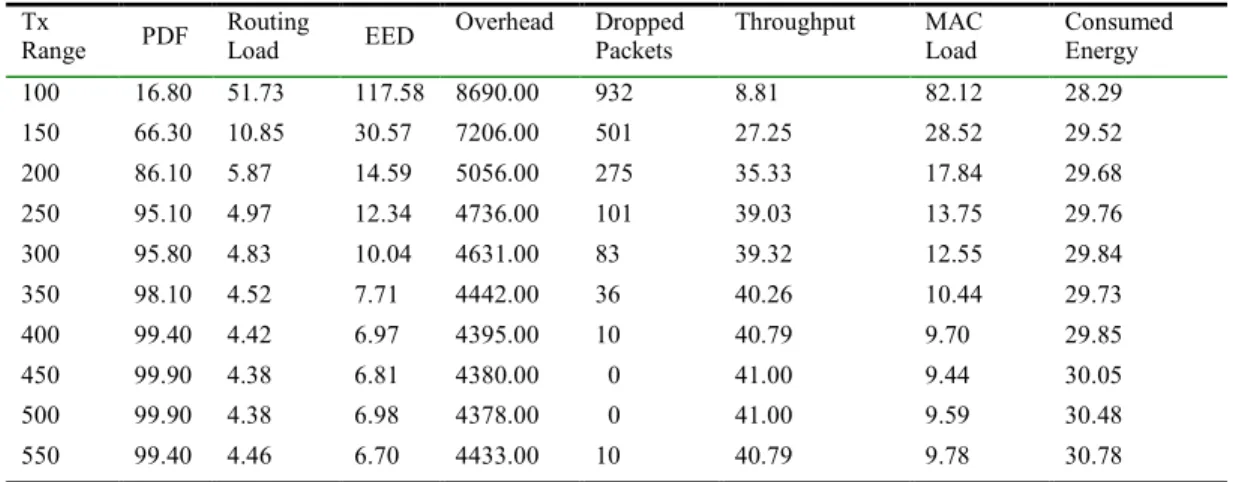
Table 3 :The Results of AOMDV Routing Protocol
Tx
Range PDF
Routing
Load EED
Overhead Dropped Packets
Throughput MAC Load
Consumed Energy
100 16.80 51.73 117.58 8690.00 932 8.81 82.12 28.29
150 66.30 10.85 30.57 7206.00 501 27.25 28.52 29.52
200 86.10 5.87 14.59 5056.00 275 35.33 17.84 29.68
250 95.10 4.97 12.34 4736.00 101 39.03 13.75 29.76
300 95.80 4.83 10.04 4631.00 83 39.32 12.55 29.84
350 98.10 4.52 7.71 4442.00 36 40.26 10.44 29.73
400 99.40 4.42 6.97 4395.00 10 40.79 9.70 29.85
450 99.90 4.38 6.81 4380.00 0 41.00 9.44 30.05
500 99.90 4.38 6.98 4378.00 0 41.00 9.59 30.48
550 99.40 4.46 6.70 4433.00 10 40.79 9.78 30.78
The following table shows the analysis results of the MDART routing protocol Table 4 :The Results of MDART Routing Protocol
Tx
Range PDF
Routing
Load EED Overhead
Dropped Packets
Throughput (kbps)
MAC Load
Consumed Energy
100 6.10 195.84 319.85 11946.00 1035 3.40 1117.82 31.28 150 28.90 53.01 284.92 15319.00 1057 11.87 333.84 36.16 200 52.60 28.08 91.22 14799.00 760 21.60 160.21 38.09 250 76.40 17.93 33.26 13720.00 390 31.39 82.47 37.81 300 94.40 13.23 16.74 12503.00 100 38.74 41.88 35.52 350 99.20 12.22 10.13 12131.00 38 40.71 31.23 35.03 400 99.70 12.03 7.84 12009.00 3 40.91 29.45 35.75