AMTD
6, 5751–5794, 2013A microfluidic measurement of
glyoxal and methylglyoxal
X. Pang et al.
Title Page
Abstract Introduction
Conclusions References
Tables Figures
◭ ◮
◭ ◮
Back Close
Full Screen / Esc
Printer-friendly Version Interactive Discussion
Discussion
P
a
per
|
D
iscussion
P
a
per
|
Discussion
P
a
per
|
Discuss
ion
P
a
per
|
Atmos. Meas. Tech. Discuss., 6, 5751–5794, 2013 www.atmos-meas-tech-discuss.net/6/5751/2013/ doi:10.5194/amtd-6-5751-2013
© Author(s) 2013. CC Attribution 3.0 License.
Atmospheric Measurement
Techniques
Open Access
Discussions
Geoscientiic Geoscientiic
Geoscientiic Geoscientiic
This discussion paper is/has been under review for the journal Atmospheric Measurement Techniques (AMT). Please refer to the corresponding final paper in AMT if available.
A smog chamber comparison of
a microfluidic derivatization measurement
of gas-phase glyoxal and methylglyoxal
with other analytical techniques
X. Pang1,3, A. C. Lewis2, A. Richard2, M. T. Baeza-Romero4, T. J. Adams5, S. M. Ball5, M. J. S. Daniels5, I. C. A. Goodall5, P. S. Monks5, S. Peppe6, M. Ródenas García7, P. Sánchez7, and A. Muñoz6
1
Department of Chemistry, University of York, Heslington, York, YO10 5DD, UK 2
National Centre for Atmospheric Science, University of York, Heslington, York, YO10 5DD, UK 3
Key Laboratory for Aerosol-Cloud-Precipitation of China Meteorological Administration, Nanjing University of Information Science and Technology, Nanjing, 210044, China 4
Escuela de Ingeniería Industrial de Toledo, Universidad de Castilla la Mancha, Toledo, 45071, Spain
5
Department of Chemistry, University of Leicester, University Road, Leicester, LE1 7RH, UK 6
School of Earth and Environment, University of Leeds, Woodhouse Lane, Leeds, LS2 9JT, UK
7
AMTD
6, 5751–5794, 2013A microfluidic measurement of
glyoxal and methylglyoxal
X. Pang et al.
Title Page
Abstract Introduction
Conclusions References
Tables Figures
◭ ◮
◭ ◮
Back Close
Full Screen / Esc
Printer-friendly Version Interactive Discussion
Discussion
P
a
per
|
D
iscussion
P
a
per
|
Discussion
P
a
per
|
Discuss
ion
P
a
per
|
Received: 8 April 2013 – Accepted: 5 June 2013 – Published: 24 June 2013
Correspondence to: A. C. Lewis ([email protected])
AMTD
6, 5751–5794, 2013A microfluidic measurement of
glyoxal and methylglyoxal
X. Pang et al.
Title Page
Abstract Introduction
Conclusions References
Tables Figures
◭ ◮
◭ ◮
Back Close
Full Screen / Esc
Printer-friendly Version Interactive Discussion
Discussion
P
a
per
|
D
iscussion
P
a
per
|
Discussion
P
a
per
|
Discuss
ion
P
a
per
|
Abstract
A microfluidic lab-on-a-chip derivatization technique has been developed to measure part per billion volume (ppbV) mixing ratios of gaseous glyoxal (GLY) and methylglyoxal (MGLY), and the method compared with other techniques in a smog chamber exper-iment. The method uses o-(2,3,4,5,6-pentafluorobenzyl) hydroxylamine (PFBHA) as 5
a derivatization reagent and a microfabricated planar glass micro-reactor comprising an inlet, gas and fluid splitting and combining channels, mixing junctions, and a heated capillary reaction microchannel. The enhanced phase contact area-to-volume ratio and the high heat transfer rate in the micro-reactor result in a fast and highly efficient derivatization reaction, generating an effluent stream ready for direct introduction to 10
a gas chromatograph-mass spectrometer (GC-MS). A linear response for GLY was ob-served over a calibration range 0.7 to 400 ppbV, and for MGLY of 1.2 to 300 ppbV, when derivatized under optimal reaction conditions. The method detection limits (MDLs) were 80 pptV and 200 pptV for GLY and MGLY respectively, calculated as 3 times the stan-dard deviation of theS/Nof the blank sample chromatograms. These MDLs are below 15
or close to typical concentrations in clean ambient air. The feasibility of the technique was assessed by applying the methodology under controlled conditions to quantify of α-dicarbonyls formed during the photo-oxidation of isoprene in a large scale outdoor atmospheric simulation chamber (EUPHORE). Good general agreement was seen be-tween microfluidic measurements and Fourier Transform Infra Red (FTIR), Broad Band 20
Cavity Enhanced Absorption Spectroscopy (BBCEAS) and a detailed photochemical chamber box modelling calculation for both GLY and MGLY. Less good agreement was found with Proton-Transfer Reaction Time-of-Flight Mass Spectrometry (PTR-ToF-MS) and Solid Phase Microextraction (SPME) derivatization methods for MGLY measure-ment.
AMTD
6, 5751–5794, 2013A microfluidic measurement of
glyoxal and methylglyoxal
X. Pang et al.
Title Page
Abstract Introduction
Conclusions References
Tables Figures
◭ ◮
◭ ◮
Back Close
Full Screen / Esc
Printer-friendly Version Interactive Discussion
Discussion
P
a
per
|
D
iscussion
P
a
per
|
Discussion
P
a
per
|
Discuss
ion
P
a
per
|
1 Introduction
Glyoxal (GLY, CH(O)CHO) and methylglyoxal (MGLY, CH3C(O)CHO) are the most
prevalent α-dicarbonyls in the ambient atmosphere. They are found ubiquitously in urban, rural and remote ambient air owing to their wide variety of sources. Both α -dicarbonyls are generated by the photochemical oxidation of anthropogenic and bio-5
genic volatile organic compounds (VOCs) (Henry et al., 2012). They are important pri-mary ring opening products in the OH initiated oxidation of monoaromatic compounds in the presence of NOX (NO and NO2) (Calvert et al., 2002) and are photo-oxidation
products from isoprene degradation as well as other biogenic VOCs (Calvert et al., 2000). Moreover, GLY and MGLY have attracted recent attention as potentially impor-10
tant contributors to global secondary organic aerosol (SOA) (Volkamer et al., 2009; Hallquist et al., 2009; Hoffmann et al., 1997), which can significantly impact climate, air quality and human health (Solomon, 2007; Mauderly and Chow, 2008). They are highly water-soluble and can form SOA through their uptake into the aqueous phase of an aerosol particle or cloud droplets, followed by aqueous-phase reactions that lead 15
to the formation of low-volatility organosulphate/oligomeric products (De Haan et al., 2009; Fu et al., 2008; Loeffler et al., 2006). GLY was reported to account for up to 15 % of the mass of SOA in Mexico city (Volkamer et al., 2007).
However observations of α-dicarbonyls are rather limited, especially in rural and remote regions, where their mixing ratios are in the parts per trillion range, but can 20
vary considerably depending on location. Low tens to hundreds of pptV concentrations (GLY: 15–1820 pptV and MGLY: 50–320 pptV) have been reported in rural, urban, and marine/open ocean environments (Lee et al., 1995; Munger et al., 1995; Spaulding et al., 2003; Fu et al., 2008; Huisman et al., 2008; Vrekoussis et al., 2009; Sinreich et al., 2010). Gaseous GLY concentrations have been observed up to 1.82 ppbV in 25
AMTD
6, 5751–5794, 2013A microfluidic measurement of
glyoxal and methylglyoxal
X. Pang et al.
Title Page
Abstract Introduction
Conclusions References
Tables Figures
◭ ◮
◭ ◮
Back Close
Full Screen / Esc
Printer-friendly Version Interactive Discussion
Discussion
P
a
per
|
D
iscussion
P
a
per
|
Discussion
P
a
per
|
Discuss
ion
P
a
per
|
most abundant VOC emitted into the atmosphere, with an estimated annual emission from the biosphere of 500 Tg yr−1of isoprene (Guenther et al., 1995). Other important sources ofα-dicarbonyls include the oxidation of unsaturated hydrocarbons like acety-lene (GLY only) (Fu et al., 2008), and alkenes (Calvert et al., 2000) (e.g. 2-methyl-3-buten-2-ol (Chan et al., 2009), methyl substituted ethenes (Volkamer et al., 2007) 5
and, monoaromatics (Tuazon et al., 1984) (e.g. benzene (GLY only), toluene, xylene and 1,3,5-trimethylbenzene (MGLY only), Volkamer et al., 2007, 2005). MGLY is also formed from the oxidation of acetone (Fu et al., 2008), hydroxyacetone and various oxygenated alkenes (e.g. methylacrolein and methylvinylketone, Galloway et al., 2011) with GLY formed from glycolaldehyde, acrolein and crotonaldehyde, which are impor-10
tant components of biomass burning plumes (Magneron et al., 2005).
GLY and MGLY are reactive and have lifetimes of the order of a few hours during the daytime. Their atmospheric sinks are controlled primarily by photolysis, reaction with OH and heterogeneous processes (Volkamer et al., 2005; Fu et al., 2008). Therefore, bothα-dicarbonyls have been used as tracers of local vs. regional photochemistry of 15
biogenic and anthropogenic VOCs, since their short lifetimes inhibit their long-range transport (Henry et al., 2012; Volkamer et al., 2007). Additionally, the photolysis of GLY and MGLY can be a significant source of tropospheric HOx (HO+HO2) and their
reactions with OH can contribute to the tropospheric burden of ozone (Henry et al., 2012). Sinceα-dicarbonyls form as part of, and contribute to, the complex intermediary 20
atmospheric chemistry of both ozone and SOA formation, they are attractive species to measure in order to test our fundamental chemical understanding, under a variety of atmospheric regimes, through mechanism evaluation of chemistry incorporated into predictive policy and scientific models (e.g. the Master Chemical Mechanism) (Jenkin et al., 2003).
25
measure-AMTD
6, 5751–5794, 2013A microfluidic measurement of
glyoxal and methylglyoxal
X. Pang et al.
Title Page
Abstract Introduction
Conclusions References
Tables Figures
◭ ◮
◭ ◮
Back Close
Full Screen / Esc
Printer-friendly Version Interactive Discussion
Discussion
P
a
per
|
D
iscussion
P
a
per
|
Discussion
P
a
per
|
Discuss
ion
P
a
per
|
ment ofα-dicarbonyls including Differential Optical Absorption Spectroscopy (DOAS) (Volkamer et al., 2005; MacDonald et al., 2012), Broad Band Cavity Enhanced Ab-sorption Spectroscopy (BBCEAS) (Thalman and Volkamer, 2010; Washenfelder et al., 2008), Laser-Induced Phosphorescence (LIP) Spectrometry (Henry et al., 2012), and Fourier Transform InfraRed (FTIR) absorption spectroscopy (Connelly et al., 2012; Pro-5
feta et al., 2011). DOAS is a well-established technique used to identify trace gases by means of their individual differential (i.e., narrow band) absorption structures. Volkamer et al. demonstrated long-path differential optical absorption spectroscopy (LP-DOAS) in Mexico City to detect GLY with a detection limit of 150 pptV using an atmospheric path length of 4420 m and integration times between 2 to 15 min (Volkamer et al., 2005). GLY 10
above a south-east Asian tropical rainforest was measured by LP-DOAS and multi-axis (MAX) DOAS with a maximum mixing ratio of 1.6 ppbV observed (MacDonald et al., 2012). Broadband methods based on making absorption measurements on gas sam-ples within high finesse optical cavities are a promising, emerging detection technique for many atmospheric trace gases with broad, structured absorptions in the visible and 15
ultraviolet spectral regions (Thalman and Volkamer, 2010; Washenfelder et al., 2008, 2011; Langridge et al., 2008). Cavity Enhanced Differential Optical Absorption Spec-troscopy (CE-DOAS) has been shown to be capable of sensitive, in situ single point measurements of GLY with method detection limit (MDL) as low as 28.5 pptV with one minute averaging and MGLY with MDL of 170 pptV with one minute averaging (Thalman 20
and Volkamer, 2010). A similar spectroscopic method, Broad Band Cavity Enhanced Absorption Spectroscopy (BBCEAS) can achieve a MDL for GLY of 87 pptV with one minute averaging (Washenfelder et al., 2008). Huisman et al. recently demonstrated a Laser-Induced Phosphorescence (LIP) technique for GLY measurement with a MDL of 18 pptV in one minute and high time resolution (up to 3 Hz) (Huisman et al., 2008, 25
AMTD
6, 5751–5794, 2013A microfluidic measurement of
glyoxal and methylglyoxal
X. Pang et al.
Title Page
Abstract Introduction
Conclusions References
Tables Figures
◭ ◮
◭ ◮
Back Close
Full Screen / Esc
Printer-friendly Version Interactive Discussion
Discussion
P
a
per
|
D
iscussion
P
a
per
|
Discussion
P
a
per
|
Discuss
ion
P
a
per
|
In fact, many of the optical methods reviewed above require some highly specialist, or high maintenance equipment, or potentially require a dedicated instrument for the measurement of individual α-dicarbonyls. More commonly available, FTIR is a well-established means to measure atmospheric gases and has been proven particularly useful as a benchmark standard for inter-comparison studies in polluted urban atmo-5
spheres (Finlayson-Pitts and Pitts Jr., 1999). However, one drawback in the application of FTIR to ambient air is that water, CO2 and CH4, which are all present in significant concentrations and absorb strongly in certain regions of the spectrum, limit the spectral regions accessible for ambient air measurements (Finlayson-Pitts and Pitts Jr., 1999).
Global GLY measurements have recently become available from satellites. Sev-10
eral space-borne imaging UV-VIS-near IR spectrometers have been used to observe GLY from space and retrieve global total column GLY datasets, including the SCan-ning Imaging Absorption SpectroMeter for Atmospheric CartograpHY (SCIAMACHY), Global Ozone Monitoring Experiment (GOME) and GOME-2 instruments (Vrekoussis et al., 2009, 2010; Wittrock et al., 2006). Importantly, however, such satellites mea-15
surements, based on complex retrievals, require extensive validation by in situ mea-surements on the ground, ideally over a wide range of spatial and temporal scales. Satellite observations are good for providing a global picture of distribution but they may only typically produce one pixel of information to cover a whole city, which does not provide enough information if, for example, researchers want to use GLY and MGLY 20
as a tracer for fast photochemistry. Therefore, the complementarity of detailed in situ measurements and satellite observation is required.
A common and versatile method for GLY and MGLY measurement uses the prin-ciple of chemical derivatization with a derivatization reagent, such as o -(2,3,4,5,6-pentafluorobenzyl)hydroxylamine (PFBHA) (Ho and Yu, 2002; Temime et al., 2007), 25
AMTD
6, 5751–5794, 2013A microfluidic measurement of
glyoxal and methylglyoxal
X. Pang et al.
Title Page
Abstract Introduction
Conclusions References
Tables Figures
◭ ◮
◭ ◮
Back Close
Full Screen / Esc
Printer-friendly Version Interactive Discussion
Discussion
P
a
per
|
D
iscussion
P
a
per
|
Discussion
P
a
per
|
Discuss
ion
P
a
per
|
been used widely in the measurement ofα-dicarbonyl species since they allow trace-level measurements to be made with commonly available and reasonably low cost GC-MS technology. An advantage of this type of approach is that it yields information on the complete ensemble of carbonyl compounds from HCHO to high molecular weight OVOCs.
5
The sample preparation methodology in general consists of trapping gaseous GLY and MGLY on solid absorbents or filters coated with the derivatization reagent or en-training GLY and MGLY into solution using a bubbler or impinger. The resulting deriva-tives can subsequently be desorbed by an appropriate solvent, concentrated and then separated and detected by GC-MS or HPLC-UV. Such methods have acceptable sen-10
sitivity, good reproducibility and the considerable advantage of being able to quantify multiple compounds simultaneously. Although derivatization methods are fully applica-ble for the measurement of GLY and MGLY, the drawbacks are long sampling times, typically 1–2 h, with a lengthy and complicated lab procedure of derivatization and sol-vent extraction/evaporation following sampling of ambient air. Sampling times can be 15
reduced to 10 min or less using the method of PFBHA on-fibre derivatization with Solid Phase Microextraction (SPME). However, the detection range of the SPME technique is limited to higher concentrations compared with other derivatization techniques owing to only small quantities of derivatization reagent absorbing on the fibre (Gomez Al-varez et al., 2009). Furthermore, the preparation processes for PFBHA-coated SPME 20
are complicated and labour intensive. This creates a considerable experimental over-head if the aim is to sample continuously over an extended time period. It is clear that substantial benefits may be gained from the employment of a methodology which can utilise the universality of a GC-MS method whilst eliminating the bench chemistry required for sample preparation. The key to making major improvements in GLY and 25
MGLY measurements may therefore lie in near-automated sample preparation.
micro-AMTD
6, 5751–5794, 2013A microfluidic measurement of
glyoxal and methylglyoxal
X. Pang et al.
Title Page
Abstract Introduction
Conclusions References
Tables Figures
◭ ◮
◭ ◮
Back Close
Full Screen / Esc
Printer-friendly Version Interactive Discussion
Discussion
P
a
per
|
D
iscussion
P
a
per
|
Discussion
P
a
per
|
Discuss
ion
P
a
per
|
reactor. The micro-reactor provided a zone for gas sample mixing, chemical reac-tion and pre-concentrareac-tion, essentially replacing three independent offline preparative steps: hence we use the “lab-on-a-chip” moniker for the methodology. This methodol-ogy for GLY and MGLY builds on our previous reported techniques used to measure gas phase formaldehyde (Pang and Lewis, 2012). The micro-reactor comprises a pla-5
nar Pyrex glass microfluidic chip containing a long circular cross section micro-channel, providing a capillary volume for the reaction to occur in. The microfluidic technique re-alises a near real-time analysis based on the rapid derivatization reaction occurring simultaneously with air sampling at high chip temperatures, and without any post-derivatization treatment necessary on the samples. Combining the micro-reactor with 10
the auto-sampler of a commercial GC-MS allows for continuous sampling and analysis with a time resolution of around 30 min or less.
The performance of the microfluidic derivatization technique is evaluated in this pa-per through simultaneous measurement of gaseous GLY and MGLY in various expa-per- exper-iments performed at the European Photoreactor (EUPHORE), a highly instrumented, 15
large-scale outdoor atmospheric simulation chamber located in Valencia, Spain. The microfluidic derivatization technique was compared with FTIR, BBCEAS, PTR-ToF-MS, and SPME observations as well as with a detailed model simulation of the temporal evolution of GLY and MGLY formed during the photo-oxidation of isoprene.
2 Experimental
20
2.1 Micro-reactor layout and analytical system
The layout of the micro-reactor is shown in Fig. 1a. The microfluidic chip was installed with a chip holder and chip header to allow quick connection to 1/16th inch external di-ameter tubing through its three inlets and one outlet (Fig. 1a). The detailed description of the micro-reactor can be seen on our previous study (Pang and Lewis, 2012) In this 25
AMTD
6, 5751–5794, 2013A microfluidic measurement of
glyoxal and methylglyoxal
X. Pang et al.
Title Page
Abstract Introduction
Conclusions References
Tables Figures
◭ ◮
◭ ◮
Back Close
Full Screen / Esc
Printer-friendly Version Interactive Discussion
Discussion
P
a
per
|
D
iscussion
P
a
per
|
Discussion
P
a
per
|
Discuss
ion
P
a
per
|
reactor, (2) reagent heating, and (3) sample pre-concentration. Gaseous mixtures con-taining GLY and MGLY are drawn into the micro-reactor through inlet 2 and inlet 3 by the clean air pump. The PFBHA derivatization solution was introduced into the micro-reactor simultaneously through inlet 1 by a peristaltic pump (Watson Marlow 205S, UK) (see Fig. 1b). The micro-reactor was fixed securely on the surface of a hotplate head 5
for direct heating. GLY and MGLY in the gas stream reacted with PFBHA with high efficiency in the micro-channel through diffusion into the derivatization solution which formed a laminar layer on the channel walls, analogous to a capillary chromatography stationary phase (Pang and Lewis, 2012). A stainless metal coil (50 cm in length) was connected to the outlet of the micro-reactor, and placed in an ice-salt bath with a tem-10
perature of 0◦C. The reaction solution eluting from the stainless coil was collected directly into a sample vial within the auto-sampler of the GC-MS (Fig. 1b).
2.2 Materials and apparatus
All chemicals (unless otherwise stated) were purchased from Sigma-Aldrich Company. Solvents including acetonitrile, methanol, ethanol, ethyl acetate, 2-propanol (HPLC 15
grade) were purchased from Fisher (UK). The derivatization reagent o -(2,3,4,5,6-pentafluorobenzyl) hydroxylamine (PFBHA) (99 %), was used directly in this study without any further purification. The sample gases matrix including GLY, MGLY was pumped into the micro-reactor using a clean KNF diaphragm gas pump (PM20994-022, Neuberger, Germany). Flow rate of sample gas was controlled by a mass flow controller 20
(Model GFC17, Aalborg, USA), itself calibrated by a gas flow meter (Alicat Scientific, USA). Flow of the derivatization solution was generated and controlled by a peristaltic pump, varying from 20–120 µL min−1. A magnetic stirrer hotplate (RH Basic 2 IKA-MAG, UK) with a contact thermometer was used to heat the microchip directly. Sepa-ration and detection of the PFBHA derivatives of GLY and MGLY were performed on 25
a GC-MS system incorporating a Perkin Elmer (USA) Auto system XLGC and a Turbo Mass (USA) quardrupole MS equipped with a DB5 column (60 m×0.25 mm×1.0 µm,
AMTD
6, 5751–5794, 2013A microfluidic measurement of
glyoxal and methylglyoxal
X. Pang et al.
Title Page
Abstract Introduction
Conclusions References
Tables Figures
◭ ◮
◭ ◮
Back Close
Full Screen / Esc
Printer-friendly Version Interactive Discussion
Discussion
P
a
per
|
D
iscussion
P
a
per
|
Discussion
P
a
per
|
Discuss
ion
P
a
per
|
oven temperature was initially set at 80◦C for two minutes, programmatically ramped to 300◦C with a temperature ramp of 8◦C min−1 and then held at 300◦C for 1.5 min. The solvent delay was set at 10 min to avoid possible damage to the MS detector. The GC injection mode was set as splitless. The temperatures of the GC inlet and GC-MS transfer line were kept at 250◦C. The mass spectrometer was operated in scan mode 5
with a mass range of 100–500 Da to identify the most abundant ions. The selected ion chromatograms of the most abundant ion ([C6F5CH2]+) with m/z=181 Da, which is a fragment of the PFBHA molecule, were used to quantify the concentration of deriva-tives in solution.
2.3 Description of EUPHORE chamber and instrumentation
10
All experiments were performed in the European Photo-Reactor (EUPHORE), located in Valencia, Spain during the period of 28 June to 2 August 2012. EUPHORE consists of two hemispherical FEP (fluorine ethene propene) chambers mounted on aluminium floor panels. The FEP foil is highly transparent even to short-wavelength sunlight. The chamber used in the present study has a volume of 200 m3 and is protected by re-15
tractable hemispherical shutters when it is not in use or the presence of sunlight is not required. The chamber is operated at ambient temperature and approximately atmo-spheric pressure using purified air, while two large fans provide homogeneous mixing of the chamber contents.
The chamber is equipped with a multi-pass White-Cell mirror system for long path 20
in situ monitoring of gaseous reactants and products by FTIR spectrometry. The spec-trometer (NICOLET 550, MCT/B-detector) is coupled to the long-path multi-reflection cell for detection in the IR spectral range (400–4000 cm−1). The gold-coated mirrors of the cell allow for a total path length of 616 m. Spectra are collected with 1 cm−1 resolution by averaging 280 scans, resulting in a sampling time of 5 min per spec-25
AMTD
6, 5751–5794, 2013A microfluidic measurement of
glyoxal and methylglyoxal
X. Pang et al.
Title Page
Abstract Introduction
Conclusions References
Tables Figures
◭ ◮
◭ ◮
Back Close
Full Screen / Esc
Printer-friendly Version Interactive Discussion
Discussion
P
a
per
|
D
iscussion
P
a
per
|
Discussion
P
a
per
|
Discuss
ion
P
a
per
|
aldehydic C-H band, within the spectral region of 2750–2900 cm−1for GLY and 2750– 2920 cm−1for MGLY. For the calibration of gases measured by FTIR, GLY was injected into the chamber with a syringe in repeated trials while MGLY was cross-calibrated against DOAS. The linear range of FTIR measurement for GLY is 2.5 ppbV–3.5 ppmV with MDL 2.5 ppbV and for MGLY is 2.7 ppbV–4.2 ppmV with MDL 2.7 ppbV. The accu-5
racy is estimated to be 8 % for GLY measurement and 15 % for MGLY measurement for FTIR in this study.
A custom-built Broadband Cavity Enhanced Absorption Spectroscopy (BBCEAS) in-strument was also employed to monitor GLY and MGLY. The BBCEAS inin-strument has been developed for highly sensitive and target-selective in situ trace gas measure-10
ments building on previous instrument development work for quantifying atmospheric NO2and NO3(Langridge et al., 2008). A blue light emitting diode (LED) is employed as the light source, enabling simultaneous measurements of GLY, MGLY and NO2 to be
made using these molecules’ distinctive spectral signatures in the wavelength range 430–488 nm. In the configuration deployed at the EUPHORE chamber, the BBCEAS 15
instrument has a 3σ method detection limit (MDL) of 75 pptV for GLY and 1.05 ppbV for MGLY in 10 s against a background containing no other absorption signals. The accuracy of the BBCEAS measurements is determined by two main considerations: (i) uncertainties in the reference absorption cross sections used to fit the differential spectral structure in the BBCEAS spectra to retrieve the target absorber concentra-20
tions, and (ii) uncertainties in determining the reflectivity of the cavity mirrors (i.e. the effective path length of the BBCEAS absorption measurement) and the proportion of the cavity occupied by the gas sample (the cavity mirrors are purged with synthetic air to prevent contamination). The overall accuracies of the BBCEAS measurements are estimated to be 7 % for GLY and 10 % for MGLY.
25
AMTD
6, 5751–5794, 2013A microfluidic measurement of
glyoxal and methylglyoxal
X. Pang et al.
Title Page
Abstract Introduction
Conclusions References
Tables Figures
◭ ◮
◭ ◮
Back Close
Full Screen / Esc
Printer-friendly Version Interactive Discussion
Discussion
P
a
per
|
D
iscussion
P
a
per
|
Discussion
P
a
per
|
Discuss
ion
P
a
per
|
PFBHA derivatization reagent through the headspace of a 4 mL opaque amber vial containing a 17 mg mL−1 solution of PFBHA in water. Gas samples were extracted from the EUPHORE chamber by inserting the SPME holder into a built-in adapter in one of the chamber’s flanges. Sampling times ranged from 2 to 5 min depending on theα-dicarbonyl concentrations. GLY and MGLY were then quantified using a 6890 HP 5
Gas Chromatograph with a flame ionization detector (GC-FID) through the formation of the corresponding oxime by reaction of GLY or MGLY with PFBHA on the fibres. The linear range for GLY is 1–130 ppbV and for MGLY is 1–80 ppbV. MDL is 0.1 ppbV for GLY and 0.15 ppbV for MGLY. The accuracies are 30 % for both GLY and MGLY measurements by the SPME derivatization technique.
10
A PTR-ToF-MS instrument (Series I, Kore, UK) was also used to detect the gaseous MGLY. The PTR-ToF-MS technique is based on the chemical ionization of trace VOCs present in atmospheric samples by proton transfer reactions with the hydronium reagent ion (H3O+). The product is a protonated molecular ion (VOC-H)+ for each VOC which is then selected and quantified by time-of-flight mass spectrometry (Blake et al., 15
2009). The PTR-ToF-MS method is also applicable to oxygenated VOCs such as GLY and MGLY. However, one drawback to PTR-MS, common to mass spectrometric tech-niques, is isobaric interference between VOC species being sampled. GLY is isobaric with propanal and acetone and as a result GLY cannot be exactly quantified by PTR-ToF-MS in this study. Only MGLY was measured based on them/z=73 Da signal for 20
MGLY-H+. The linear range for MGLY is 1.5 ppbV–172 ppbV by PTR-ToF-MS measure-ment with a MDL (3σ) of 1.5 ppbV. The instrumental error on the MGLY measurement is 1.0 ppbV.
2.4 Preparing gaseous GLY and MGLY
Pure GLY monomer was prepared from the solid trimer-dihydrate (95 %) using the 25
AMTD
6, 5751–5794, 2013A microfluidic measurement of
glyoxal and methylglyoxal
X. Pang et al.
Title Page
Abstract Introduction
Conclusions References
Tables Figures
◭ ◮
◭ ◮
Back Close
Full Screen / Esc
Printer-friendly Version Interactive Discussion
Discussion
P
a
per
|
D
iscussion
P
a
per
|
Discussion
P
a
per
|
Discuss
ion
P
a
per
|
procedures were conducted as described in the previous study (Gurnick et al., 1981). Flasks containing pure and unpolymerized GLY or MGLY were stored in liquid nitrogen prior to experimental use.
Pure GLY or MGLY was introduced into the EUPHORE chamber by passing a small flow of nitrogen through a cold-trap whilst allowing the trap to warm gently. After each 5
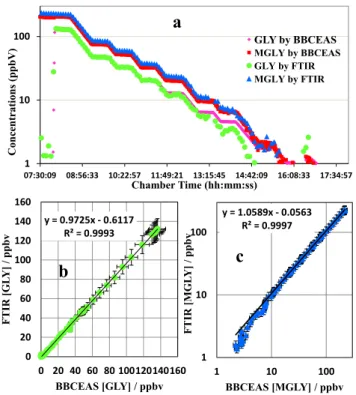
addition, the chamber’s contents were homogenously mixed by the fans and stabilized for five minutes. Therefore, a stable GLY and MGLY gaseous mixture inside the cham-ber was obtained. Chamcham-ber measurements were taken for a period of 30 min before dilution down to a lower concentration by adding clean air, allowing the chamber con-tents to mix thoroughly and measuring for a period of 30 min repeatedly until GLY and 10
MGLY concentrations were below the detection limits. The detailed temporal variations ofα-dicarbonyl concentrations are shown in Fig. 2a. Therefore, the downward steps provide a series of gas phase calibrations of GLY and MGLY over a representative range of concentrations generated inside the EUPHORE chamber during experiments performed to investigate the photo-chemical oxidation of VOCs. The different chamber 15
amounts of GLY and MGLY were used to test the instrument response and linearity, and assigned absolute mixing ratio values using the co-measurements by FTIR (rang-ing from 2.5 ppbV to 405 ppbV for GLY and from 5.4 ppbV to 227 ppbV for MGLY) and BBCEAS (ranging from 1.0 ppbV for GLY and 0.7 ppbV for MGLY). Given their similar performances in previous GLY and MGLY measurement experiments (Fig. 2b and c), 20
these two techniques were chosen as the reference instruments to evaluate the perfor-mance of the microfluidic derivatization technique.
2.5 Preparing standard solutions of PFBHA-dicarbonyl derivatives
A set of known concentrations of the PFBHA-dicarbonyl derivatives were prepared in acetonitrile by mixing theα-dicarbonyls with a PFBHA solution whose concentration is 25
deriva-AMTD
6, 5751–5794, 2013A microfluidic measurement of
glyoxal and methylglyoxal
X. Pang et al.
Title Page
Abstract Introduction
Conclusions References
Tables Figures
◭ ◮
◭ ◮
Back Close
Full Screen / Esc
Printer-friendly Version Interactive Discussion
Discussion
P
a
per
|
D
iscussion
P
a
per
|
Discussion
P
a
per
|
Discuss
ion
P
a
per
|
tives formed by 6.7, 13.4, 20.1, 26.8, 33.5, and 40.2 ppbV of gaseousα-dicarbonyls in the chamber conditions (30◦C at 1 atm) reacting with PFBHA, assuming 100 % reaction efficiencies under the optimal micro-reactor conditions shown in Table 1, with a solution enriching ratio of 2.77 (Pang and Lewis, 2012). We consider that such a liquid based calibration would present a feasible approach for any future field instrument.
5
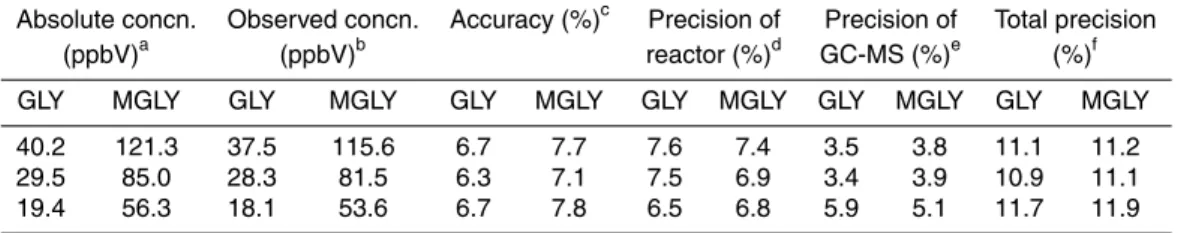
2.6 Accuracy and precision
Standard α-dicarbonyl mixtures of gases of three different concentrations were pre-pared in the chamber and used to check the method accuracy and precision. The accu-racy of the method was evaluated by the relative error which is expressed as [(observed concentration−absolute concentration)/absolute concentration]×100 %. Five parallel 10
samples for each concentration were collected continuously. The absolute concentra-tions of GLY and MGLY are provided by the BBCEAS due to its better accuracy over FTIR for this species. The observed concentrations were measured by the microfluidic derivatization technique under the optimal experimental conditions as shown in Table 1 using a peak height calculation based on the calibration curves. Ignoring the uncertain-15
ties introduced by the FTIR and BBCEAS measurement, the microfluidic derivatization has two main sources of error: (i) the experimental uncertainties of microfluidic deriva-tization technique, assessed using parallel samples under the identical experimental conditions, (ii) the instrumental uncertainties of the GC-MS response, assessed here by multiple injections of the same sample under the same instrumental conditions. The 20
precision of the new analytical method is controlled by two elements, the reproducibility of microfluidic reactor and of the GC-MS instrument. The precision of the microfluidic derivatization technique was determined by the replicate analyses (n=5) of standard α-dicarbonyl gases at three different concentrations under the same experimental con-ditions. The precision of the GC-MS instrument to the same sample was calculated by 25
AMTD
6, 5751–5794, 2013A microfluidic measurement of
glyoxal and methylglyoxal
X. Pang et al.
Title Page
Abstract Introduction
Conclusions References
Tables Figures
◭ ◮
◭ ◮
Back Close
Full Screen / Esc
Printer-friendly Version Interactive Discussion
Discussion
P
a
per
|
D
iscussion
P
a
per
|
Discussion
P
a
per
|
Discuss
ion
P
a
per
|
2.7 EUPHORE isoprene photo-oxidation experiment
The microfluidic derivatization technique was employed through the whole campaign to determine the gaseous GLY and MGLY in the EUPHORE chamber. To illustrate the microfluidic derivatization technique capability, its performance on 25 July 2012 is cho-sen. For this particular experiment, isoprene photo-oxidation was carried out under rel-5
atively low NOXconditions (initial VOC/NOXratio of about 7). 226 ppbV of isoprene was
prepared by injecting 170 µL of isoprene (liquid phase) into the chamber by a heated air flow. Sulfur hexafluoride (SF6) was also added in order to monitor the chamber
dilution (using FTIR). HONO was subsequently continuously added into the chamber throughout the experiment so that a steady state of 5–8 ppbV of HONO was achieved 10
(monitored by a Long Path Absorption Photometer (LOPAP) and FTIR) (Heland et al., 2001). This experiment was designed so that GLY and MGLY formation could be mon-itored throughout the entire chemical evolution of the isoprene photo-oxidation system (i.e. their primary formation from the initial OH reaction, secondary formation from reac-tions of methacrolein and methyl vinyl ketone products, and later-stage formation from 15
glycolaldehyde and hydroxyacetone products (Calvert et al., 2000). After the gases in the chamber were mixed by the fans and stabilized for 5 min, the retractable half-spherical housing was opened exposing the chamber to solar radiation, photolysing HONO to produce OH radicals and thus initiating the photoxidation of isoprene. The chamber was closed when the formation of ozone had reached a maximum (after about 20
400 min). A comprehensive suite of instrumentation measuring gas and aerosol phase composition was available including those capable of sensitively monitoring the forma-tion of GLY and MGLY (i.e. FTIR, BBCEAS, PTR-ToF-MS, and SPME). A gas sample was collected every 30 min from the chamber to measure the GLY and MGLY yields from isoprene photo-oxidation using the microfluidic derivatization technique.
25
ex-AMTD
6, 5751–5794, 2013A microfluidic measurement of
glyoxal and methylglyoxal
X. Pang et al.
Title Page
Abstract Introduction
Conclusions References
Tables Figures
◭ ◮
◭ ◮
Back Close
Full Screen / Esc
Printer-friendly Version Interactive Discussion
Discussion
P
a
per
|
D
iscussion
P
a
per
|
Discussion
P
a
per
|
Discuss
ion
P
a
per
|
tracted from the Master Chemical Mechanism (MCMv3.2) (Jenkin et al., 2003). The isoprene mechanism employed (along with an appropriate inorganic reaction scheme) contains 456 species and 1476 reactions. The box model used in this study also in-cludes a series of “chamber specific” auxiliary reactions adapted from Bloss et al. (2005) in order to take into account the background reactivity of the chamber walls 5
(Rickard et al., 2010).
3 Results and discussions
The solvent, PFBHA concentration, microchip temperature, flow rates of gas and so-lution and reaction time can all affect the reaction efficiency and reproducibility of the derivatization reaction and, therefore, an optimization of the parameters is required to 10
achieve the highest efficiency of derivatization from each micro-preparative system. At the same time, in order to achieve a good separation, chromatographic conditions were optimized to the values described in Sect. 2.2. We have described previously the op-timisation process and parameters for formaldehyde measurement (Pang and Lewis, 2012) and have undertaken a similar optimisation here.
15
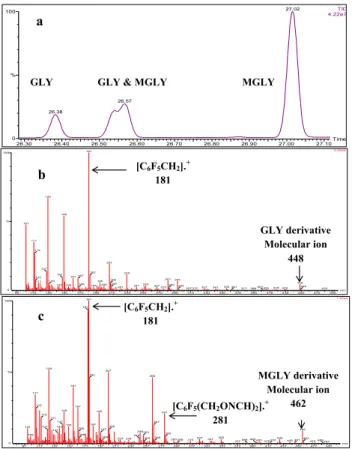
The reaction between GLY/MGLY and PFBHA to form the corresponding pentafluo-robenzyl oximes is a two-step process, as illustrated in Fig. 3. In the first step of the reaction, the PFBHA reacts with theα-dicarbonyl through nucleophilic attack to form an amino alcohol. The second step is dehydration of the amino alcohol, which leads to formation of an oxime (Spaulding et al., 2002; Ho and Yu, 2002). When GLY and MGLY 20
which contain two carbonyl groups are derivatized, two isomers are formed for GLY and four isomers (ZE, ZZ, EZ, EE isomers) are potentially formed for MGLY. However in practice, as seen in the GC chromatograms (Fig. 4a), only two of the four MGLY iso-mers are formed in significant concentrations. The retention times of one GLY deriva-tive and one of the observed MGLY derivaderiva-tives are so close that their peaks overlap 25
AMTD
6, 5751–5794, 2013A microfluidic measurement of
glyoxal and methylglyoxal
X. Pang et al.
Title Page
Abstract Introduction
Conclusions References
Tables Figures
◭ ◮
◭ ◮
Back Close
Full Screen / Esc
Printer-friendly Version Interactive Discussion
Discussion
P
a
per
|
D
iscussion
P
a
per
|
Discussion
P
a
per
|
Discuss
ion
P
a
per
|
and MGLY (Yu et al., 1995). Therefore only the GLY derivative with retention time of 26.4 min and MGLY derivative with retention time of 27.0 min were used to calculate the concentration of eachα-dicarbonyl. The MS spectra of the two isolated peaks demon-strate that the two carbonyl groups of each α-dicarbonyl have both been derivatized with a molecular ion peaks ofm/z=448 Da for the GLY derivative andm/z=462 Da 5
for the MGLY derivative (Fig. 4b and c). The ion withm/z 181 Da is identified as the most abundant fragment ion for the two derivatives (Fig. 4b and c). Therefore, the se-lected ion chromatograms of the most abundant ion,m/z=181 Da, previously shown to be a convenient indicator of the presence of carbonyl compounds (Yu et al., 1995), was used to quantify the concentration of derivatives.
10
3.1 Solvent selection for PFBHA
PFBHA is a water-soluble derivatization reagent for carbonyl-containing compounds. However, water is not a suitable solvent in this study since aqueous solutions cannot be easily injected directly into the capillary GC column. Instead, several organic solvents, including acetonitrile, ethanol, ethyl acetate, methanol, and 2-propanol were tested as 15
the carrier solvent and their influences on the measurement were studied. Traces of some carbonyl compounds including formaldehyde, acetaldehyde, butyraldehyde were found in several PFBHA solvent combinations such as ethanol, ethyl acetate, methanol, and 2-propanol, which can potentially interfere with the PFBHA derivatization reactions of target carbonyl products such as formaldehyde, acetaldehyde, acetone, etc. formed 20
in the chamber experiments (e.g. isoprene photo-oxidation).
Acetonitrile was not found to contain contaminant carbonyl compounds which pro-duced derivative peaks in the GC chromatograph of PFBHA solutions. Therefore, ace-tonitrile was chosen as the optimal solvent to prepare the derivatization solution in this study.
AMTD
6, 5751–5794, 2013A microfluidic measurement of
glyoxal and methylglyoxal
X. Pang et al.
Title Page
Abstract Introduction
Conclusions References
Tables Figures
◭ ◮
◭ ◮
Back Close
Full Screen / Esc
Printer-friendly Version Interactive Discussion
Discussion
P
a
per
|
D
iscussion
P
a
per
|
Discussion
P
a
per
|
Discuss
ion
P
a
per
|
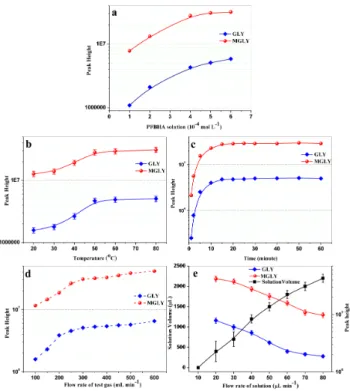
3.2 Influence of PFBHA concentration
Increasing the liquid phase PFBHA concentration from 1.0×10⁻⁴mol L−1 to 6.0×
10−4mol L−1(whilst the GLY and MGLY concentrations were held constant at 50 ppbV) was found to improve theα-dicarbonyl-PFBHA derivatization yield. Positive relation-ships existed between the α-dicarbonyl derivative-oxime response and the PFBHA 5
concentration for both GLY and MGLY (Fig. 5a). In a 1.0×10⁻⁴mol L−1PFBHA reaction solution, the signal responses (peak heights) ofα-dicarbonyl derivatives are equal to 25 % of those ofα-dicarbonyl derivatives in 6.0×10⁻⁴mol L−1PFBHA reaction solution. Since 6.0×10⁻⁴ mol L−1 is close to the saturated solubility of PFBHA in acetonitrile, this was the maximum PFBHA concentration tested. According to the derivatization 10
mechanism there is reaction equilibrium between PFBHA and the α-dicarbonyl (R1) with the formation of an oxime derivative (PFBHA oxime):
2PFBHA+Dicarbonyl ⇔K PFBHA oxime (R1)
The equilibrium constant is expressed as Eq. (1)
K= [PFBHA oxime]
[Dicarbonyl]·[PFBHA]2 (1)
15
Since theα-dicarbonyl concentrations are stable in solution under identical reaction conditions including the mixing ratio of α-dicarbonyl standard gases, Eq. (1) can be rearranged into the following Eq. (2):
[PFBHA oxime] =K′
[PFBHA]2 (2)
According to Eq. (2) more PFBHA oxime will be produced when using a higher con-20
AMTD
6, 5751–5794, 2013A microfluidic measurement of
glyoxal and methylglyoxal
X. Pang et al.
Title Page
Abstract Introduction
Conclusions References
Tables Figures
◭ ◮
◭ ◮
Back Close
Full Screen / Esc
Printer-friendly Version Interactive Discussion
Discussion
P
a
per
|
D
iscussion
P
a
per
|
Discussion
P
a
per
|
Discuss
ion
P
a
per
|
3.3 Optimization of reaction temperature and storage time
To the best of our knowledge, the influence of temperature on derivative yields has not previously been studied for the derivatization ofα-dicarbonyls. Although temperature was reported to affect the efficiency of the derivatization reaction by the US EPA, no fur-ther information was provided (Munch et al., 1998). In this study the derivative relative 5
signal responses of GLY and MGLY were found to increase from about 40 % at 20◦C to 96 % at 50◦C as illustrated in Fig. 5b, which implies a higher reaction temperature is favourable to derivative yield. The reaction temperature of the micro-reactor was con-trolled by a hot plate. The micro-reactor can be heated directly to an elevated temper-ature due to its planar shape, unlike more commonly used bubblers and impingers that 10
are often used for stripping and derivitising reactions. Temperature affects the derivati-zation reaction in the microchannel via three processes: (1) the reaction rate between α-dicarbonyl and PFBHA, (2) the PFBHA andα-dicarbonyl partitioning between the gas and the liquid phases, (3) the partitioning of the PFBHA-α-dicarbonyl derivatives between the liquid and the gas phases. For GLY, MGLY and PFBHA, increasing the 15
temperature will accelerate the reaction rates betweenα-dicarbonyls and PFBHA re-sulting in more derivative formation in solution (Destaillats and Charles, 2002; Betterton and Hoffmann, 1988). It should be noted that too high a temperature leads to rapid sol-vent evaporation. Since the same GC-MS peak height was obtained at 50◦C, 60◦C and 80◦C, as shown in Fig. 5b, the optimal reaction temperature in this study was chosen 20
as 60◦C.
Previous studies have found storage time to be an important factor in influencing the derivative yields. PFBHA derivative yields were reported to increase significantly after a storage period from one hour to several days depending on the species of car-bonyl compound in previous studies (Ho and Yu, 2002; Temime et al., 2007). In this 25
min-AMTD
6, 5751–5794, 2013A microfluidic measurement of
glyoxal and methylglyoxal
X. Pang et al.
Title Page
Abstract Introduction
Conclusions References
Tables Figures
◭ ◮
◭ ◮
Back Close
Full Screen / Esc
Printer-friendly Version Interactive Discussion
Discussion
P
a
per
|
D
iscussion
P
a
per
|
Discussion
P
a
per
|
Discuss
ion
P
a
per
|
utes was still needed to allow the derivatization reaction to complete. In this study the peak heights of derivatives in the GC-MS chromatogram reached their maximum and remain relatively constant after around fifteen minutes (Fig. 5c). The longer stor-age time was found to have no significant effect on the GC-MS signal responses of GLY and MGLY derivatives even after 24 h storage, which is different from observa-5
tions previously reported (Ho and Yu, 2002). Since the PFBHA derivatization process is effectively a nucleophilic addition reaction the simple steric structures and electron configurations of GLY and MGLY are favourable to the faster reaction rate (Temime et al., 2007; Reisen et al., 2003). The control parameters afforded by the combination of micro-reactor length and peristaltic flow rate means that the derivatization process 10
is considered sufficiently fast that it can be used for near real-time measurement ofα -dicarbonyls with the micro-reactor effluent passed directly for in-situ GC-MS analysis. Such an approach circumvents the problems associated with slow storage reactions and long-term degradation of derivative samples in solution.
3.4 Optimization of flows of gas and solution
15
A key function of the micro-reactor is to efficiently mix the gas flow containing the target α-dicarbonyls with the PFBHA solution. If the flow rate of the test gas is too high, theα-dicarbonyls do not have chance to dissolve in the wall liquid film and react causing the derivatization efficiency to decrease. The overall derivatization efficiency was influenced strongly by the mixing at the channel junction and downstream in the 20
capillary region. The detailed discussion on effect of flow rates of gas and solution can be seen for HCHO in our previous study (Pang and Lewis, 2012).
Flow rates of the sample gas were varied from 100 to 600 mL min−1 and evaluated for peak height with the derivatization solution (5.0×10⁻⁴mol L−1) flow set at a con-stant 40 µL min−1and the temperature of micro-reactor at 60◦C for bothα-dicarbonyls 25
AMTD
6, 5751–5794, 2013A microfluidic measurement of
glyoxal and methylglyoxal
X. Pang et al.
Title Page
Abstract Introduction
Conclusions References
Tables Figures
◭ ◮
◭ ◮
Back Close
Full Screen / Esc
Printer-friendly Version Interactive Discussion
Discussion
P
a
per
|
D
iscussion
P
a
per
|
Discussion
P
a
per
|
Discuss
ion
P
a
per
|
reaction time in the microchip. Such high flow rates are therefore not appropriate to use for these compounds. It should be noted that too high a gas flow rate can also lead to excessive rapid solvent evaporation. In this study the optimal flow of α -dicarbonyl in gas was chosen as 200 mL min−1. Five flow rates of derivatization solution (5.0×10⁻⁴mol L−1) varying from 20 to 120 µL min−1 were assessed with the test gas 5
flow kept at a constant 300 mL min−1 (all other conditions the same as Fig. 5d). Peak heights diminish as the liquid flow rate increases – a value of around 30–40 µL min−1 gave good peak heights whilst retaining sufficient workable volumes of solution in the reactor for subsequent handling by GC-MS (Fig. 5e). The optimal flow rate of PFBHA derivatization solutions was chosen as 40 µL min−1for both GLY and MGLY detection. 10
Based on the above approaches, the optimal conditions of the micro-reactor for mea-surement of gas phaseα-dicarbonyls are shown in Table 1.
3.5 Method calibration
The method calibration curves for the microfluidic derivatization technique were estab-lished based on measuring a series of GLY and MGLY gas mixtures of different concen-15
tration prepared in the EUPHORE chamber. The GLY and MGLY standard gas mixtures in the chamber were simultaneously determined by FTIR and BBCEAS techniques. Al-though theα-dicarbonyl concentrations can be calculated based on the known amount of GLY and MGLY injected into the chamber, their actual concentrations were checked by the measurements of FTIR and BBCEAS in order to construct calibration curves for 20
the microfluidic derivatization technique which would also account for any wall losses of GLY and/or MGLY in the chamber or losses in the injection tube.
In practice the FTIR and BBCEAS instruments showed good agreement for the mea-surement of GLY and MGLY when mixing ratios were above 5 ppbV and 2 ppbV, respec-tively (Fig. 2a), though there is some evidence of divergence at the lowest mixing ratios. 25
AMTD
6, 5751–5794, 2013A microfluidic measurement of
glyoxal and methylglyoxal
X. Pang et al.
Title Page
Abstract Introduction
Conclusions References
Tables Figures
◭ ◮
◭ ◮
Back Close
Full Screen / Esc
Printer-friendly Version Interactive Discussion
Discussion
P
a
per
|
D
iscussion
P
a
per
|
Discussion
P
a
per
|
Discuss
ion
P
a
per
|
against the BBCEAS data. In Fig. 6a GLY show a good linearity from 5.4 to 48.2 ppbV and MGLY from 2.1 to 37.1 ppbV referenced to FTIR, respectively. In Fig. 6b, GLY show a good linearity from 1.0 to 33.3 ppbV and MGLY from 0.8 to 34.0 ppbV by BBCEAS, respectively. The linear equations for GLY between FTIR and BBCEAS are consistent in intercepts and gradients. Therefore, it can be concluded that there are no systematic 5
differences among the calibrations equations established by the two independent refer-ence techniques. Additionally, the correlation between FTIR and BBCEAS in GLY and MGLY determinations shown in Fig. 2b and c also confirms the good agreement in two reference techniques. Considering the BBCEAS technique has better accuracies and lower MDL than FTIR for both GLY and MGLY measurements, the calibration equations 10
based on BBCEAS data are more preferable and used subsequently. The MDLs for the microfluidic method are estimated to be 80 pptV for GLY and 200 pptV for MGLY, which are calculated from the baseline signal plus 3 times standard deviation of the S/N of the blank sample in the GC chromatograph. Comparisons between the microfluidic derivatization technique and other previously reported methods for measuring GLY and 15
MGLY, in term of linear range and detection limit are listed in Table 2. The detection limit of this technique is comparable with most spectrometric methods (Washenfelder et al., 2008; Thalman and Volkamer, 2010; Volkamer et al., 2005) and a little higher than the other derivatization methods (Lee and Zhou, 1993; Spaulding et al., 2002). However, the improved time resolution and automation are the significant advantages. Another 20
method of calibration based on the measurement of standard solutions ofα -dicarbonyl-PFBHA derivatives at different concentrations, is shown in Fig. 6c. The concentrations of α-dicarbonyl derivative solutions have been transformed into the mixing ratios of gaseousα-dicarbonyls assuming the derivatization efficiencies were 100 %. The gra-dients of the calibration equations based on standard solutions are higher than those 25
AMTD
6, 5751–5794, 2013A microfluidic measurement of
glyoxal and methylglyoxal
X. Pang et al.
Title Page
Abstract Introduction
Conclusions References
Tables Figures
◭ ◮
◭ ◮
Back Close
Full Screen / Esc
Printer-friendly Version Interactive Discussion
Discussion
P
a
per
|
D
iscussion
P
a
per
|
Discussion
P
a
per
|
Discuss
ion
P
a
per
|
the standard calibration solutions and optical measurements, which implies the cali-bration solution method is feasible for gaseous GLY and MGLY determinations even if FTIR and BBCEAS are not available to provide independent reference measurements of the absolute gaseousα-dicarbonyl concentrations.
The average accuracies for GLY and MGLY are 6.6 % and 7.5 % which were cal-5
culated as the average relative error to the absolute concentrations provided by FTIR and BBCEAS, respectively. The precisions for GLY and MGLY are 11.2 % and 11.4 % respectively, which are the average Relative Standard Derivation (RSD) for the five par-allel samples and five parpar-allel injections. The detailed values for each measurement are shown in Table 3.
10
3.6 Application and direct comparisons with other techniques
To test the performance of the microfluidic derivatization technique for time resolved measurements, the technique was employed to determine gaseous GLY and MGLY during an experiment in the EUPHORE chamber to study the photo-oxidation of iso-prene under relatively low NOX (NO≤2 ppbV, NO2 13–21 ppbV) conditions. The
mi-15
crofluidic technique was compared with FTIR, BBCEAS, PTR-ToF-MS and SPME derivatization techniques. The latest vision of the Master Chemical Mechanism (MCM v-3.2) was also employed in a chamber specific box model to predict the temporal evolution of theα-dicarbonyl products during the experiment. Comparisons of the five analytical techniques (focusing on the microfluidic derivatization technique) and the 20
MCM box model simulation are shown in Fig. 7.
As shown in Fig. 7a, the microfluidic technique compares reasonably well with the FTIR measurement for both MGLY and GLY. The main inconsistencies shown are two higher concentration data points of MGLY (12.4±3.9 and 7.4±1.4 ppbV) measured by the microfluidic technique compared to those (6.90±0.55 and 4.0±0.30 ppbV) by the
25
concentra-AMTD
6, 5751–5794, 2013A microfluidic measurement of
glyoxal and methylglyoxal
X. Pang et al.
Title Page
Abstract Introduction
Conclusions References
Tables Figures
◭ ◮
◭ ◮
Back Close
Full Screen / Esc
Printer-friendly Version Interactive Discussion
Discussion
P
a
per
|
D
iscussion
P
a
per
|
Discussion
P
a
per
|
Discuss
ion
P
a
per
|
tions of MGLY and GLY measured by the microfluidic technique are also in reasonable agreement except for three higher data points around the same period as the FTIR inconsistencies occur (180–280 min). In this study the microfluidic technique and the SPME technique are both based on PFBHA derivatization. As Fig. 7c shows, the two techniques compared well (within their combined error bars) for GLY, which implies 5
the PFBHA derivatization techniques are consistent and sufficiently sensitive to mea-sure GLY in chamber applications. However, for MGLY meamea-surement the two deriva-tization methods agree with each other during the initial stage of the experiment (up to 150 min), with MGLY concentrations measured by the microfluidic technique much higher than those by SPME after 150 min, which decrease much faster after this time. 10
MGLY measured by PTR-ToF-MS also agrees reasonably well with those obtained by microfluidic derivatization technique during the initial rise up to about 200 min, as is shown in Fig. 7d. However, after this time the PTR-ToF-MS MGLY signal does not decay (whereas all other techniques do), but remains stable and constant for the re-mainder of the experiment. An explanation for this may be the background signal from 15
the protonated water cluster (H2O)4.H+ increases due to the increasing sample
hu-midity and elevates background noise on them/z 73 mass channel. As illustrated in Fig. 7e, the time-dependant trends of GLY and MGLY obtained by the detailed MCM box model agree reasonably well in term of profile shape and magnitude to those ob-tained by the microfluidic derivatization method, giving us some confidence in our un-20
derstanding of the chemistry controlling isoprene photo-oxidation. However, the model tends to over-predict GLY and MGLY by a factor of approximate 1.3 and over-predicts GLY by a factor of 2.0 relative to the microfluidic technique before 180 min of the re-action, with agreement rather better during the second half, which may indicate some over prediction of the yields of secondary/tertiary products of isoprene oxidation (e.g. 25
methacrolein/methyl vinyl ketone/glycolaldehyde), theirα-dicarbonyls yields and/or un-der prediction of someα-dicarbonyl loss process(es) in the model.
com-AMTD
6, 5751–5794, 2013A microfluidic measurement of
glyoxal and methylglyoxal
X. Pang et al.
Title Page
Abstract Introduction
Conclusions References
Tables Figures
◭ ◮
◭ ◮
Back Close
Full Screen / Esc
Printer-friendly Version Interactive Discussion
Discussion
P
a
per
|
D
iscussion
P
a
per
|
Discussion
P
a
per
|
Discuss
ion
P
a
per
|
parison between microfluidic technique and BBCEAS data was conducted. As Fig. 8 shows, good agreements are observed for the measurements of GLY over the range of 0.1 ppbV to 0.8 ppbV and MGLY in the range of 0.9 ppbV to 1.7 ppbV. Some further refinement of the microfluidic technique will conducted to allow detection of ambientα -dicarbonyl measurements in the future principally through improvements in ruggedness 5
and automation of the micro-reactor; the chamber experiments demonstrate however more than adequate sensitivity and time resolution.
From the smog chamber comparisons above it can be concluded that that microflu-idic derivatization technique shows a similar performance, in terms of time profile shape and magnitude for GLY measurements as the SPME derivatization technique and the 10
instrumental techniques of FTIR and BBCEAS. The microfluidic derivatization tech-nique shows performance that better matches the reference FTIR and BBCEAS meth-ods for MGLY than the SPME derivatization technique or PTR-ToF-MS.
4 Conclusions
A new, relatively sensitive and rapid automated microfluidic “lab-on-a-chip” derivatiza-15
tion technique has been developed for the sensitive measurement of gas-phase glyoxal (GLY) and methylglyoxal (MGLY) and been tested in a series of simulation experiments in EUPHORE chamber. The method is based on microfluidic derivatization of carbonyls and pre-concentration of the reaction solution in a glass micro-reactor followed by GC-MS analysis. The microchannels of the reactor enhance the phase contact area-to-20
volume ratio, and allow direct heating of the on-chip reaction. This combination of small volumes and higher temperatures creates a much faster and higher efficiency deriva-tization between α-dicarbonyls and PFBHA than can be achieved using other tradi-tional derivatisation methods and without requiring any additradi-tional unwieldy preparative steps. Effluent leaving the micro-reactor can be directly injected into a standard bench-25
AMTD
6, 5751–5794, 2013A microfluidic measurement of
glyoxal and methylglyoxal
X. Pang et al.
Title Page
Abstract Introduction
Conclusions References
Tables Figures
◭ ◮
◭ ◮
Back Close
Full Screen / Esc
Printer-friendly Version Interactive Discussion
Discussion
P
a
per
|
D
iscussion
P
a
per
|
Discussion
P
a
per
|
Discuss
ion
P
a
per
|
in the EUPHORE outdoor smog chamber, and was compared with several alternative spectroscopic and mass spectrometric techniques. The consistency in temporal evolu-tions of GLY and MGLY between different experimental measurement techniques and a detailed box model simulation provides some initial evidence for the effectiveness of the technique in practical applications. The microfluidic derivatization technique de-5
scribed provides significant opportunities to build on the specificity of derivatization for a series of carbonyls but at low cost, without manual preparative steps and allows for faster reaction times and on-line coupling with GC-MS.
Acknowledgements. The EUPHORE experiments were carried out as part of the NERC funded “Pho-SOA” project (NE/H021108/1). XP acknowledges support from the Chinese National
Nat-10
ural Science Foundation (41175110). XP, ARR, TJA, SMB and MJSD acknowledge the Na-tional Centre for Atmospheric Science (NCAS) for support with travel subsistence and instru-ment shipping expenses. The Instituto Universitario CEAM-UHM is partly supported by Gen-eralitat Valenciana, and the projects GRACCIE (Consolider Ingenio 2010) and FEED-BACKS (Prometeo-Generalitat Valenciana). EUPHORE instrumentation is partly funded by the Spanish
15
Ministry of Economy, through INNPLNATA project: PCT-440000-2010-003.
References
Blake, R. S., Monks, P. S., and Ellis, A. M.: Proton-transfer reaction mass spectrometry, Chem. Rev., 109, 861–896, 2009. 5763
Bloss, C., Wagner, V., Bonzanini, A., Jenkin, M. E., Wirtz, K., Martin-Reviejo, M., and
20
Pilling, M. J.: Evaluation of detailed aromatic mechanisms (MCMv3 and MCMv3.1) against environmental chamber data, Atmos. Chem. Phys., 5, 623–639, doi:10.5194/acp-5-623-2005, 2005. 5767
Calvert, J. G., Atkinson, R., Kerr, J., Madronich, S., Moortgat, G., Wallington, T., and Yarwood, G.: The Mechanisms of Atmospheric Oxidation of the Alkenes, vol. 5, Oxford University
25
Press, New York, 2000. 5754, 5755, 5766
AMTD
6, 5751–5794, 2013A microfluidic measurement of
glyoxal and methylglyoxal
X. Pang et al.
Title Page
Abstract Introduction
Conclusions References
Tables Figures
◭ ◮
◭ ◮
Back Close
Full Screen / Esc
Printer-friendly Version Interactive Discussion
Discussion
P
a
per
|
D
iscussion
P
a
per
|
Discussion
P
a
per
|
Discuss
ion
P
a
per
|
Chan, A. W., Galloway, M. M., Kwan, A. J., Chhabra, P. S., Keutsch, F. N., Wennberg, P. O., Fla-gan, R. C., and Seinfeld, J. H.: Photooxidation of 2-methyl-3-buten-2-ol (MBO) as a potential source of secondary organic aerosol, Environ. Sci. Technol., 43, 4647–4652, 2009. 5755 Connelly, B., De Haan, D., and Tolbert, M.: Heterogeneous glyoxal oxidation: a potential source
of secondary organic aerosol, J. Phys. Chem. A, 116, 6180–6187, 2012. 5756
5
De Haan, D. O., Corrigan, A. L., Tolbert, M. A., Jimenez, J. L., Wood, S. E., and Turley, J. J.: Secondary organic aerosol formation by self-reactions of methylglyoxal and glyoxal in evap-orating droplets, Environ. Sci. Technol., 43, 8184–8190, 2009. 5754
Feierabend, K. J., Flad, J. E., Brown, S., and Burkholder, J. B.: HCO quantum yields in the photolysis of HC(O)C(O)H (glyoxal) between 290 and 420 nm, J. Phys. Chem. A, 113, 7784–
10
7794, 2009. 5763
Finlayson-Pitts, B. J. and Pitts Jr., J. N.: Chemistry of the Upper and Lower Atmosphere: Theory, Experiments, and Applications, Academic Press, 1999. 5757
Fu, T.-M., Jacob, D. J., Wittrock, F., Burrows, J. P., Vrekoussis, M., and Henze, D. K.: Global bud-gets of atmospheric glyoxal and methylglyoxal, and implications for formation of secondary
15
organic aerosols, J. Geophys. Res.-Atmos., 113, D15303, doi10.1029/2007JD009505, 2008. 5754, 5755
Galloway, M. M., Huisman, A. J., Yee, L. D., Chan, A. W. H., Loza, C. L., Seinfeld, J. H., and Keutsch, F. N.: Yields of oxidized volatile organic compounds during the OH radical initiated oxidation of isoprene, methyl vinyl ketone, and methacrolein under high-NOx conditions,
At-20
mos. Chem. Phys., 11, 10779–10790, doi:10.5194/acp-11-10779-2011, 2011. 5755
Gomez Alvarez, E., Borras, E., Viidanoja, J., and Hjorth, J.: Unsaturated dicarbonyl products from the OH-initiated photo-oxidation of furan, 2-methylfuran and 3-methylfuran, Atmos. En-viron., 43, 1603–1612, 2009. 5758, 5762
Guenther A., Hewitt C., Erickson D., Fall, R., Geron, C., Graedel, T., Harley, P., Klinger, L.,
25
Lerdau, M., Mckay, W. A., Pierce, T., Scholes, B., Steinbrecher, R., Tallamraju, R., Taylor, J., and Zimmerman, P.: A global model of natural volatile organic compound emissions, J. Geophys. Res., 100, 8873–8892, 1995. 5755
Gurnick, M., Chaiken J., Benson, T., and McDonald, J.: Vibrational and rotational spectroscopy of the first electronically allowed transition of α-dicarbonyls, J. Chem. Phys. 74, 7 pp.,
30
doi10.1063/1.440800, 1981. 5764