ACPD
7, 8361–8393, 2007Development of a SOA formation
mechanism
L. E. Olcese et al.
Title Page
Abstract Introduction
Conclusions References
Tables Figures
◭ ◮
◭ ◮
Back Close
Full Screen / Esc
Printer-friendly Version
Interactive Discussion
EGU
Atmos. Chem. Phys. Discuss., 7, 8361–8393, 2007 www.atmos-chem-phys-discuss.net/7/8361/2007/ © Author(s) 2007. This work is licensed
under a Creative Commons License.
Atmospheric Chemistry and Physics Discussions
Development of a secondary organic
aerosol formation mechanism:
comparison with smog chamber
experiments and atmospheric
measurements
L. E. Olcese, J. E. Penner, and S. Sillman
Department of Atmospheric, Oceanic and Space Sciences, University of Michigan, Ann Arbor, MI 48109, USA
Received: 20 April 2007 – Accepted: 30 May 2007 – Published: 18 June 2007
ACPD
7, 8361–8393, 2007Development of a SOA formation
mechanism
L. E. Olcese et al.
Title Page
Abstract Introduction
Conclusions References
Tables Figures
◭ ◮
◭ ◮
Back Close
Full Screen / Esc
Printer-friendly Version
Interactive Discussion
EGU
Abstract
A new mechanism to simulate the formation of secondary organic aerosols (SOA) from reactive primary hydrocarbons is presented, together with comparisons with experi-mental smog chamber results and ambient measurements found in the literature. The SOA formation mechanism is based on an approach using calculated vapor pressures
5
and a selection of species that can partition to the aerosol phase from a gas phase photochemical mechanism. The mechanism has been validated against smog cham-ber measurements usingα-pinene, xylene and toluene as SOA precursors, and has an average error of 17%. Qualitative comparisons with smog chamber measurements using isoprene were also performed. A comparison against SOA production in the
10
TORCH 2003 experiment (atmospheric measurements) had an average error of only 12%. This contrasts with previous efforts, in which it was necessary to increase par-tition coefficients by a factor of 500 in order to match the observed values. Calcula-tions for rural and urban-influenced regions in the eastern U.S. suggest that most of the SOA is biogenic in origin, mainly originated from isoprene. A 0-dimensional
cal-15
culation based on the New England Air Quality Study also showed good agreement with measured SOA, with about 40% of the total SOA from anthropogenic precursors. This mechanism can be implemented in a general circulation model (GCM) to estimate global SOA formation under ambient NOx and HOx levels.
1 Introduction
20
Particulate matter (PM) plays a highly important role in the atmosphere. It exerts a strong influence on climate, modifying the amount of incoming radiation and changing the properties of clouds, in addition to other indirect effects. Organic matter (OM) can contribute up to 90% of the total mass of PM (Tsigaridis and Kanakidou, 2003), and a significant fraction of the OM is secondary organic aerosols (SOA), as high as
25
ACPD
7, 8361–8393, 2007Development of a SOA formation
mechanism
L. E. Olcese et al.
Title Page
Abstract Introduction
Conclusions References
Tables Figures
◭ ◮
◭ ◮
Back Close
Full Screen / Esc
Printer-friendly Version
Interactive Discussion
EGU
to the atmosphere, but are formed from semi-volatile oxygenated compounds, that are produced from the reaction of primary volatile hydrocarbons with oxidants such as O3, OH and NO3. These semi-volatile compounds have a wide variety of chemical
and thermodynamic properties and usually have one or more functional groups, (i.e. hydroxyl, carbonyl, carboxy, nitroxy and nitro groups). They may stick to the surface
5
of primary carbonceous particles (POA) particles, which are mainly composed of black carbon (BC) and other nonvolatile organic compounds (OC).
The SOA precursors can be of biogenic and anthropogenic origin; the proper deter-mination of the relative importance of both kinds of precursors is critical to the further implementation of SOA abatement policies and to the identification of climate effects
10
associated with anthropogenic OM.
Formation of SOA is poorly represented in current global chemical models, and this may be one of the main reasons why GCM models cannot properly reproduce aerosol field measurements. Previous efforts to model SOA formation in global mod-els used different SOA formation methods and chemical mechanisms (e.g. Tsigaridis
15
and Kanakidou, 2003 and Chung and Seinfeld, 2002), but when updated emission in-ventories for primary particle emissions are used, SOA formation is unable to explain observations of OC (Heald et al., 2005). One of the main problems with the SOA con-centration simulations is that there are many uncertainties in the SOA formation mech-anism, including the sticking coefficients of the semi-volatile compounds on aerosols,
20
the enthalpy of vaporization of several compounds, stabilization of the compounds in the aerosol phase due to catalysis, formation of dimers and oligomers in the aerosol phase, and removal processes. Different methods have been proposed to simulate SOA formation, mainly based on coefficients derived from smog chamber measure-ments, but often these experiments use SOA precursors in higher concentration than
25
ACPD
7, 8361–8393, 2007Development of a SOA formation
mechanism
L. E. Olcese et al.
Title Page
Abstract Introduction
Conclusions References
Tables Figures
◭ ◮
◭ ◮
Back Close
Full Screen / Esc
Printer-friendly Version
Interactive Discussion
EGU
the chemical species that form the SOA, and thus make it difficult to understand any further processes that occur in the aerosol phase.
The method used, with minor variations, by several authors (e.g. Chung and Seinfeld, 2002), is a two-product modeling framework for SOA formation. A parent hydrocarbon HCi reacts in the gas phase with an oxidant OXj (OH, O3 or NO3) to form a set of
5
products Gi ,j,k, each with a mass based stoichiometric coefficientαi ,j,k:
HCi + OXj −→ki ,j αi ,j,1Gi ,j,1 + αi ,j,2Gi ,j,2 (R1)
Whereki ,j is the reaction rate coefficient. Typically,ki ,j and the stoichiometric coef-ficientsαi ,j,k are determined by fits to smog chamber experiments, and the chemical structure of the products Gi ,j,k remains unknown. This is one of the main drawbacks
10
to this kind of SOA formation mechanism, but has been necessitated by the fact that the experimental data for the product constituents are not always available. In addition, this procedure limits the inclusion of new compounds in the SOA formation mechanism, since reactions inside the aerosol phase cannot be included.
Here, we describe a mechanism for SOA formation based on an explicit
represen-15
tation of chemical reactions of gas-phase species. Vapor pressures of the secondary compounds formed from the oxidation of primary species and its partitioning constants from gas to aerosol phase are calculated from thermodynamic considerations. Similar methods have been used previously by Griffin et al. (2002), Zhang et al. (2004) and Pun et al. (2006). Our methods, based on a different chemical mechanism, differ in the
20
method used to estimate the partition coefficients, in the SOA precursor selection, and in the treatment of hydrophilic and hydrophobic aerosols.
The resulting mechanism has been evaluated in comparison with smog chamber ex-periments. The mechanism is also used in 0-dimensional calculations that represent conditions associated with two recent field campaigns: the TORCH 2003 experiment
25
be-ACPD
7, 8361–8393, 2007Development of a SOA formation
mechanism
L. E. Olcese et al.
Title Page
Abstract Introduction
Conclusions References
Tables Figures
◭ ◮
◭ ◮
Back Close
Full Screen / Esc
Printer-friendly Version
Interactive Discussion
EGU
low, calculations using the mechanism described here show improved agreement in comparison with measurements.
The ultimate goal of this work is to develop a method for use in a global 3-D chem-ical and transport model (IMPACT) to simulate global SOA production, including up-dated emission inventories and a large number of primary compounds that can produce
5
aerosols together with a detailed model of the chemical reactions inside the particles.
2 Model description
SOA are produced through the partitioning of selected organic carbon compounds be-tween the gas and a preexisting aerosol phase, composed of an absorptive medium like primary organic aerosols and black carbon. The newly formed SOA can also serve
10
as an absorptive medium for other low volatility organic compounds.
The widely accepted (Pankow, 1994a) representation of the partitioning process of a given species between the gas phase and the aerosol phase depends on several chemical and physical variables, including the vapor pressure of the species, the av-erage molecular weight of the compounds in the aerosol phase, the temperature, as
15
well as the concentrations of the species in both phases and the chemical compo-sition of the aerosol phase. The numerical value of most of these variables can be measured, usually with small errors, or can be estimated using different methods for approximation. In this work, a detailed gas-phase chemical mechanism is used to sim-ulate the production of semi-volatile oxygenated compounds and their condensation to
20
the aerosol-phase to produce SOA. Thus, we aim to establish a mechanistic represen-tation of the physical and chemical processes of SOA formation.
The chemical mechanism used is based on that published by Ito et al. (2007). It includes 194 chemical species and 611 chemical reactions and includes a change that forms glycoaldehyde from the oxidation of isoprene rather than hydroxyacetic
25
ACPD
7, 8361–8393, 2007Development of a SOA formation
mechanism
L. E. Olcese et al.
Title Page
Abstract Introduction
Conclusions References
Tables Figures
◭ ◮
◭ ◮
Back Close
Full Screen / Esc
Printer-friendly Version
Interactive Discussion
EGU
species concentration in each time step (Sillman, 1991). We also ran some of the tests described in the following sections using the Master Chemical Mechanism (MCM) v3.1 (http://mcm.leeds.ac.uk/MCM/, 2006), and we found that, by choosing the same species for partitioning (or an equivalent one, if the species is not present in both mech-anisms), the amount of SOA formed in the simulations using the Ito et al. mechanism
5
and the MCM mechanism, was almost the same. This is a good indication of the ro-bustness of the chosen chemical mechanism, whose computational requirements are much smaller than those of the MCM.
In our proposed approach, every secondary organic compound that meets at least one of the following requirements, established by Griffin et al. (2002), has the potential
10
to partition to the aerosol phase. A compound must have at least one of the following structural characteristics:
– Be partially soluble.
– Be an aromatic acid.
– Be an aromatic compound with two functional groups that are not aldehydes.
15
– Have 12 or more carbon atoms.
– Have at least 10 carbon atoms and two functional groups.
– Have at least six carbon atoms and two functional groups, one of which is an acid.
– Be trifunctional.
From these criteria, 23 species, taken from the Ito et al. chemical mechanism, with the
20
potential to produce SOA were selected (Table 1). All the species were oxygenated derivatives from aromatics, isoprene,α-pinene, limonene and carbonyls.
The formation of SOA from the products of isoprene oxidation is not clear, as some studies show that isoprene produces only minor amounts of SOA, and then only under acidic conditions (Kroll et al., 2005, Pandis et al., 1991, Edney et al., 2005), but other
ACPD
7, 8361–8393, 2007Development of a SOA formation
mechanism
L. E. Olcese et al.
Title Page
Abstract Introduction
Conclusions References
Tables Figures
◭ ◮
◭ ◮
Back Close
Full Screen / Esc
Printer-friendly Version
Interactive Discussion
EGU
studies estimate higher levels of SOA formed from the secondary oxygenated products of isoprene (Henze and Seinfeld, 2006; Matsunaga et al., 2005; van Donkelaar, 2007; Surrat et al., 2006). Henze and Seinfeld (2006) reported that the SOA formed from isoprene can be very important in the free troposphere and in remote marine regions. Smog chamber experiments using isoprene as an SOA precursor are very scarce, and
5
have mostly been performed under acidic conditions. We included isoprene derived species as SOA because they meet the required structural characteristics and because the ambient simulations shown below that used these compounds gave results closer to the experimental values.
Smog chamber experiments have also shown that the semi-volatile photooxidation
10
products of organic compounds tend to polymerize in the aerosol phase in reactions catalyzed by the semi-volatile acidic reaction products (Kalberer et al., 2004). Another smog-chamber study on the effect of acidic seed particles on α-pinene ozonolysis suggested that acidity promotes SOA formation and increases aerosol yield by up to 40% (Iinuma et al., 2004). The acid catalysis and the polymerization reactions have
15
not yet been incorporated into our model, but their inclusion is feasible.
Preliminary simulations under different atmospheric conditions and with different mixes of precursors showed that only 7 of the 23 secondary semi-volatile oxygenated species that have been selected as capable of partitioning to the aerosol phase do, in fact, partition in significant quantities under typical rural and urban atmospheric
20
conditions and patterns of emissions. In the following, since the computational requirements to process the SOA partitioning are very low, all species have been included, but similar results are obtained when including only these species for the particular emission or meteorological conditions, assumed here. Table 1 also shows the partitioning coefficient Ki and the species that partition in significant
25
ACPD
7, 8361–8393, 2007Development of a SOA formation
mechanism
L. E. Olcese et al.
Title Page
Abstract Introduction
Conclusions References
Tables Figures
◭ ◮
◭ ◮
Back Close
Full Screen / Esc
Printer-friendly Version
Interactive Discussion
EGU
A-DI Product of decomposition of carbonyl [C6H5OH(OH)CHO] ACHO Benzaldehyde [C6H5CHO]
IALD Hydroxy carbonyl alkene from isoprene [HOCH2C(CH3)=CHCHO]
INPN Peroxide from isoprene [ONO2CH2C(OOH)(CH3)CH=CH2] ISNP Peroxide from isoprene [HOCH2C(OOH)(CH3)CH(ONO2)CH2OH]
NITP Benzyl nitrate [C6H5ONO2]
PINT Acid from terpenes [ONO2C10H16OOH]
The concentration of each specieAi in the aerosol phase is given by (Pankow, 1994a and Pankow, 1994b):
[Ai]gas=
[Ai]aerosol
Ki M0 (1)
5
M0=[POA]+ X
i=1,n
[Ai]aerosol (2)
Where n is the number of species that can partition to the aerosol phase, [Ai]aerosol
(µg m−3) and [Ai]gas (µg m− 3
) are the concentrations of the specie Ai in the aerosol and gas phase, respectively, andKi (m3µg−1) is its partitioning coefficient between the aerosol and gas phases.M0(µg m−3) is the concentration of total organic aerosols and
10
[POA] (µg m−3) is the concentration of primary organic aerosols. Both equations are solved iteratively (Typically, about five iterations in each time step).
The partitioning coefficientKi for each compound is calculated according to:
Ki = RT
106MW ζ
ipoL,i
(3)
WhereR(8.206×10⁻⁵atm m3mol−1K−1) is the ideal gas constant,T (K) is the temper-15
ature,MW (g mol−1) is the average molecular weight of the absorbing aerosol phase,
ACPD
7, 8361–8393, 2007Development of a SOA formation
mechanism
L. E. Olcese et al.
Title Page
Abstract Introduction
Conclusions References
Tables Figures
◭ ◮
◭ ◮
Back Close
Full Screen / Esc
Printer-friendly Version
Interactive Discussion
EGU
phase,poL,i (atm) is the compound vapor pressure (sub-cooled if necessary) and 106 is a unit conversion factor (gµg−1).
As vapor pressure experimental data for several secondary species is not avail-able, the Myrdal and Yalkowsky (1997) estimation method has been used, with some changes added to include the particular chemical structure of the SOA forming
com-5
pounds (Camredon and Aumont, 2006). The Myrdal and Yalkowsky method estimates the boiling point of a given organic compound based on the Joback group contribution method (Reid et al., 1987), and then estimates the vapor pressure at a given tempera-ture.
Several authors (e.g. Pankow, 1994a and Kamens et al., 1999) have stated that it is
10
reasonable to assume that the value ofζi is equal to one for a given oxidation product in an aerosol droplet composed of a mixture of similar species. Although some methods (Bowman and Karamalegos, 2002) which are also based on group contributions have been proposed to estimate the activity coefficient, we setζi equal to one for simplicity. Activity coefficientsζi are temperature dependant, but their variation with temperature
15
is negligible compared to the temperature dependence of the vapor pressure.
The partition process between the gas phase and the aerosol phase is assumed to be instantaneous, due to the relevant relative reaction and transport time scales, as calculated by Bowman et al. (1997) in a reactor chamber system. Thus, the amount of each secondary compound that partitions to the aerosol phase does not depend on
20
the timestep used, but only on the Eq. (1). The partition equations are solved after the gas phase concentrations are obtained for each step. The updated gas phase concentrations of the secondary compounds are used in the next step.
As the smog chamber experiments last for only a few hours, no wet or dry removal mechanism has been included in the model, although the wall removal processes are
25
ACPD
7, 8361–8393, 2007Development of a SOA formation
mechanism
L. E. Olcese et al.
Title Page
Abstract Introduction
Conclusions References
Tables Figures
◭ ◮
◭ ◮
Back Close
Full Screen / Esc
Printer-friendly Version
Interactive Discussion
EGU
The main sink process for organic aerosols in the ambient atmosphere is wet de-position, which represents 70 to 85% of the total deposition process (Kanakidou et al., 2005), so only this process has been considered in our ambient simulations. De-position is included by assuming a lifetime of seven days, based on the Kanakidou et al. (2005) work and AEROCOM intercomparison results (http://nansen.ipsl.jussieu.
5
fr/AEROCOM/, 2006). Small variations in the lifetime have little effect on the results shown in Sect. 3.2.
3 Simulations and results
To validate the model, two different approaches have been used: One, presented in Sect. 3.1, involves the comparison of the model results with smog chamber
experi-10
ments found in the literature. The second, in Sect. 3.2, involves the comparison of 0-dimensional calculations using with ambient measurements of OA taken during the TORCH 2003 campaign under several conditions. In Sect. 3.3 we also present gen-eralized simulations under urban-influenced and rural atmospheric conditions using representative emission values. In addition, a simulation of a New England plume and
15
comparison with ambient measurements is presented.
3.1 Comparison with smog chamber results
Experimental measurements of SOA formation in smog chambers under controlled conditions and using different precursors are difficult, and therefore only a few results are available in literature. Two different sets of SOA formation smog chamber
exper-20
iments have been selected to test this model; one set of experiments (18 different initial conditions) reported by Takekawa et al. (2003), used toluene, m-xylene andα -pinene as SOA precursors under different NO and NO2 initial concentrations, at two
different temperatures. They also injected propene to accelerate the photochemical reactions, in all the experiments except that involving α-pinene. Kamens and Jaoui
ACPD
7, 8361–8393, 2007Development of a SOA formation
mechanism
L. E. Olcese et al.
Title Page
Abstract Introduction
Conclusions References
Tables Figures
◭ ◮
◭ ◮
Back Close
Full Screen / Esc
Printer-friendly Version
Interactive Discussion
EGU
(2001) performed another set of experiments usingα-pinene as an SOA precursor in the presence of NOx (two different initial conditions).
Kroll et al. (2005) measured SOA concentration in smog chambers using isoprene as precursor, with aqueous ammonium sulfate as initial seed. As our model is not yet able to simulate heterogeneous phase reactions, the results of the experiments are
5
only used to determine the general behavior of the model using isoprene as precursor, but not to make rigorous comparisons.
The Ito et al. (2007) chemical mechanism specifies an average rate constant for the reactions of the o-, m- and p-xylene molecules, thus, this rate constant has been used rather than that of the true m-xylene rate. The difference between this average rate
10
constant and that of m-xylene is 3.75% at 298 K.
Table 2 shows the initial conditions for each smog chamber experiment, as well as the measured SOA concentration at the end of the experiment, the simulated SOA con-centration, and the percentage difference. The average error for all 20 smog chamber simulations is (32±63) %, but some of the experimental results are difficult to under-15
stand, with large differences in the final SOA concentration: A 295% error between the model results and the measurements in PIN-303 (See Table 2 for a description of the cases) seems to be due to a problem in the smog chamber experiment, since the experiments PIN-101 and PIN-303 have very similar initial conditions, and only a small temperature difference (283 K and 303 K, respectively); PIN-101 has a final SOA
20
concentration of 89µg m−3and PIN-303 has only 20µg m3. The differences in the va-por pressure at these temperatures, the change in reaction rates coefficients, and the variation in the partition coefficients are not enough to explain this difference.
If we exclude these two values (shown in italics in Table 2), the average error for all the 18 remaining simulations is (17±13) %, a reasonably small error, considering 25
ACPD
7, 8361–8393, 2007Development of a SOA formation
mechanism
L. E. Olcese et al.
Title Page
Abstract Introduction
Conclusions References
Tables Figures
◭ ◮
◭ ◮
Back Close
Full Screen / Esc
Printer-friendly Version
Interactive Discussion
EGU
range of SOA concentrations, with most of the points having low SOA concentrations. The correlation coefficient for all of the experiments, without including the two highest concentrations, is 0.792.
We also performed simulations of nine different smog chamber experiments that used isoprene as an SOA precursor (Kroll et al., 2005), under different temperatures,
5
O3 and NOx concentrations and initial aqueous ammonium sulfate seed particles.
These simulations produced an average error of 35% (individual data not shown), but since the model does not include heterogeneous phase reactions, nor a different SOA formation mechanism for acidic particles, we did not pursue this mechanism further. The errors obtained in the simulations with highest initial isoprene concentration were
10
those with the higher errors.
3.2 Comparison with ambient measurements
The second set of simulations with our SOA formation mechanism used the experi-mental conditions in the TORCH 2003 experiment (Utembe et al., 2005; Johnson et al., 2006a, b). In this campaign, ambient concentrations of several species as well
15
as organic aerosols were measured in Writtle, Essex, UK, approximately 40 km to the north east of central London. Measurements were made over a period of about one month, under different ambient conditions and plume originating sites. Initial condi-tions, trajectories and emissions were reported. Table 3 shows the trajectory arrival date, the average emissions of anthropogenic and biogenic VOC, the average
emis-20
sions of NOx during the trajectory prior to the measurement site, and the observed and calculated OA concentrations.
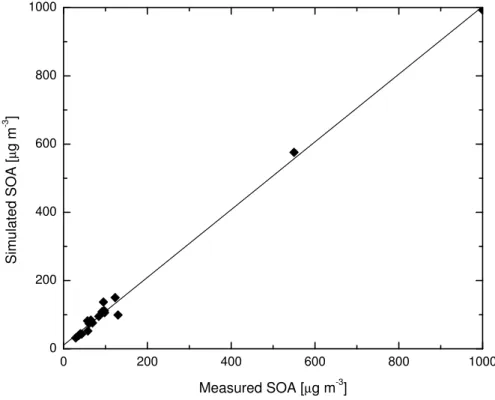
The average error for the nine simulations was (12±6) %. A plot of the correlation
between the measured and the simulated SOA concentrations is presented in Fig. 2, and gives a correlation coefficient equal to 0.942. The average error of 12% is small,
25
and is similar to that obtained in the smog chamber experiments.
ACPD
7, 8361–8393, 2007Development of a SOA formation
mechanism
L. E. Olcese et al.
Title Page
Abstract Introduction
Conclusions References
Tables Figures
◭ ◮
◭ ◮
Back Close
Full Screen / Esc
Printer-friendly Version
Interactive Discussion
EGU
they were able to match the experimental results only if they assumed that gas-aerosol partition coefficients were higher than theoretical values by a factor of 500. Here, results show reasonable agreement with observations without any adjustment to the partition coefficients derived from theory. The possible cause of this difference is the inclusion in this work of different species in the partitioning scheme, mainly derivatives
5
from biogenic precursors. Johnson et al. (2006b) reports that the average contribu-tion of species derived from anthropogenic emissions to the simulated mass of SOA is 60%, but our calculations showed that this contribution is only 25%.
3.3 Ambient simulations
Two simulations were performed using realistic atmospheric concentrations and hourly
10
emissions. The detailed initial conditions and average hourly emissions are presented in Tables 4a and 4b, as well as the final concentration of selected primary and sec-ondary species. Both scenarios were run using the same initial concentrations of gas phase species, but with a different pattern of hourly emissions, that followed a diurnal cycle with peak anthropogenic emissions during morning and afternoon periods of high
15
traffic in the urban-influenced case (based on average diurnal variations in EPA inven-tories, available athttp://www.epa.gov/ttn/chief/net/1999inventory.html#final3crit), and with the diurnal variation in the biogenic emissions in both the rural and the urban-influenced cases. Initial concentrations were based on typical conditions in rural north-ern Michigan, with total volatile organics equal to 5 ppbC.
20
A brief description of the initial conditions and emissions is:
– Rural site (Michigan, U.S.): Represents typical rural values for background con-centrations and emissions that reflect conditions in northern Michigan. Emission rates were rural, and lower than would be found in more populated regions.
– Urban-influenced site (Pennsylvania and Ohio, U.S.): Represents average
emis-25
ACPD
7, 8361–8393, 2007Development of a SOA formation
mechanism
L. E. Olcese et al.
Title Page
Abstract Introduction
Conclusions References
Tables Figures
◭ ◮
◭ ◮
Back Close
Full Screen / Esc
Printer-friendly Version
Interactive Discussion
EGU
of Pennsylvania and Ohio, including large cities, power plants and large rural ar-eas. Similar to the average emission rates across the eastern U.S.
Simulations were performed for a three-day period, beginning on 1 March. The initial POA concentration was 1µg m−3, there were no additional POA emissions during the simulation and the aerosol removal time constant was seven days. The calculations
5
assume a constant mixing height of 5000 m, typical of the height of the daytime mixed layer in the eastern U.S., a temperature of 25◦C and no clouds.
Two different schemes were used, one allowing the evaporation of compounds from the aerosol phase (assuming continuous equilibrium with the gas phase) and an-other preventing evaporation. In the results presented here, only the non-evaporating
10
scheme was used as this has been shown to better reproduce experimental measure-ments (Tsigaridis and Kanakidou, 2003). Results that assume continuous equilibrium produce less SOA by a factor of 1.1.
The final concentration of relevant secondary compounds that partition to the aerosol phase is shown in Table 5, as well as the gas-phase concentrations of these
com-15
pounds and their precursors. The total amount of SOA formed after the three days was 10.2µg m−3in the urban-influenced site and 7.2µg m−3in the rural site.
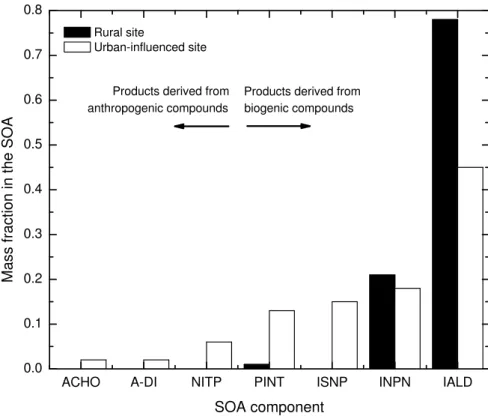
In Fig. 3 we show the fraction of each partitioning compound in the aerosol phase at the end of the three-day simulation. From the analysis of the plot, it is clear that in the aerosol phase, the secondary species formed from the biogenic compounds (PINT,
20
ISNP, INPN, IALD) partition into the aerosol phase much more readily than those of anthropogenic origin (ACHO, A-DI, NITP), in both scenarios. The fraction of species formed from biogenic compounds account for about 90% of the total SOA mass in the urban influenced scenario and about 97% in the rural scenario.
A study of the dependence of the final SOA concentration on the VOC/NOx
emis-25
ACPD
7, 8361–8393, 2007Development of a SOA formation
mechanism
L. E. Olcese et al.
Title Page
Abstract Introduction
Conclusions References
Tables Figures
◭ ◮
◭ ◮
Back Close
Full Screen / Esc
Printer-friendly Version
Interactive Discussion
EGU
more SOA, and 3% more for the urban-influenced site. In contrast, an increase of 10% in the VOC emissions leads to an increase of less than 1% in the mass of SOA produced in the both rural and urban-influenced sites. This suggests that the observed distribution of SOA may reflect the distribution of NOx, which is primarily anthropogenic in origin, even when the SOA is formed from biogenic rather than anthropogenic VOC.
5
This possibility was also mentioned by De Gouw et al. (2005) work, described below. The second ambient simulation consists of a 0-d calculation with initial conditions derived from the measurement-based estimates of De Gouw et al. (2005). De Gouw et al. (2005) used measured ratios between individual anthropogenic VOC and C2H2 in
order to derive ambient OH, age, and the initial concentrations of primary VOC. They
10
similarly estimated the initial concentration of isoprene from measured concentrations of isoprene reaction products (methylvinyl ketone and methacrolein). Sources of other biogenic species were estimated based on correlations between measured reaction products and the derived isoprene. Terpenes were estimated from measured mixing ratio of monoterpenes. However, these species did not form SOA in their calculation.
15
The study included a series of measurements of primary and secondary gas-phase organic species and organic aerosols during summer, 2002, from a ship located offthe coast of Massachusetts and New Hampshire. The resulting measurements included an anthropogenic VOC that was representative of an average U.S. city, along with biogenic VOC reflecting the influence of forested regions in New England. There was evidence
20
of direct influence of emissions from New York and Boston, but little evidence of impact from power plant emissions (De Gouw et al., 2005). The measured organic aerosols showed a correlation pattern that suggested that they were formed mainly through sec-ondary photochemical production and were from anthropogenic sources. However, De Gouw et al. (2005) found that the amount of measured SOA was significantly greater
25
ACPD
7, 8361–8393, 2007Development of a SOA formation
mechanism
L. E. Olcese et al.
Title Page
Abstract Introduction
Conclusions References
Tables Figures
◭ ◮
◭ ◮
Back Close
Full Screen / Esc
Printer-friendly Version
Interactive Discussion
EGU
We simulated these conditions using the initial estimates of primary anthropogenic and biogenic VOC for a period of 50 h, matching the inferred time for photochemi-cal processing. We also assumed initial concentrations of the measured oxygenated species based on the previous 3-day calculations of urban-influencedconditions in the eastern U.S. Initial POA was set at 1µg m−3
, corresponding to the measured value
5
from De Gouw et al. (2005) for air with photochemical age less than one hour. Initial conditions are shown in Tables 4a and b.
Figure 4 shows the evolution of POM during the 50-h simulation with primary organic species derived directly from De Gouw et al. (2005). Results can be compared directly with the evolution of POM as a function of photochemical age derived from
measure-10
ments (Fig. 14c in De Gouw et al., 2005). Results compare closely with those reported by De Gouw et al. (2005). The main difference is due to the inclusion in our study of the diurnal cycle of radiation, since the de Gouw et al. work calculates concentrations using average rate constants and daily average OH concentrations. The final amount of SOA formed after 50 h is similar in both cases; 7.2µg m−3in the Gouw et al. (2005)
15
work and 7µg m−3in our model. The calculation shows a large increase in SOA during the first day of the simulation due to the initialization of gas-phase oxygenated interme-diate compounds in our model. Our results showed that secondary aerosol formation from anthropogenic sources alone was unable to account for the observed 7µg m−3 POM, a result that is consistent with De Gouw et al. (2005) However, our mechanism
20
resulted in significant aerosol formation from biogenic sources (about 65% of the final SOA concentration), which resulted in total POM matching the observed value.
4 Conclusions
We have presented a chemical mechanism together with partitioning coefficients that represents direct chemical pathways for formation os SOA from gas-phase species.
25
ACPD
7, 8361–8393, 2007Development of a SOA formation
mechanism
L. E. Olcese et al.
Title Page
Abstract Introduction
Conclusions References
Tables Figures
◭ ◮
◭ ◮
Back Close
Full Screen / Esc
Printer-friendly Version
Interactive Discussion
EGU
near London, and (iii) the New England Air Quality Study. In each case the resulting SOA formation compares reasonably well with measurements. In the case of TORCH, results represent a significant improvement over previous calculations.
The main advantage of this model, compared to other representations of SOA forma-tion, is that the partitioning and stoichiometric coefficients are not fitted to experimental
5
data, but calculated, making the model more flexible and able to include new com-pounds or to use new chemical mechanisms. The only data required are the species that can partition to the aerosol phase, and their vapor pressures (measured or esti-mated).
Calculations designed to represent conditions in the eastern U.S. suggested that
10
secondary organic products derived from biogenic emissions are responsible for most of the mass of the secondary organic aerosols. This fact is in agreement with previous modeling results (Chung and Seinfeld, 2002). It may be possible that some anthro-pogenic sources of SOA are missing from our mechanism, since other mechanisms cannot reproduce recently measured results off of Asia (Heald et al., 2005) or from
15
Mexico City (Volkamer et al., 2006). Our mechanism does not appear to include signif-icantly larger anthropogenic source of SOA than previous mechanisms.
In the simulation based on the New England Air Quality Study the resulting SOA and its variation with photochemical age compared closely with values derived from measurements. These results are consistent with the conclusion from De Gouw et
20
al. (2005) that organics from anthropogenic sources are not sufficient to supply as much SOA as observed. In our calculation approximately 60% of the secondary or-ganic aerosols are associated with biogenic emissions, while the remainder is from the oxidation of initial anthropogenic compounds.
From correlations between primary and secondary species, De Gouw et al.
sug-25
ACPD
7, 8361–8393, 2007Development of a SOA formation
mechanism
L. E. Olcese et al.
Title Page
Abstract Introduction
Conclusions References
Tables Figures
◭ ◮
◭ ◮
Back Close
Full Screen / Esc
Printer-friendly Version
Interactive Discussion
EGU
further test of the mechanism in a 3-d simulation will be necessary to identify whether the pattern of variation of SOA found by De Gouw et al. (2005) might be produced by a combination of biogenic VOC and anthropogenic NOx. The global amount of
emis-sions of the different species that have the potential to react with an oxidant and then form SOA is uncertain (Kanakidou et al, 2005), but several estimates of global VOC
5
emissions are available.
Isoprene accounts for about half of all natural VOC (Volatile organic compounds) emissions; its estimated global emissions range between 250 and 750 Tg C y−1 (Wiedinmyer et al., 2004). Global emissions of terpenes (excluding isoprene) are 127.4 Tg y−1 (Guenther et al., 1995), although the SOA formation potential of the
dif-10
ferent terpenes is quite dissimilar.
The sum of the emissions of all the different anthropogenic aromatics species is estimated to be 15.8 Tg y−1 (Olivier et al., 1999), and are mostly toluene and xylene. These emissions add up to about 10–15% of all anthropogenic NMVOC (non-methane volatile organic compounds) emissions.
15
An estimate of the annual global SOA production can be made by scaling the amount of SOA produced in two different three day simulations, using the rural and urban-influenced atmospheres. The scaling factor used was the quotient between the annual SOA estimates presented by Tsigaridis and Kanakidou (2003), and the results obtained from the rural and urban-influenced atmospheres, but using the two-product scheme
20
from Tsigaridis and Kanakidou (2003).
Using the primary emissions mentioned above and the range reported for isoprene, the estimated SOA production is 35.2–235 Tg y−1, higher than other recent estimates (For example, Henze and Seinfeld, 2006 calculated 16.4 Tg y−1, and Tsigaridis and Kanakidou, 2003 calculated 2.5–46 Tg y−1), but the Tsigaridis and Kanakidou estimate
25
ACPD
7, 8361–8393, 2007Development of a SOA formation
mechanism
L. E. Olcese et al.
Title Page
Abstract Introduction
Conclusions References
Tables Figures
◭ ◮
◭ ◮
Back Close
Full Screen / Esc
Printer-friendly Version
Interactive Discussion
EGU
Future work will include the development of a wet and dry removal process for SOA, based on the removal processes for aerosols in our global aerosol model. Other future improvements to the model include the addition of reactions in the aerosol and hetero-geneous phase, such as dimerization and polymerization to simulate the process of aerosol aging.
5
The SOA formation module will be incorporated into the IMPACT 3-D global chemical transport model. This model can be run in a chemistry only mode (Ito et al., 2006) or in a aerosol only mode (Liu et al., 2005), but without inclusion of secondary organic aerosol formation. In the future, we plan to couple these two operational modes and then add the SOA formation mechanism, to simulate the concentrations of SOA on a
10
global scale, with updated POM and BC emission inventories (Ito and Penner, 2005).
Acknowledgements. Support for this research was provided by a grant to J. E. Penner from the NASA GMI Program under contract NNG06GE78G, “Development of a Coupled Aerosol-Chemistry Model”. Additional support was provided to S. Sillman by the National Science Foundation under grant No. 0454838. Any opinions, findings, and conclusions or
recommen-15
dations expressed in this material are those of the author(s) and do not necessarily reflect the views of the National Science Foundation.
References
Bowman, F. H., Odum, J. R., Seinfeld, J. H., and Pandis, S. N.: Mathematical model for gas-particle partitioning of secondary organic aerosols, Environ. Sci. Technol., 31, 3921–3931,
20
1997.
Bowman, F. M. and Karamalegos, A. M.: Estimated Effects of Composition on Secondary Organic Aerosol Mass Concentrations, Environ. Sci. Technol., 36, 2701–2707, 2002. Camredon, M. and Aumont, B.: Assessment of vapor pressure estimation methods for
sec-ondary organic aerosol modeling, Atmos. Environ., 40, 2105–2116, 2006.
25
Chung, S. H. and Seinfeld, J. H.: Global distribution and climate forcing of carbonaceous aerosols, J. Geophys. Res., 107, 4407–4440, 2002.
ACPD
7, 8361–8393, 2007Development of a SOA formation
mechanism
L. E. Olcese et al.
Title Page
Abstract Introduction
Conclusions References
Tables Figures
◭ ◮
◭ ◮
Back Close
Full Screen / Esc
Printer-friendly Version
Interactive Discussion
EGU
Fehsenfeld, F. C., Worsnop, D. R., Canagaratna, M. R., Pszenny, A. A. P., Keene, W. C., Marchewka, M., Bertman, S. B., and Bates, T. S.: Budget of organic carbon in a polluted atmosphere: Results from the New England Air Quality Study in 2002, J. Geophys. Res., 110, 16 305–16 327, 2005.
Edney, E. O., Kleindienst, T. E., Jaoui, M., Lewandowski, M., Offenberg, J. H., Wang, W., and
5
Claeys, M.: Formation of 2-methyl tetrols and 2-methylglyceric acid in secondary organic aerosol from laboratory irradiated isoprene/NOx/SO2/air mixtures and their detection in am-bient PM samples collected in the eastern United States, Atmos. Environ., 39, 5281–5289, 2005.
Griffin, R. J., Dabdub, D., and Seinfeld, J. H.: Secondary organic aerosol: I. Atmospheric
10
chemical mechanism for production of molecular constituents, J. Geophys. Res., 107, 4332– 4358, 2002.
Guenther, A., Hewitt, C. N., Erickson, D., Fall, R., Geron, C., Graedel, T., Harley, P., Klinger, L., Lerdau, M., McKay, W., Pierce, T., Scholes, B., Steinbrecher, R., Tallamraju, R., Taylor, J. and Zimmerman, P.: A global model of natural volatile organic compound emissions, J.
15
Geophys. Res., 100, 8873–8892, 1995.
Heald, C. L., Jacob, D. J., Park, R. J., Russell, L. M., Huebert, B. J., Seinfeld, J. H., Liao, H., and Weber, R. J.: A large organic aerosol source in the free troposphere missing from current models, Geophys. Res. Lett., 32 , 1–4, 2005.
Henze, D. K. and Seinfeld, J. H.: Global secondary organic aerosol from isoprene oxidation,
20
Geophys. Res. Lett., 33 , L09812, doi:10.1029/2006GL025976, 2006.
Hoffmann, T., Odum, J. R., Bowman, F., Collins, D., Klockow, D., Flagan, R. C., and Seinfeld, J. H.: Formation of organic aerosols from the oxidation of biogenic hydrocarbons, J. Atmos. Chem., 26, 189–222, 1997.
Iinuma, Y., B ¨oge, O., Gnauk, T., and Herrmann, H.: Aerosolchamber study of theα-pinene/O3
25
reaction: influence of particle acidity on aerosol yields and products, Atmos. Environ., 38, 761–773, 2004.
Ito, A. and Penner, J. E.: Historical emissions of carbonaceous aerosols from biomass and fossil fuel burning for the period 1870–2000, Global Biogeochem. Cycles, GB2028, 1–14, 2005.
30
ACPD
7, 8361–8393, 2007Development of a SOA formation
mechanism
L. E. Olcese et al.
Title Page
Abstract Introduction
Conclusions References
Tables Figures
◭ ◮
◭ ◮
Back Close
Full Screen / Esc
Printer-friendly Version
Interactive Discussion
EGU
Johnson, D., Utembe, S. R., and Jenkin, M. E.: Simulating the detailed chemical composition of secondary organic aerosol formed on a regional scale during the TORCH 2003 campaign in the southern UK, Atmos. Chem. Phys., 6, 419–431, 2006b.
Johnson, D., Utembe, S. R., Jenkin, M. E., Derwent, R. G., Hayman, G. D., Alfarra, M. R., Coe, H., and McFiggans, G.: Simulating regional scale secondary organic aerosol formation
5
during the TORCH 2003 campaign in the southern UK, Atmos. Chem. Phys., 6, 403–418, 2006a.
Kalberer, M., Paulsen, R.D., Sax, M., Steinbacher, M., Dommen, J., Prevot, A. S. H., Fis-seha, R., Weingartner, E., Frankevich, V., Zenobi, R., and Baltensperger, U.: Identification of polymers as major components of atmospheric organic aerosols, Science, 303, 1659–1662,
10
2004.
Kamens, R. M. and Jaoui, M.: Modeling aerosol formation fromα-pinene+NO in the presence of natural sunlight using gas-phase kinetics and gas-particle partitioning theory, Environ. Sci. Technol., 35, 1394–1405, 2001.
Kamens, R. M., Jang, M., Chien, C.-J., and Leach, K.: Aerosol formation from the reaction
15
ofα-pinene and ozone using a gas phase kinetics-aerosol partitioning model, Environ. Sci. Technol., 33, 1430–1438, 1999.
Kanakidou, M., Seinfeld, J. H., Pandis, S. N., Barnes, I., Dentener, F. J., Facchini, M. C., van Dingenen, R., Ervens, B., Nenes, A., Nielsen, C. J., Swietlicki, E., Putaud, J.P., Balkanski, Y., Fuzzi, S., Horth, J., Moortgat, G. K., Winterhalter, R., Myhre, C. E. L., Tsigaridis, K., Vignati,
20
E., Stephanou, E. G., and Wilson, J.: Organic aerosol and climate modelling: A review, Atmos Chem. Phys., 5, 1053–1123, 2005.
Kroll, J. H., Ng, N. L., Murphy, S. M., Flagan, R. C., and Seinfeld, J. H.: Secondary organic aerosol formation from isoprene photooxidation under high-NOx conditions, Geophys. Res. Lett., 32, L18808, 1–4, 2005.
25
Liu, X., Penner, J. E., and Herzog, M.: Global modeling of aerosol dynamics: Model description, evaluation, and interactions between sulfate and nonsulfate aerosols, J. Geophys. Res, 111, D18206, doi:10.1029/2004JD005674, 2005.
Matsunaga, S. N., Wiedinmyer, C., Guenther, A. B., Orlando, J. J., Karl, T., Toohey, D. W., Greenberg, J. P., and Kajii, Y.: Isoprene oxidation products are a significant atmospheric
30
aerosol component, Atmos. Chem. Phys. Discuss., 5, 11 143–11 156, 2005.
ACPD
7, 8361–8393, 2007Development of a SOA formation
mechanism
L. E. Olcese et al.
Title Page
Abstract Introduction
Conclusions References
Tables Figures
◭ ◮
◭ ◮
Back Close
Full Screen / Esc
Printer-friendly Version
Interactive Discussion
EGU
Olivier, J. G. J., Bloos, J. P. J., Berdowski, J. J. M., Visschedijk, A. J. H., and Bouwman, A. F.: A 1990 global emission inventory of anthropogenic sources of carbon monoxide on 1◦
×1◦
developed in the framework of EDGAR/GEIA, Chemosphere, Global Change Science, 1, 1–17, 1999.
Pandis, S. N., Paulson, S. E., Seinfeld, J. H., and Flagan, R. C.: Aerosol formation in the
5
photooxidation of isoprene andβ-pinene, Atmos. Environ., 25, 997–1008, 1991.
Pankow, J. F.: An absorption model of gas/particle partitioning of organic compounds in the atmosphere, Atmos. Environ., 28, 185–188, 1994b.
Pankow, J. F.: An absorption model of gas/particle partitioning involved in the formation of secondary organic aerosol, Atmos. Environ., 28, 189–193, 1994a.
10
Pun, B. K., Seigneur, C., and Lohman, K.: Modeling secondary organic aerosol formation via multiphase partitioning with molecular data, Environ. Sci. Technol., 40, 4722–4731, 2006. Reid, R. C., Prausnitz, J. M., and Polling, B. E.: The properties of gases and liquids, Hill, New
York, USA, 1987.
Sillman, S.: A numerical solution for the equations of tropospheric chemistry based on an
15
analysis of sources and sinks of odd hydrogen, J. Geophys. Res., 96, 735–744, 1991. Surratt, J. D., Murphy, S. M., Kroll, J. H., Ng, N. L., Hildebrandt, L., Sorooshian, A., Szmigielski,
R., Vermeylen, R., Maenhaut, W., Claeys, M., Flagan, R. C., and Seinfeld, J. H.: Chemical Composition of Secondary Organic Aerosol Formed from the Photooxidation of Isoprene, J. Phys. Chem. A, 110, 9665–9690, 2006.
20
Takekawa, H., Minoura, H., and Yamazaki, S.: Temperature dependence of secondary organic aerosolformation by photooxidation of hydrocarbons, Atmos. Environ., 37, 3413–3424, 2003. Tsigaridis, K. and Kanakidou M.: Global modeling of secondary organic aerosol in the
tropo-sphere: A sensitivity analysis, Atmos. Chem. Phys., 3, 1849–1869, 2003, http://www.atmos-chem-phys.net/3/1849/2003/.
25
Turpin, B. J. and Huntzicker, J. J.: Identifications of secondary organic aerosol episodes and quantification of primary and secondary organic aerosol concentration, Atmos. Environ., 29, 3527–3544, 1995.
Utembe, S. R., Jenkin, M. E., Derwent, R. G., Lewis, A. C., Hopkins, J. R., and Hamilton, J. F.: Modelling the ambient distribution of organic compounds during the August 2003 ozone
30
episode in the southern UK, Faraday Discuss., 130, 311–326, 2005.
ACPD
7, 8361–8393, 2007Development of a SOA formation
mechanism
L. E. Olcese et al.
Title Page
Abstract Introduction
Conclusions References
Tables Figures
◭ ◮
◭ ◮
Back Close
Full Screen / Esc
Printer-friendly Version
Interactive Discussion
EGU
Envir., 41, 1267–1275, 2007.
Volkamer, R., Jimenez, J. L., San Martini, F., Dzepina, K., Zhang, Q., Salcedo, D., Molina, L. T. D., Worsnop, R., and Molina, M. J.: Secondary organic aerosol formation from anthro-pogenic air pollution: Rapid and higher than expected, Geophys. Res. Lett., 33, L17811, doi:10.1029/2006GL026899, 2006.
5
Wiedinmyer, C., Guenther, A., Harley, P., Hewitt, N., Geron, C., Artaxo, P., Steinbrecher, R., and Rasmussen, R.: Global Organic Emissions from Vegetation, in: Emissions of Atmospheric Trace Compounds, edited by: Granier, C., Artaxo, P., and Reeves, C., Kluwer Academic Publishers, Dordrecht, The Netherlands, 115–170, 2004.
Zhang, Y., Pun, B., Vijayaraghavan, K., Wu, S.-Y., Seigneur, C., Pandis, S. N., Jacobson, M.
10
ACPD
7, 8361–8393, 2007Development of a SOA formation
mechanism
L. E. Olcese et al.
Title Page
Abstract Introduction
Conclusions References
Tables Figures
◭ ◮
◭ ◮
Back Close
Full Screen / Esc
Printer-friendly Version
Interactive Discussion
EGU
Table 1. List of species that can partition to the aerosol phase, chosen depending on their
chemical structure.
Name Partition in significant Partitioning coefficient at 298 K Description quantities? and 1 atm [m3µg−1
]
A-DI Yes 2.01×10⁻³
C6H5OH(OH)CHO
ACHO Yes 3.29×10⁻¹
C6H5CHO
AD2P No 2.71×10¹³ C6H5(CH3)OH(OH)OOH
AP No 9.18×10¹⁴ C6H5OH(OH)CO3H
APAN No 1.01×10¹¹ C6H5OH(OH)CO3NO2
DPAN No 1.50×100 CHOCH=CHCO3NO2
GPAN No 5.19×100 HOCH2C(O)OONO2
IALD Yes 1.26×10² HOCH2C(CH3)=CHCHO
IAP No 1.07×10¹⁴ HOCH2C(CH3)(OOH)CH(OH)CHO
INPN Yes 4.89×10³ NO2OCH2C(OOH)(CH3)CH=CH2
ISNP Yes 1.19×10¹⁵ HOCH2C(OOH)(CH3)CH(ONO2)CH2OH
LIP No 3.34×10¹⁰ HOC10H16OOH
MRP No 3.14×10⁷ HOCH2C(OOH)(CH3)CHO
NITP Yes 4.38×100 C6H5ONO2
PINT Yes 1.76×10⁸ ONO2C10H16OOH
PIP No 1.05×10⁹ HOC10H16OOH
VRP No 1.48×10⁸ HOCH2CH(OOH)C(O)CH3
XAP No 6.14×10⁵ CH3COCH=CH(O)OOH
XPAN No 1.84×101 CH3COCH=CHCO3NO2
YAP No 1.15×10² CHOCH=C(CH3)C(O)OOH
YPAN No 8.54×100 CHOCH=C(CH3)CO3NO2
ZAP No 2.27×10⁴ CHOC(CH3)=CHC(O)OOH
ACPD
7, 8361–8393, 2007Development of a SOA formation
mechanism
L. E. Olcese et al.
Title Page
Abstract Introduction
Conclusions References
Tables Figures
◭ ◮
◭ ◮
Back Close
Full Screen / Esc
Printer-friendly Version
Interactive Discussion
EGU
Table 2.Comparison with results from smog chamber experiments.
Name HC NO NO2 Temp Time Measured Simulated Difference
SOA SOA [ppm] [ppm] [ppm] [K] [h] [µg m−3] [
µg m−3]
PIN-101a α-Pinene – 0.100 0.053 0.028 283 4 89 100 12%
PIN-102a α−Pinene – 0.081 0.043 0.021 283 4 65 84 30% PIN-103a α−Pinene – 0.055 0.030 0.025 283 4 36 39 9% PIN-301a α−Pinene – 0.196 0.102 0.050 303 4 95 137 44% PIN-302a α−Pinene – 0.146 0.080 0.039 303 4 58 52 10%
PIN-303a α-Pinene – 0.093 0.054 0.031 303 4 20 79 295%
TOL-101a Toluene – 2.64 / C3H6– 1.0 0.118 0.116 283 4 84 95 13% TOL-102a Toluene – 3.25 / C3H6– 1.1 0.142 0.142 283 4 97 112 15% TOL-103a Toluene – 2.20 / C3H6– 1.1 0.094 0.092 283 4 61 74 22%
TOL-301a Toluene – 4.33 / C3H6– 0.9 0.211 0.202 303 4 92 109 18%
TOL-302a Toluene – 3.35 / C3H6– 1.0 0.169 0.168 303 4 57 82 43%
TOL-303a Toluene – 2.61 / C3H6– 1.1 0.150 0.129 303 4 29 32 11%
XYL-101a m-Xylene – 2.19 / C3H6– 1.1 0.098 0.087 283 4 130 99 24%
XYL-102a m-Xylene – 1.57 / C3H6– 1.2 0.073 0.074 283 4 69 76 10%
XYL-103a m-Xylene – 1.12 / C3H6– 1.0 0.062 0.062 283 4 40 44 9%
XYL-301a m-Xylene – 3.13 / C3H6– 1.0 0.153 0.139 303 4 123 150 22% XYL-302a m-Xylene – 1.98 / C3H6– 1.0 0.100 0.096 303 4 43 43 1% XYL-303a m-Xylene – 2.83 / C3H6– 1.0 0.144 0.131 303 4 98 106 8%
6/9/99: light, NOxb α−Pinene – 0.98 0.43 0.002 295-315 3.6 550 576 5%
10/30/99: light, NOxb α−Pinene – 0.94 0.485 0.002 300-308 3.6 1000 993 1%
a
Measured by Takekawa et al. (2003) b
Measured by Kamens et al. (1999)
ACPD
7, 8361–8393, 2007Development of a SOA formation
mechanism
L. E. Olcese et al.
Title Page
Abstract Introduction
Conclusions References
Tables Figures
◭ ◮
◭ ◮
Back Close
Full Screen / Esc
Printer-friendly Version
Interactive Discussion
EGU
Table 3.Comparison with experimental results in the TORCH 2003 campaign.
Trajectory arrival date
Average emission of anthopogenic VOC [µg m−2
h−1
]
Average emission of biogenic VOC [µg m−2
h−1
]
Average emis-sion of NOx [µg m−2
h−1
]
Observed OA [µg m−3
]
Simulated OA [µg m−3
]
Difference
July 07, 2003 234 9.08 243 1.91 1.54 19%
Aug 02, 2003 496 21.8 403 3.64 2.79 23%
Aug 04, 2003 349 23.4 323 4.02 3.40 15%
Aug 06, 2003 1102 102 941 6.92 7.95 15%
Aug 08, 2003 189 28.4 306 5.52 4.86 12%
Aug 16, 2003 96 12.2 80.2 0.84 0.76 9%
Aug 18, 2003 507 14.7 354 2.78 2.91 5%
Aug 19, 2003 138 10.9 214 1.24 1.20 4%
ACPD
7, 8361–8393, 2007Development of a SOA formation
mechanism
L. E. Olcese et al.
Title Page Abstract Introduction Conclusions References Tables Figures ◭ ◮ ◭ ◮ Back Close
Full Screen / Esc
Printer-friendly Version
Interactive Discussion
EGU
Table 4a. Initial concentrations, hourly emissions and final concentrations for the three-day
rural simulation.
Compound Initial Average hourly Final concentration emission concentration [molec cm−3] [molec cm−2] [molec cm−3]
O3 9.4×10¹¹ 0 2.7×10¹¹
NO2 3.0×10⁸ 1.5
×109 5.2 ×10⁹
NO 3.0×10⁸ 3.1
×1010 1.1 ×10⁷
Acetone 2.0×10⁹ 2.6×10⁸ 2.7×10⁹ Benzaldehyde 0 0 1.4×10³
Formic acid 0 0 2.5×10⁹ Acetic acid 0 0 9.1×10⁹
Acetaldehyde 1.0×10⁸ 1.5×10⁸ 5.6×10¹⁰ Alkanes C 4-5 2.0×10⁸ 8.3
×109 1.4 ×10¹⁰
Alkanes C 6-8 2.0×10⁶ 4.1×10⁹ 6.8×10⁹
α−pinene 1.0×10⁹ 1.0
×1010 1.5 ×10⁹
Benzene 2.0×10⁷ 4.7×10⁹ 8.1×10⁹ Trans-2-butene 0 8.5×10⁸ 5.1
×107
Ethane 2.0×10⁸ 5.0×10⁸ 1.1×10⁹ Propane 2.0×10⁷ 1.6
×109 2.8 ×10⁹
Cresol 0 0 9.7×10⁶
Dicarbonyl 0 0 2.0×10⁷
Dimethyl phenol 0 0 5.1×10⁷ Ethanol 0 0 9.5×10¹⁰
Ethene 1.0×10⁶ 2.8×10⁹ 4.2×10⁹ Glycoaldehyde 0 0 6.4×10⁹
Glyoxal 0 0 2.8×10⁸ Hydroxyacetone 0 0 3.7×10¹⁰
Formaldeyhde 1.5×10⁹ 7.4×10⁸ 4.5×10¹¹ Isoprene nitrate 0 0 5.4×10⁹
Isoprene 1.0×10⁹ 4.0×10¹² 4.70×10¹¹ Limonene 1.0×10⁹ 1.0
×1010 6.1 ×10⁸
Methacrolein 0 0 2.1×10¹¹
Ketones C>3 1.0×10⁸ 2.6
×108 1.2 ×10¹⁰
Methylglyoxal 0 0 2.2×10¹⁰
Methanol 0 0 1.3×10¹¹
Methylhydroperoxide 0 0 1.8×10¹⁰
Peroxymethacryloyl nitrate 0 0 8.5×10⁹ Methylvinylketone 0 0 9.9×10¹⁰
Benzyl nirate 0 0 8.8×10³ Peroxyacetylnitrate 7.5×10⁹ 0 3.6
×108
Phenol 0 0 1.3×10⁷
Peroxypropionylnitrate 5.0×10⁸ 0 1.4 ×10⁷
Alkenes C>4 0 2.2×10⁹ 3.0×10¹⁰ Aldehydes C>2 2.0×10⁷ 5.0
×107 1.7 ×10⁹
Higher order organic acid 0 0 1.5×10¹⁰ Alcohols C>2 0 0 4.2×10⁸
Toluene 2.0×10⁶ 2.2×10⁹ 3.8×10⁹ m-xylene 0 2.2×10⁹ 3.3
ACPD
7, 8361–8393, 2007Development of a SOA formation
mechanism
L. E. Olcese et al.
Title Page Abstract Introduction Conclusions References Tables Figures ◭ ◮ ◭ ◮ Back Close
Full Screen / Esc
Printer-friendly Version
Interactive Discussion
EGU
Table 4b. Initial concentrations, hourly emissions and final concentrations for the three-day
urban-influenced simulation.
Compound Initial Average hourly Final concentration emission concentration [molec cm−3] [molec cm−2] [molec cm−3]
O3 9.4×10¹¹ 0 1.1×10¹²
NO2 3.0×10⁸ 1.5
×1010 6.8 ×10¹⁰
NO 3.0×10⁸ 4.6
×1011 4.5 ×10⁷
Acetone 2.0×10⁹ 2.0×10⁹ 2.2×10¹⁰ Benzaldehyde 0 0 1.2×10⁵
Formic acid 0 0 2.2×10⁹
Acetic acid 0 0 6.2×10⁸
Acetaldehyde 1.0×10⁸ 9.1×10⁸ 3.3×10¹⁰ Alkanes C 4-5 2.0×10⁸ 6.2
×1010 7.6 ×10¹⁰
Alkanes C 6-8 2.0×10⁶ 3.1×10¹⁰ 2.7×10¹⁰
α−pinene 1.0×10⁹ 1.0
×1010 9.5 ×10⁶
Benzene 2.0×10⁷ 4.3×10¹⁰ 6.4×10¹⁰ Trans-2-butene 0 5.3×10⁹ 5.9
×107
Ethane 2.0×10⁸ 4.0×10⁹ 6.9×10⁹ Propane 2.0×10⁷ 1.2
×1010 1.8 ×10¹⁰
Cresol 0 0 2.4×10⁴
Dicarbonyl 0 0 2.2×10⁹
Dimethyl phenol 0 0 2.4×10⁴ Ethanol 0 0 9.5×10⁸
Ethene 1.0×10⁶ 3.4×10¹⁰ 2.2×10¹⁰ Glycoaldehyde 0 0 1.6×10¹⁰
Glyoxal 0 0 8.5×10⁹ Hydroxyacetone 0 0 1.7×10¹⁰
Formaldeyhde 1.5×10⁹ 8.1
×109 1.3 ×10¹¹
Isoprene nitrate 0 0 2.6×10⁹
Isoprene 1.0×10⁹ 4.0
×1011 2.23 ×10¹⁰
Limonene 1.0×10⁹ 1.0×10¹⁰ 4.8×10⁶ Methacrolein 0 0 2.1×10⁹
Ketones C>3 1.0×10⁸ 2.0×10⁹ 1.7×10¹⁰ Methylglyoxal 0 0 6.8×10⁹
Methanol 0 0 3.7×10⁹ Methylhydroperoxide 0 0 7.9×10⁸
Peroxymethacryloyl nitrate 0 0 1.0×10⁹ Methylvinylketone 0 0 1.3×10⁹
Benzyl nirate 0 0 3.0×10³ Peroxyacetylnitrate 7.5×10⁹ 0 2.2
×1010
Phenol 0 0 1.8×10⁵
Peroxypropionylnitrate 5.0×10⁸ 0 4.0 ×10⁹
Alkenes C>4 0 2.3×10¹⁰ 3.4×10⁹ Aldehydes C>2 2.0×10⁷ 3.1
×108 4.3 ×10⁹
Higher order organic acid 0 0 8.1×10⁷ Alcohols C>2 0 0 1.5×10⁸
Toluene 2.0×10⁶ 2.0×10¹⁰ 2.2×10¹⁰ m-xylene 0 1.3×10¹⁰ 4.8
ACPD
7, 8361–8393, 2007Development of a SOA formation
mechanism
L. E. Olcese et al.
Title Page
Abstract Introduction
Conclusions References
Tables Figures
◭ ◮
◭ ◮
Back Close
Full Screen / Esc
Printer-friendly Version
Interactive Discussion
EGU
Table 5. Final concentrations of the most important compounds that produce SOA in the
am-bient simulations.
Compound Aerosol phase
Urban-influenced site [µg m−3
]
Aerosol phase Rural site [µg m−3
]
Gas phase Urban-influenced site
[µg m−3 ]
Gas phase Rural site [µg m−3
]
A-DI 1.18×10⁻¹ 9.40×10⁻⁴ 2.48×10⁻¹ 1.29×10⁻³
ACHO 1.15×10⁻¹ 4.83×10⁻⁴ 2.17×10⁻⁵ 2.51×10⁻⁷
IALD 3.20×100 7.92×100 1.20×10⁻⁸
4.98×10⁻⁶
INPN 1.27×100 2.12×100 7.68×10⁻⁸
5.67×10⁻⁷
ISNP 1.12×100 2.09×10⁻²
1.14×10⁻¹⁸
2.96×10⁻²⁰
NITP 4.38×10⁻¹ 4.79×10⁻³ 6.95×10⁻⁷ 2.03×10⁻⁶
PINT 9.46×10⁻¹
1.51×10⁻¹
5.28×10⁻¹⁵
4.58×10⁻¹⁴
α−pinene 9.45×10⁶ 1.46×10⁹
Isoprene 2.23×10¹⁰ 4.70×10¹¹
Limonene 4.81×10⁶ 6.13×10⁸
Toluene 2.23×10¹⁰ 3.75×10⁹
Xylene 4.79×10⁹ 3.28×10⁹
ACPD
7, 8361–8393, 2007Development of a SOA formation
mechanism
L. E. Olcese et al.
Title Page
Abstract Introduction
Conclusions References
Tables Figures
◭ ◮
◭ ◮
Back Close
Full Screen / Esc
Printer-friendly Version
Interactive Discussion
EGU
0 200 400 600 800 1000
0 200 400 600 800 1000
S
im
u
la
te
d
S
O
A
[
µ
g
m
-3 ]
Measured SOA [µg m-3]
Fig. 1. Plot of simulated vs. measured SOA concentrations for several smog chamber
ACPD
7, 8361–8393, 2007Development of a SOA formation
mechanism
L. E. Olcese et al.
Title Page
Abstract Introduction
Conclusions References
Tables Figures
◭ ◮
◭ ◮
Back Close
Full Screen / Esc
Printer-friendly Version
Interactive Discussion
EGU
0 2 4 6 8 10
0 2 4 6 8 10
S
im
u
la
te
d
O
A
[
µ
g
m
-3 ]
Measured OA [µg m-3]
ACPD
7, 8361–8393, 2007Development of a SOA formation
mechanism
L. E. Olcese et al.
Title Page
Abstract Introduction
Conclusions References
Tables Figures
◭ ◮
◭ ◮
Back Close
Full Screen / Esc
Printer-friendly Version
Interactive Discussion
EGU
ACHO A-DI NITP PINT ISNP INPN IALD
0.0 0.1 0.2 0.3 0.4 0.5 0.6 0.7 0.8
biogenic compounds anthropogenic compounds
Products derived from Products derived from
M
a
s
s
f
ra
c
ti
o
n
i
n
t
h
e
S
O
A
SOA component
Rural site
Urban-influenced site
ACPD
7, 8361–8393, 2007Development of a SOA formation
mechanism
L. E. Olcese et al.
Title Page
Abstract Introduction
Conclusions References
Tables Figures
◭ ◮
◭ ◮
Back Close
Full Screen / Esc
Printer-friendly Version
Interactive Discussion
EGU
0 10 20 30 40 50
0 1 2 3 4 5 6 7 8
Model
De Gouw calculation
O
rg
a
n
ic
c
a
rb
o
n
[
µ
g
C
m
-3 ]
Photochemical age [h]
Fig. 4. Evolution of the organic carbon in the SOA phase concentration under the conditions