Submitted26 November 2015
Accepted 6 April 2016
Published26 April 2016
Corresponding author
Jessica A. Schultz,
jessica.schultz@vanaqua.org
Academic editor
Richard Taylor
Additional Information and Declarations can be found on page 15
DOI10.7717/peerj.1980
Copyright
2016 Schultz et al.
Distributed under
Creative Commons CC-BY 4.0
OPEN ACCESS
Evidence for a trophic cascade on rocky
reefs following sea star mass mortality in
British Columbia
Jessica A. Schultz1,2, Ryan N. Cloutier3and Isabelle M. Côté1
1Earth to Ocean Group, Department of Biological Sciences, Simon Fraser University, Burnaby,
British Columbia, Canada
2Coastal Ocean Research Institute, Vancouver Aquarium Marine Science Centre, Vancouver,
British Columbia, Canada
3Stantec Consulting Ltd., Burnaby, British Columbia, Canada
ABSTRACT
Echinoderm population collapses, driven by disease outbreaks and climatic events, may be important drivers of population dynamics, ecological shifts and biodiversity. The northeast Pacific recently experienced a mass mortality of sea stars. In Howe Sound, British Columbia, the sunflower starPycnopodia helianthoides—a previously abundant predator of bottom-dwelling invertebrates—began to show signs of a wasting syndrome in early September 2013, and dense aggregations disappeared from many sites in a matter of weeks. Here, we assess changes in subtidal community composition by comparing the abundance of fish, invertebrates and macroalgae at 20 sites in Howe Sound before and after the 2013 sea star mortality to evaluate evidence for a trophic cascade. We observed changes in the abundance of several species after the sea star mortality, most notably a four-fold increase in the number of green sea urchins,Strongylocentrotus droebachiensis, and a significant decline in kelp cover, which are together consistent with a trophic cascade. Qualitative data on the abundance of sunflower stars and green urchins from a citizen science database show that the patterns of echinoderm abundance detected at our study sites reflected wider local trends. The trophic cascade evident at the scale of Howe Sound was observed at half of the study sites. It remains unclear whether the urchin response was triggered directly, via a reduction in urchin mortality, or indirectly, via a shift in urchin distribution into areas previously occupied by the predatory sea stars. Understanding the ecological implications of sudden and extreme population declines may further elucidate the role of echinoderms in temperate seas, and provide insight into the resilience of marine ecosystems to biological disturbances.
SubjectsBiodiversity, Ecology, Marine Biology, Zoology
Keywords Marine diseases, Starfish, Community shifts, Mass mortality, Environmental change, Sea star wasting syndrome, Echinoderm population
INTRODUCTION
1984). The event impacted an estimated 3.5 million km2of the Caribbean region, causing up to 99% urchin mortality at some sites (Lessios, 1988). While the precipitous decline
of Diademawas a unique occurrence, other echinoderm mass mortality events occur
repeatedly. On the Atlantic coast of North America, an amoeboid parasite causes episodic mortality events in green sea urchins,Strongylocentrotus droebachiensis(Jones & Scheibling, 1985), which are linked to hurricanes and are predicted to increase in frequency with climate change (Scheibling & Lauzon-Guay, 2010). Similarly, recurring events of wasting disease involving asteroids (sea stars), echinoids (sea urchins) and holothurians (sea cucumbers) in the Channel Islands, California, are associated with climate regime shifts and extreme weather events (Engle, 1994;Eckert, Engle & Kushner, 2000).
Because sea stars and sea urchins play key ecological roles in many marine ecosystems, echinoderm population collapses can be important drivers of biodiversity, population dynamics and ecological shifts. In fact, the term ‘keystone predator’ was originally coined for the purple star,Pisaster ochraceus, after experiments showed that its absence led to significant decreases in intertidal biodiversity (Paine, 1966). Many other echinoderm species have since been shown to influence community composition through predation or herbivory. These effects are apparent on coral reefs following echinoderm population booms (e.g., coral cover declines owing to eruptive crown-of-thorns star,Acanthaster planciSano et al., 1984) or busts (e.g., the transition from coral- to algae-dominated reefs following theD. antillarummortality eventCarpenter, 1990). On temperate rocky reefs, fluctuations in the abundance of herbivorous urchins can also result in major community shifts, from kelp forests to urchin barrens and back again (Estes & Duggins, 1995;Steneck et al., 2003).
The northeast Pacific region has recently experienced a protracted mass mortality of sea stars that might rival the magnitude of theDiademadie-off of the 1980s (Johnson, 2016). The event was first noticed on the Olympic coast of Washington in June 2013 (Hewson et al., 2014). In affected sea stars, the signs progress from a loss of turgor pressure, to lesions and ruptures of the body wall and autotomization of arms, and ultimately, disintegration and death (Fig. 1). The wasting syndrome has continued through 2014 and 2015, and has so far affected some 20 species from Alaska to Southern California (Stockstad, 2014). A virus may be involved (Hewson et al., 2014), but the precise causes and contributing factors remain poorly understood. Moreover, little is known so far of the extent and ecological consequences of this sea star mortality event at any location.
Many of the affected sea stars were predatory species, raising the possibility of trophic cascades associated with their disappearance and marked community restructuring. In Howe Sound, southern Strait of Georgia, British Columbia, the sunflower starPycnopodia
helianthoidesshowed signs of advanced wasting in early September 2013. Dense aggregations
conspicuous impact on the abundance of kelp, sunflower stars can influence the formation and persistence of urchin barrens, i.e., areas devoid of kelp because of the grazing activity of urchins (Duggins, 1981). Indeed, most well-substantiated examples of tri-trophic cascades in rocky subtidal ecosystems involve urchins as prey and major herbivore (Pinnegar et al., 2000). We therefore expected thatPycnopodiaprey, in particular urchins, would increase in abundance following the disappearance of their major predator, leading to reductions in kelp cover.
Here, we evaluate the extent of mortality ofP. helianthoidesin Howe Sound and test whether changes in the benthic community following the rapid decline of this predatory sea star are consistent with the hypothesis of a trophic cascade. We compare rocky reef community composition before and after the mass mortality using quantitative data derived from subtidal transects and qualitative information gathered by citizen scientists. In doing so, we provide empirical evidence that a trophic cascade quickly followed what might be one of the largest wildlife die-off events ever recorded (Johnson, 2016).
MATERIALS AND METHODS
Subtidal surveys
We compared sunflower star abundance and benthic community composition before (2009/2010) and after (2014) the 2013 wasting event using scuba-based surveys of 20 sites in Howe Sound, British Columbia (BC), Canada (Fig. 2). Surveys before the wasting event were conducted as part of a study of rockfish (Sebastesspp) habitat (Cloutier, 2011). We repeated these surveys after the wasting event using the same method, at the same GPS locations, depths (within 2 m) and time of year (within 14 days). Ten sites were surveyed in early summer (June–July) and 10 sites in late summer (August–October). In all surveys, we recorded the abundance of 18 taxa (species or species groups) of common benthic fishes and invertebrates (Table 1).
At each site we surveyed four transects (25 m long by 4 m wide) at depths between 8 and 15 m (chart datum). We quantified fish and invertebrate abundance by counting all individuals of the target taxa occurring fully or partly within 0.25 m2quadrats placed at 15 random positions along each transect. We also estimated visually the percent cover of kelp (mainly the generaAgarum,Costaria,LaminariaandSaccharina) within the same quadrats.
Citizen-contributed (REEF) surveys
Figure 2 Rocky reef survey sites in Howe Sound, British Columbia.Benthic community composition was assessed at each of the 20 sites once in 2009 or 2010 and again in 2014. A mass mortality of sea stars occurred in the summer and fall of 2013 in this area. A site-level trophic cascade following the mortality was detectable at some sites (solid circles) but not others (open circles). (Map data c2015 WorldMap).
Table 1 Taxa recorded during subtidal surveys in Howe Sound, British Columbia.Mean density and standard deviation per 15 m2are given for
each taxon as recorded before and after the sea star mortality event.
Taxon Species or genera included in taxon Mean density (SD)
Before After
Invertebrates
Sunflower star Pycnopodia helianthoidesBrandt, 1835 6.4 (11.4) 0.9 (3.3) Green urchin Strongylocentrotus droebachiensisO. F. Müller, 1776 18.3 (41.0) 77.2 (157.4) Red urchin Strongylocentrotus franciscanusAggasiz, 1863 0.4 (0.9) 0.3 (0.6) White urchin Strongylocentrotus pallidusG. O. Sars, 1871 1.1 (2.0) 0.3 (0.4) California cucumber Parastichopus californicusLinnaeus, 1758 6.1 (9.0) 13.1 (8.9) Dungeness crab Metacarcinus magisterDana, 1852 0.1 (0.2) 0.0 Red rock crab Cancer productusRandall, 1839 0.1 (0.3) 0.4 (0.7) Spot prawn Pandalus platycerosBrandt, 1851 22.1 (89.1) 0.3 (0.8) Squat lobster Munida quadrispinaBenedict, 1902 4.0 (9.0) 0.3 (0.6) Miscellaneous crabs Primarily anomurans, including lithode and hermit crabs; several brachyuran
genera includingCancer, Pugettia, Scyra, andOregonia
21.7 (35.0) 16.3 (23.5)
Miscellaneous shrimps PrimarilyPandalus danaeStimpson, 1857, but also other members of the genus Pandalus, as well as the generaLebbeus, Eualus, Heptocarpusand possibly others
37.0 (38.6) 15.8 (11.2)
Giant Pacific octopus Enteroctopus dofleiniWülker, 1910 0.1 (0.2) 0.0 Cup corals Balanophyllia elegansVerrill, 1864,Caryophyllia alaskensisVaughan, 1941 6.7 (15.8) 22.1 (19.0)
Benthic fishes
Grunt sculpin Rhamphocottus richardsoniiGünther, 1974 0.1 (0.2) 0.1 (0.2) Longfin sculpin Jordania zonopeStarks, 1895 0.2 (0.4) 2.7 (4.1) Sailfin sculpin Nautichthys oculofasciatusGirard, 1858 0.1 (0.2) 0.0 Scalyhead sculpin Artedius harringtoniStarks, 1896 0.8 (1.6) 1.8 (2.3) Miscellaneous sculpins Cottid genera includingArtedius, Orthanopias, Oligocottus, Radulinus, Chitonotus
and possibly others.
5.5 (4.6) 0.7 (1.2)
Data analyses
We used linear mixed-effects models in the R statistical platform (nlme package;Pinheiro et al., 2015) to compare sunflower star abundance, green urchin abundance and kelp cover before and after the sea star mortality. We obtained sunflower and green urchin abundance for each transect by summing the number of sunflower stars and, separately, green urchins across all quadrats and log-transforming the values prior to analysis. Kelp cover was averaged across all quadrats within each transect. In all cases, we included ‘site’ as a random effect, and verified the assumptions of normally distributed residuals, homoscedasticity and the absence of leverage by visually examining quantile, residual vs. fitted and Cook’s distance diagnostic plots, respectively.
To compare overall benthic community composition before and after the sea star mortality, we ran a permutation-based, non-parametric analysis of similarity (ANOSIM;
Clarke, 1993) using PRIMER (v. 1.0.3;Clarke & Gorley, 2006). Abundance matrices (species by site) were compiled for each period (i.e., pre- and post-mortality), in which abundance was estimated as the total count of each taxon across transects and/or quadrats at each site. The raw data were square-root-transformed to reduce the influence of very abundant or very rare species. Bray-Curtis similarity coefficients were computed between pairs of sites (Clarke & Warwick, 2001). The ANOSIM procedure was carried out on the similarity matrix. ANOSIM generates an R statistic, which varies between 0 (samples are as similar across groups as they are within group) and 1 (all samples within groups are more similar to each other than to any sample across groups) and is tested for difference from zero with a permutation test (in this study, N=999 permutations). The differences in benthic assemblages were visualized in a non-metric, multidimensional scaling (MDS) plot in which samples that are more similar in community composition appear closer together than more dissimilar samples. Stress values of <0.1 suggest that distances among samples in an MDS plot accurately reflect the extent of community differences (Clarke & Warwick, 2001). Finally, we conducted an analysis of similarity percentages (SIMPER) to identify the main taxa responsible for any differences observed between pre- and post-mortality assemblages. We considered a taxon to be important to community differences if its individual contribution was 11% or more, which is twice the expected value if dissimilarity contributions were evenly distributed among all taxa in the analysis (i.e.,100 percent divided by 18 taxa, multiplied by 2). The SIMPER analysis also includes an indication of evenness, expressed as a consistency ratio (CR). CR is the average dissimilarity contribution of a taxon divided by the standard deviation in dissimilarity values of that taxon, for each time period. CR values greater than one suggest that the taxon contributed to dissimilarity between time periods equally across all sites (Terlizzi et al., 2005).
RESULTS
Sea star mortality
At our monitored sites, the abundance of sunflower stars declined by 89% ±29% (mean±SD), from an average of 0.42 (±0.76) sunflower stars per m2before the mortality event to 0.06 (±0.22) individuals per m2 after it (LME: t=4.62, df=139,p<0.0001;
Fig. 3). Three sites had no sunflower stars in 2009/2010, and were not included in the percent decline calculation. All 17 sites with sunflower stars in 2009/2010 had fewer sunflower stars in 2014.
Figure 3 Mortality of sea stars, and subsequent change in urchin abundance and kelp cover after sea star mortality.Mean abundance (per m2) of (A) sunflower stars and (B) green sea urchins, and
Table 2 Differences in pre- and post-mortality benthic assemblages.The four taxa that contributed disproportionately to dissimilarity in benthic community composition on rocky reefs before and after the 2013 sea star mass mortality, as well as the focal sea star,Pycnopodia helianthoides. Mean densities (# per 30 m2±1 SD), consistency ratios, and individual and cumulative contributions (in %) to differences between years are shown. The
consistency ratio is calculated as a species’ average dissimilarity contribution divided by the standard deviation of dissimilarity values. A consistency ratio > 1 indicates an even contribution to community dissimilarity across sites. The analysis was conducted on square-root-transformed data (see Methods) but untransformed densities are presented here.
Taxon Mean density (SD) Consistency
ratio
Individual contribution
Cumulative contribution
Before After (%) (%)
Strongylocentrotus droebachiensis 18.3 (41.0) 77.2 (157.5) 1.09 18.91 18.91
Cup corals 6.7 (15.8) 22.2 (19.1) 1.41 13.04 31.95
Misc. shrimps 37.0 (38.7) 15.9 (11.2) 1.3 11.29 43.23
Misc. crabs 21.7 (35.0) 16.3 (23.5) 1.05 11.15 54.38
Pycnopodia helianthoides 6.4 (11.4) 0.9 (3.3) 1.18 7.15 69.05
first observed in Howe Sound (at Whytecliff Park; 49◦22′18.4′′N, 123◦17′33.8′′W) on 2 September, 2013, and we then noted it at all of our study sites the following month.
Benthic community composition
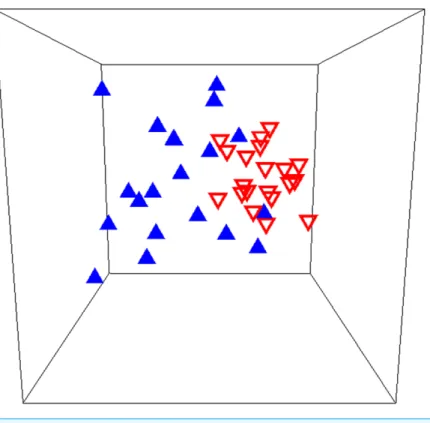
There was a significant shift in overall community composition following sea star mortality in Howe Sound (ANOSIM: R =0.326,p=0.001; Fig. 5), and many species changed
in abundance from one period to the next (Table 1). The community shift was largely driven by an increase in abundance of green urchins (Table 2). Green urchin abundance quadrupled after the near-disappearance of sunflower stars (LME:t= −3.10, df=139, p=0.0023;Fig. 3). This trend is supported by the REEF surveys, although these qualitative
data suggest that green urchin numbers began increasing in the first week of September, two to three weeks before the detectable onset of sea star decline (Fig. 4). There was also an increase in the abundance of cup corals, while the numbers of small shrimps and crabs decreased (Table 2). Cumulatively, these four taxa accounted for nearly two-thirds (62%) of the dissimilarity in benthic community composition before and after the sea star mortality, and their contributions were consistent across sites (CRs > 1; Table 2). Despite their marked decline, sunflower stars did not contribute disproportionately to the dissimilarity between time periods (SIMPER; individual contribution to dissimilarity
= 7.15%). Overall, within-year similarity was higher after than before sea stars died (SIMPER; average inter-site similarity before=46.28%, after=58.11%;Fig. 5), suggesting that communities became more homogeneous following the sea star mortality.
In addition to shifts in benthic animal community composition, there was also a change in the abundance of kelp. Kelp cover decreased from 4% (±10%) in 2009/2010 to <1% (±2%) in 2014 (LME:t=2.669, df=139,p=0.0085;Fig. 3). In all years, the kelp at our
sites was almost exclusively the sea colander kelp,Agarum fimbriatum, but also included
Saccharina latissima.
Figure 4 Sunflower star and green sea urchin abundance trajectories.Sixty-day running average abundance scores for green sea urchins (Strongylocentrotus droebachiensis; green solid line) and sunflower stars (Pycnopodia helianthoides; purple dashed line) recorded in REEF surveys from January 2010 to November 2014 in Washington and British Columbia (n = 1568 surveys). Grey bands indicate 95% confidence intervals of the running average. The vertical red dotted line indicates the date of the first recorded observation of sea star wasting syndrome (7 June 2013), which was on the Olympic coast of WA.
P. helianthoidesbefore the sea star mortality showed increases in green urchin abundance
concomitant with declines in sea star abundance (Fig. 6). Eight of these 17 sites showed declines in kelp cover concomitant with increases in green urchin abundance (Fig. 6). A clear alternation of population trajectories from predators to herbivores to kelp was clear at eight of the 16 sites (Fig. 6).
DISCUSSION
The wasting disease that affected echinoderms in the northeast Pacific in 2013/2014 heavily impacted populations of sunflower stars, the sea stars that formerly dominated subtidal communities. We found a noticeable shift in benthic community structure following the sea star decline. Community changes were largely driven by changes in the abundance of green sea urchins, cup corals, shrimps and crabs. The temporal coincidence of the alternating trajectories of abundance of sea stars, urchins and kelp, as well as the overlapping distributions and documented trophic linkages among these three taxa, meet the diagnostic criteria of a tri-trophic cascade (Grubs et al., 2016), triggered by the mass mortality of predatory sunflower stars.
Sunflower star densities declined by almost 90%, on average, at our sites in Howe Sound, BC. Such a decline in sea stars rivals the largest magnitudes reported for disease-induced echinoderm mass mortalities (e.g., 70% ofStrongylocentrotus droebachiensisin Nova Scotia
Scheibling & Stephenson, 1984; 95% ofS. franciscanusin CaliforniaPearse et al., 1977; 97%
Figure 5 Rocky reef species assemblages before and after sea star mortality.Multidimensional scaling plot of benthic community composition on rocky reefs before (blue triangles) and after (inverted red triangles) the 2013 sea star mass mortality event in Howe Sound, British Columbia. The analysis included 18 fish and invertebrate taxa at 20 sites, surveyed both in 2009/2010 and 2014. The associated stress value (0.13) suggests some distortion in the multivariate representation of the data.
ofP. helianthoidesmust be even greater than the change in relative abundance because the
sea stars we observed following the mortality event were almost exclusively juveniles (<6 cm diameter). The very large individuals (>50 cm diameter) present before the mortality event likely played a larger role in structuring benthic communities than the juveniles present after the event. The steep decline in sunflower star numbers, occurring some 15 weeks after the first official sighting of sea star wasting, was clearly evident in the qualitative density scores generated by citizen science (REEF) surveys, which covered a broader geographic area. The time-series of REEF data suggests that sunflower star population levels were somewhat variable, perhaps reflecting variation in the sites surveyed by divers, but largely stable between the first snapshot in 2009/2010 and the onset of the wasting event in 2013. More generally, the benthic species composition of the Strait of Georgia region has remained remarkably stable in recent decades, even in the face of climate regime shifts (Marliave et al., 2011). It therefore seems unlikely that the sea star population declines, and concomitant changes in benthic community composition, could be ascribed to a different, unreported disturbance occurring prior to 2013.
Figure 6 Relative difference in abundance of sea stars, urchins and kelp by site.The relative difference in total count of sunflower stars (blue triangles) and green urchins (green circles), and the relative difference in the mean percent cover of algae (red squares) before and after the sea star mass mortality. Open symbols indicate sites where population density was zero both before and after the mass mortality. Relative difference was calculated as the change in abundance divided by the mean abundance of both time periods. A relative difference of−2 indicates the population declined to zero. Sites are numbered chronologically according to the order in which they were surveyed, from June to August, 2014. The geographic location of these sites is shown inFig. 2.
perhaps unlikely. Green urchins of this size on the east coast of North America are at least three years of age, and possibly more than a decade old (Russel, Ebert & Petraitis, 1998;
Vadas et al., 2000). If these growth rates are similar on the Pacific coast, then most of the urchins we saw could have settled several years before the sea star mortality event. However, urchin growth rates can be highly variable (Vadas et al., 2000), depending on food supply and temperature (Thompson, 1983;Meidel & Scheibling, 1999;Pearce et al., 2005), Urchin growth rates have not yet been estimated in BC. A third possible explanation is that the observed increase in urchin abundance resulted from a shift in urchin behaviour following the sea star mortality event. The impact of ‘intimidation’ on predator–prey interactions can be as important as direct consumption (Lima & Dill, 1990;Preisser, Bolnick & Benard, 2005). Under risk of predation, prey individuals alter a suite of behaviours, including habitat choice, foraging range, and time under cover (Werner et al., 1983;Peacor & Werner, 2001;Trussell, Ewanchuk & Bertness, 2003;Schmitz, Krivan & Ovadia, 2004). The effect of sunflower stars on urchin behaviour is well documented. In field experiments in Alaska, both green and purple (S. purpuratus) urchins moved away afterP. helianthoidesarms were placed in the centre of urchin aggregations (Duggins, 1981), and urchin distribution shifted rapidly when sea star abundance was experimentally increased (Duggins, 1983). Fear-released urchins could therefore respond by moving from refuges, perhaps in very shallow or deep habitats or in sheltered crevices inaccessible to sea stars (and divers), to more open substrates, making them easier to see and count.
The data from REEF surveys support a behavioural rather than a consumptive mechanism for the increase in urchin numbers. Whereas one would expect a delayed increase in urchin numbers following a release from predation (Wangersky & Cunningham, 1957), green urchin numbers began to increase at approximately the same time as the decline in sunflower stars was evident (Fig. 4). The observed change in green urchin abundance may therefore be due, at least in part, to green urchins modifying their distribution in response to the decline of sunflower stars.
Another conspicuous change we observed was a∼80% reduction in kelp cover (Fig. 3), pointing to a potential trophic cascade triggered by the sea star mortality event. There are many documented examples of urchin abundance directly influencing the abundance of algae (e.g.,Fletcher, 1987;Carpenter, 1990;Estes & Duggins, 1995;McClanahan et al., 1996;
that the presence of juvenile sea stars (i.e., site 20 onFig. 6) resulted in different trophic interactions.
In contrast to green urchins, the abundance of many prey species did not increase in the near-absence of sunflower star predators. For example, there was no change in the abundance of red urchins (S. franciscanus) and white urchins (S. pallidus). Neither species is common in Howe Sound, and little is known about the ecology ofS. pallidus. However,
S. franciscanusmay generally be less susceptible to sea star predation than other urchin
species because they grow too large to be consumed (Duggins, 1981). Moreover, although crustaceans constitute a significant portion of the diet of sunflower stars (Shivji et al., 1983;
Estes & Duggins, 1995;Lambert, 2000), shrimps and crabs declined following the sea star mortality. Several of the crustaceans we monitored use kelp for both food and habitat. The spot prawn,Pandalus platyceros, for instance, specifically uses sea colander kelp as nursery habitat (Marliave & Roth, 1995). The decline of some crustacean taxa could result from the reduced kelp cover and therefore be a fourth step in the cascade documented here. Another fourth link in the ecological cascade triggered by sea star mortality might involve cup corals. Their increase in abundance was surprising as cnidarians are not normally consumed by P. helianthoides(Shivji et al., 1983;Herrlinger, 1983). However, cup corals are known to fare poorly in areas dominated by macroalgae (Fadlallah, 1983). Contact with algae causes coral polyp retraction, which in turn allows overgrowth by filamentous and coralline algae (Coyer et al., 1993). Increases in density of cup corals can be swift (<1 year), and of the magnitude observed here (3–4 times), after algae disappear (Coyer et al., 1993). Of course, the reduced abundance of kelp and of sea stars may also have allowed for a less obstructed view of the substrate by the observers. As a number of taxa were not monitored in this study, there were likely other changes following the sea star mortality event that we did not detect.
In conclusion, our study contributes to understanding the ecological consequences of the northeast Pacific sea star mass mortality. The most notable change was a marked increase in the number of green sea urchins, which might have already had trickle-down effects on other levels of the ecosystem by the time we detected it. It is unclear whether the changes observed will persist as long-term consequences of the near-disappearance of sea stars. Nonetheless, further monitoring will help elucidate the resilience of this ecosystem in the face of acute biological disturbances. Although such a sudden and drastic decline in sea star populations is alarming, it provides a large-scale natural experiment that may advance our understanding of subtidal trophic cascades and invertebrate population dynamics.
ACKNOWLEDGEMENTS
ADDITIONAL INFORMATION AND DECLARATIONS
Funding
Jessica Schultz received funding through the Vancouver Aquarium Howe Sound Research Program. Ryan N. Cloutier received funding through the Canadian Healthy Oceans Network. Isabelle M. Côté received funding through a Discovery grant of the Natural Sciences and Engineering Research Council of Canada. The funders had no role in study design, data collection and analysis, decision to publish, or preparation of the manuscript.
Grant Disclosures
The following grant information was disclosed by the authors: Vancouver Aquarium Howe Sound Research Program. Canadian Healthy Oceans Network.
Discovery grant of the Natural Sciences and Engineering Research Council of Canada.
Competing Interests
The authors declare there are no competing interests.
Author Contributions
• Jessica A. Schultz conceived and designed the experiments, performed the experiments, analyzed the data, wrote the paper, prepared figures and/or tables, reviewed drafts of the paper.
• Ryan N. Cloutier performed the experiments, wrote the paper, reviewed drafts of the paper.
• Isabelle M. Côté conceived and designed the experiments, wrote the paper, reviewed drafts of the paper.
Data Availability
The following information was supplied regarding data availability:
The raw data has been supplied as Data S1and the code has been supplied as a
Supplemental Information 1.
Supplemental Information
Supplemental information for this article can be found online athttp://dx.doi.org/10.7717/ peerj.1980#supplemental-information.
REFERENCES
Carpenter RC. 1990.Mass mortality ofDiadema antillarum.Marine Biology104:67–77
DOI 10.1007/BF01313159.
Clarke KR. 1993.Non-parametric multivariate analyses of changes in community
structure.Austral Ecology18:117–143.
Clarke KR, Gorley RN. 2006.PRIMER version 6: user manual/tutorial. Plymouth:
Clarke KR, Warwick RM. 2001.PRIMER version 5: user manual/tutorial. Plymouth: Primer-E Limited.
Cloutier RN. 2011.Direct and indirect effects of marine protection: Rockfish
Conserva-tion Areas as a case study. MSc Thesis, Simon Fraser University.
Coyer JA, Ambrose RF, Engle JM, Carroll JC. 1993.Interactions between corals and
al-gae on a temperate zone rocky reef: mediation by sea urchins.Journal of Experimental
Marine Biology and Ecology167(1):21–37DOI 10.1016/0022-0981(93)90181-M.
Duggins DO. 1981.Interspecific facilitation in a guild of benthic marine herbivores.
Oecologia48:157–163DOI 10.1007/BF00347958.
Duggins DO. 1983.Starfish predation and the creation of mosaic patterns in a
kelp-dominated community.Ecology64:1610–1619DOI 10.2307/1937514.
Eckert GL, Engle JM, Kushner DJ. 2000.Sea star disease and population declines at the
Channel Islands. In:Proceedings of the fifth California Islands symposium, 390–393.
Engle JM. 1994.Perspectives on the structure and dynamics of nearshore marine
assemblages of the California Channel Islands. In:Proceedings of the fourth California Islands symposium: update on the status of resources, 13–26.
Estes JA, Duggins DO. 1995.Sea otters and kelp forests in Alaska: generality and
variation in a community ecological paradigm.Ecological Monographs65(1):75–100
DOI 10.2307/2937159.
Fadlallah YH. 1983.Population dynamics and life history of a solitary coral,
Balanophyllia elegans, from central California.Oecologia58(2):200–207
DOI 10.1007/BF00399217.
Fletcher WJ. 1987.Interactions among subtidal Australian sea urchins, gastropods
and algae: effects of experimental removals.Ecological Monographs57(1):89–109
DOI 10.2307/1942640.
Grubs RD, Carlson JK, Romine JG, Curtis TH, McElroy WD, McCandless CT, Cotton
CF, Musick JA. 2016.Critical assessment and ramifications of a purported marine
trophic cascade.Scientific Reports6:20970DOI 10.1038/srep20970.
Hart MW, Scheibling RE. 1988.Heat waves, baby booms, and the destruction of kelp
beds by sea urchins.Marine Biology99:167–176DOI 10.1007/BF00391978.
Herrlinger TJ. 1983.The diet and predator–prey relationships of the sea starPycnopodia
helianthoides(Brandt) from a central California kelp forest. M.A. Thesis, San Jose
State University, California.
Hewson I, Button JB, Gudenkauf BM, Miner B, Newton AL, Gaydos JK, Wynne J, Groves CL, Hendler G, Murray M, Fradkin S, Breitbart M, Fahsbender E, Lafferty KD, Kilpatrick AM, Miner CM, Raimondi P, Lahner L, Friedman CS, Daniels S,
Haulena M, Marliave J, Burge CA, Eisenlord ME, Harvell CD. 2014.Densovirus
associated with sea-star wasting disease and mass mortality.Proceedings of the
National Academy of Sciences of the United States of America111:17278–17283
DOI 10.1073/pnas.1416625111.
Johnson L. 2016.Sea star wasting disease among worst wildlife die-offs say scientists.
CBC News.Available athttp:// www.cbc.ca/ news/ canada/ british-columbia/
Lambert P. 2000.Sea stars of British Columbia, Southeast Alaska, and Puget Sound. Vancouver: Royal British Columbia Museum, UBC Press.
Lessios HA. 1988.Mass mortality ofDiadema antillarumin the Caribbean: what have we
learned?Annual Review of Ecology and Systematics19:371–393
DOI 10.1146/annurev.es.19.110188.002103.
Lessios HA, Robertson DR, Cubit JD. 1984.Spread ofDiademamass mortality through
the Caribbean.Science226:335–337.
Lima SL, Dill LM. 1990.Behavioral decisions made under the risk of predation: a review
and prospectus.Canadian Journal of Zoology68:619–640DOI 10.1139/z90-092.
Marliave JB, Gibbs CJ, Gibbs DM, Lamb AO, Young SJF. 2011. Biodiversity stability
of shallow marine benthos in Strait of Georgia, British Columbia, Canada through climate regimes, overfishing and ocean acidification. In: Grillo O, Verona G, eds.
Biodiversity loss in a changing planet. Rijeka: InTech, 49–74.
Marliave JB, Roth M. 1995.Agarum kelp beds as nursery habitat of spot prawns,
Pandalus platycerosBrandt, 1851 (Decapoda, Caridea).Crustaceana68:27–37
DOI 10.1163/156854095X01132.
McClanahan TR, Kamukuru AT, Muthiga NA, Gilagabher Yebio M, Obura D. 1996.
Effect of sea urchin reductions on algae, coral and fish populations.Conservation
Biology10(1):136–154DOI 10.1046/j.1523-1739.1996.10010136.x.
Meidel SK, Scheibling RE. 1999.Effects of food type and ration on reproductive
maturation and growth of the sea urchinStrongylocentrotus droebachiensis.Marine
Biology134:155–166DOI 10.1007/s002270050534.
Paine RT. 1966.Food web complexity and species diversity.The American Naturalist
100:65–75DOI 10.1086/282400.
Palacin C, Giribet G, Carner S, Dantart L, Turon X. 1998.Low densities of sea urchins
influence the structure of algal assemblages in the western Mediterranean.Journal of
Sea Research39:281–290DOI 10.1016/S1385-1101(97)00061-0.
Peacor SD, Werner EE. 2001.The contribution of trait-mediated indirect effects to the
net effects of a predator.Proceedings of the National Academy of Sciences of Sciences of
the United States of America98:3904–3908DOI 10.1073/pnas.071061998.
Pearce CM, Williams SW, Yuan F, Castell JD, Robinson SMC. 2005.Effect of
temper-ature on somatic growth and survivorship of early post-settled green sea urchins,
Strongylocentrotus droebachiensis(Müller).Aquaculture Research36:600–609
DOI 10.1111/j.1365-2109.2005.01264.x.
Pearse JS, Costa DP, Yellin MB, Agegian CR. 1977.Localized mass mortality of red sea
urchin,Strongylocentrotus franciscanusnear Santa Cruz, California.Fishery Bulletin
75(3):645–648.
Pinheiro J, Bates D, DebRoy S, Sarkar D, R Core Development Team. 2015.nlme:
Linear and Nonlinear Mixed Effects Models. R-project. org/package=nlme. R package
version.
Pinnegar JK, Polunin NVC, Francour P, Badalamenti F, Chemello R, Harmelin-Vivien
in benthic marine ecosystems: lessons for fisheries and protected-area management.
Environmental Conservation27(2):179–200DOI 10.1017/S0376892900000205.
Preisser E, Bolnick D, Benard M. 2005.The high cost of fear: behavioral effects dominate
predator–prey interactions.Ecology 86:501–509DOI 10.1890/04-0719.
REEF. 2014.Reef environmental education foundation. World Wide Web electronic
publication.Available atwww.reef.org(accessed 19 November 2014).
Russel MP, Ebert TA, Petraitis PS. 1998.Field estimates of growth and mortality
of the green sea urchin,Strongylocentrotus droebachiensis.Ophelia48:137–153
DOI 10.1080/00785236.1998.10428681.
Scheibling RE, Hennigar AW, Balch T. 1999.Destructive grazing, epiphytism, and
disease: the dynamics of sea urchin-kelp interactions in Nova Scotia.Canadian
Journal of Fisheries and Aquatic Sciences56:2300–2314DOI 10.1139/f99-163.
Scheibling RE, Lauzon-Guay J-S. 2010.Killer storms: North Atlantic hurricanes and
disease outbreaks in sea urchins.Limnology and Oceanography55:2331–2338.
Scheibling RE, Stephenson RL. 1984.Mass mortality ofStrongylocentrotus droebachiensis
(Echinodermata: Echinoidea) off Nova Scotia, Canada.Marine Biology 78:153–164
DOI 10.1007/BF00394695.
Schmitz OJ, Krivan V, Ovadia O. 2004.Trophic cascades: the primacy of trait-mediated
indirect interactions.Ecology Letters7:153–163
DOI 10.1111/j.1461-0248.2003.00560.x.
Shivji M, Parker D, Hartwick B, Smith MJ, Sloan NA. 1983.Feeding and distribution
study of the sunflower sea starPycnopodia helianthoides(Brandt, 1835).Pacific
Science37:133–140.
Steneck RS, Graham MH, Bourque BJ, Corbett D, Erlandson JM, Estes JA. 2003.
Kelp forest ecosystems: biodiversity, stability, resilience and future.Environmental
Conservation29(4):436–459.
Stockstad E. 2014.Death of the stars.Science (New York)344:464–467
DOI 10.1126/science.344.6183.464.
Thompson RJ. 1983.The relationship between food ration and reproductive effort
in the green sea urchin,Strongylocentrotus droebachiensis.Oecologia56:50–57
DOI 10.1007/BF00378216.
Terlizzi A, Benedetti-Cecchi L, Bevilacqua S, Fraschetti S, Guidetti P, Anderson MJ.
2005.Multivariate and univariate asymmetrical analyses in environmental impact
assessment: a case study of Mediterranean subtidal sessile assemblages.Marine Ecology Progress Series289:27–42.
Trussell GC, Ewanchuk PJ, Bertness MD. 2003.Trait-mediated effects in rocky intertidal
food chains: predator risk cues alter prey feeding rates.Ecology 96:2049–2055.
Uthicke S, Schaffelke B, Byrne M. 2009.A boom-bust phylum? Ecological and
evolu-tionary consequences of density variations in Echinoderms.Ecological Monographs 79:3–24.
Vadas Sr RL, Beal B, Dowling T, Fegley JC. 2000.Experimental field tests of natural
droebachiensis: a case for rapid summer production in post-spawned animals.
Aquaculture182:115–135DOI 10.1016/S0044-8486(99)00254-9.
Villouta E, Chadderton WL, Pugsley CW, Hay CH. 2001.Effects of sea urchin
(Evechinus chloroticus) grazing in Dusky Sound, Fiordland, New Zealand.
New Zealand Journal of Marine and Freshwater Research35(5):1007–1024
DOI 10.1080/00288330.2001.9517060.
Wangersky PJ, Cunningham WJ. 1957.Time lag in prey-predator population models.
Ecology 38:136–139DOI 10.2307/1932137.
Watson J, Estes JA. 2011.Stability, resilience, and phase shifts in rocky subtidal
com-munities along the west coast of Vancouver Island, Canada.Ecological Monographs 81:215–239DOI 10.1890/10-0262.1.
Werner EE, Gilliam JF, Hall DJ, Mittelbach GG. 1983.An experimental test of the effects