Fascicle VI – Food Technology (2016), 40(2), 20-30
ORIGINAL RESEARCH PAPER
THE EFFECT OF NaCl SUBSTITUTION BY KCl ON TELEMEA CHEESE PROPERTIES
MIHAI ANGHELOIU, GABRIEL – DĂNUŢ MOCANU*, ELISABETA BOTEZ
Department of Food Science, Food Engineering and Applied Biotechnology, “Dunarea de Jos” University of Galati, 111 Domneasca Street, 800201 Galati, Romania
*Corresponding author: [email protected]
Received on 18th November 2015 Revised on 30th September 2016
The effect of partial or total substitution of sodium chloride by potassium chloride on the chemical composition, texture profile and sensory properties of Telemea cheese during 28 days of ripening at 4°C was evaluated in the current study. Telemea cheese was ripened in 4 different brine solutions (20%, wt/wt) made from different NaCl:KCl ratios as follows: (NaCl (A), KCl (B), 1NaCl:1KCl (C) and 1NaCl:2KCl (D)). The physicochemical properties of Telemea cheese (dry matter, fat, protein, ash, pH, total nitrogen (TN), water soluble nitrogen (WSN) and ripening degree values) were determined after 1, 7, 14, 21 and 28 days of ripening. Dry matter, pH and ripening degree values were significantly (p < 0.05) affected during ripening. The results of this study indicated that replacing 66% NaCl with KCl influenced the texture profile and sensorial characteristics of Telemea cheese.
Keywords: Telemea cheese, cow milk, NaCl substitution, texture profile, sensory evaluation
Introduction
White brined cheeses are the oldest known group of cheeses, classified as soft cheeses (Telemea, Feta, Akawi and Domiati cheeses) and semi-hard cheeses (Halloumi and Nabulsi cheeses) (Abd El-Salam and Alichanidis, 2004; Ayyash et al., 2012). Telemea cheese is originally from Romania and spread to other countries (e.g. Bulgaria, Greece, Turkey) (Tamime, 2006).
The World Health Organization has recommended that sodium intake should not exceed 2 g per day, which corresponds to about 5 g of salt intake (World Health Organization, 2011; Felicio et al., 2013). The decrease of NaCl content in cheese represents a great challenge for the industry because a simple reduction of this additive may affect the quality of this product (Reddy and Marth, 1991; Cruz et al., 2011; Ayyash et al., 2012).
The total or partial substitution of NaCl with KCl was successfully used to preserve the cheese quality. Several studies have been carried out to examine this effect on Akawi cheese (Ayyash et al., 2012), Halloumi cheese (Ayyash and Shah, 2010, 2011a; Ayyash et al., 2011), Nabulsi cheese (Ayyash and Shah, 2011b), Feta cheese (Katsiari et al., 1997; Katsiari et al., 2000), and Kefalograviera cheese (Katsiari et al., 1998; Katsiari et al., 2001). In these studies the chemical composition, proteolysis, microbial growth, sensorial analysis and texture profile were investigated.
The objective of this study was to evaluate the effect of total or partial substitution of sodium chloride with potassium chloride on the chemical composition, texture profile analysis and sensory properties of Telemea cheese.
Materials and methods
Cheese manufacture
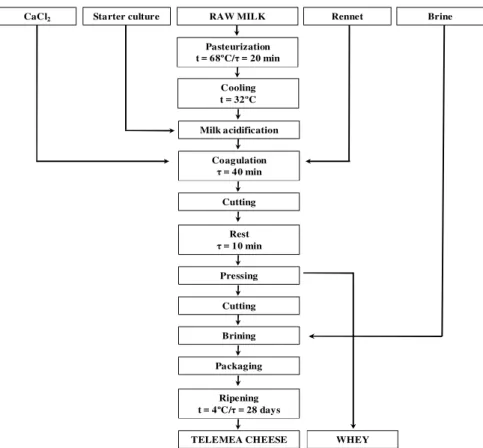
Telemea cheese was manufactured using the traditional method described by Costin (2003) (Figure 1). The fresh cow milk (20 L) with 3.6 % fat was pasteurized at 68°C for 20 min and cooled to about 32°C. After cooling, starter culture (FD-DVS FRC-65, Chr. Hansen, Denmark) containing Lactococcus lactis subsp. lactis, Lactococcuslactis subsp. cremoris, Streptococcus thermophilus and Lactobacillus delbrueckii subsp. bulgaricus was added according to manufacturer`s instructions. 5 mL chymosin (CHY-MAX® M from Aspergillus niger subsp. awamori) diluted in 100 mL distilled water was used as a coagulant agent. After coagulation, the curd was cut into small pieces, approximately 2 – 3 cm, and left to rest (10 min). Immediately after the pressing stage, Telemea cheese blocks (≈ 150g) were placed in 4 different brine solutions (20%, wt/wt) made from different NaCl : KCl ratios as follows: (NaCl (A), KCl (B), 1NaCl:1KCl (C) and 1NaCl:2KCl(D)). The Telemea cheese blocks were stored in brine solutions at 4 ºC for 28 days. All the analyses were carried out in duplicate after 1, 7, 14, 21 and 28 days of ripening.
Physicochemical analysis
Texture profile analysis
The texture profile of Telemea cheese (hardness, springiness, cohesiveness, chewiness index and gumminess) was determined at room temperature, following the method of Bourne (1978) using a CT3 Texture Analyzer (Brookfield, UK). The cheese samples (cylinder with 7 mm length and 12 mm depth) were compressed to 50% of their original height with a cylindrical probe (TA11/1000) 25.4 mm diameter, a 1000 g load cell and a cross-head speed of 2.0 mm/s. Two cycles of compression were carried out and the data were collected using TexturePro CT software. All analyses were performed in duplicate.
Figure 1. Flowchart for Telemea cheese manufacturing
Sensory evaluation
The sensorial characteristics of the Telemea cheese samples were evaluated by 15 untrained panellists (aged 20 – 25 years) using a 5-point hedonic scale for the following sensory attributes: taste and odour (1 = intensive foreign flavors and tastes, like acid, pungent, bitter or rancid to 5 = special flavor of telemea cheese with no perceptible foreign tastes and odors), colour and appearance (1 = porous
CaCl2 Starter culture RAW MILK Rennet Brine
Pasteurization t = 68ºC/τ= 20 min
Cooling t = 32ºC
Milk acidification
Coagulation τ= 40 min
Cutting
Rest τ= 10 min
Pressing
Cutting
Brining
Packaging
Ripening t = 4ºC/τ= 28 days
with large pores, and yellow colour to 5 = uniform and nonporous with white colour) and texture (hardness, springiness, chewiness, gumminess and cohesiveness) (Lawless and Heymann, 2010). Before sensorial analysis, the samples were left at room temperature (20°C) for 1 h to equilibrate, cut into small chunks (2 cm cubes), placed on white plates and coded with random numbers (Ayyash et al., 2012). Each Telemea cheese sample was examined after 28 days of ripening in duplicate.
Statistical analysis
One-way analysis of variance (ANOVA) was carried out on the experimental results. Differences were considered significant at p < 0.05. All results were presented as mean value ± standard error.
Results and discussion
Chemical composition
The effect of partial or total substitution of NaCl with KCl in Telemea cheese on pH, dry matter, fat, protein and ash contents and pH values during the ripening period is presented in Table 1.
Table 1. Changes of physicochemical parameters of Telemea cheeses during ripening Ripening
period (days)
Salt treatment1
Dry matter,
% Protein, % Fat,% Ash, % pH
0
A
36.92 ± 0.17 14.16 ± 0.10 16.33 ± 0.25 3.45 ± 0.11 5.46 ± 0.27 B
C
D
7
A 38.29 ± 0.12 14.59 ± 0.18 18.53 ± 0.35 4.19 ± 0.13 4.72 ± 0.34
B 40.51 ± 0.17 14.81 ± 0.17 17.20 ± 0.26 4.77 ± 0.14 4.87 ± 0.19
C 39.79 ± 0.13 14.90 ± 0.17 16.60 ± 0.36 4.32 ± 0.13 4.81 ± 0.31
D 40.56 ± 0.10 15.15 ± 0.16 17.30 ± 0.30 5.25 ± 0.17 4.91 ± 0.27
14
A 40.38 ± 0.13 15.28 ± 0.13 19.70 ± 0.40 4.63 ± 0.12 4.53 ± 0.24
B 41.12 ± 0.10 15.42 ± 0.11 18.96 ± 0.25 5.05 ± 0.12 4.61 ± 0.20
C 41.22 ± 0.13 15.57 ± 0.14 18.83 ± 0.29 4.44 ± 0.11 4.59 ± 0.25
D 41.58 ± 0.12 15.54 ± 0.16 18.17 ± 0.35 5.38 ± 0.11 4.72 ± 0.19
21
A 41.61 ± 0.10 15.08 ± 0.16 20.33 ± 0.25 4.92 ± 0.14 4.48 ± 0.18
B 41.25 ± 0.10 15.23 ± 0.12 19.30 ± 0.20 5.25 ± 0.11 4.53 ± 0.27
C 41.52 ± 0.15 15.13 ± 0.13 19.25 ± 0.25 4.59 ± 0.14 4.51 ± 0.14
D 41.89 ± 0.12 15.12 ± 0.16 19.13 ± 0.25 5.43 ± 0.13 4.63 ± 0.37
28
A 41.72 ± 0.11 14.78 ± 0.21 20.56 ± 0.35 5.23 ± 0.14 4.45 ± 0.15
B 41.32 ± 0.11 15.20 ± 0.11 19.93 ± 0.25 5.42 ± 0.19 4.48 ± 0.23
C 41.84 ± 0.12 14.93 ± 0.12 19.83 ± 0.23 4.71 ± 0.11 4.43 ± 0.17
D 41.98 ± 0.11 14.91 ± 0.12 19.47 ± 0.35 5.49 ± 0.12 4.57 ± 0.21 1
During ripening it can be seen a decrease in moisture that led to a relative increase in dry matter (Table 1) for all the Telemea cheese samples. In general, dry matter content during the ripening period can be influenced by some factors such as initial moisture, pH of cheese, and brine concentration. A double diffusion process appears when cheese is placed in brine. In this case, the values of dry matter and salt increase during ripening, therefore the moisture content of cheese is decreasing (Farahani et al., 2014).
After the pressing stage, the value of dry matter for soft cheese was 36.92 ± 0.17%. In the first 7 days of ripening, the dry matter content increased and reached a maximum value of 40.56 ± 0.10%. At the end of the ripening process, the dry matter for the sample D increased from 36.92 ± 0.17% to 41.98 ± 0.11%. Similar trends were observed by Mallatou and Pappa (2005) for different types of telemea cheese. During the ripening period, the protein and fat content in cheese samples were not significantly different (p > 0.05). Ayyash and Shah (2010; 2011b) and Ayyash et al. (2012) in their studies on the effect of partial substitution of NaCl with KCl on different types cheeses (Halloumi, Nabulsi and Akawi) reported similar results.
The ash content during the ripening period increased for all the cheese samples. The values of this parameter at the beginning of the ripening period was 9.36 ± 0.26% in dry matter and reached by the end of this period a maximum value of 13.08 ± 0.27% in dry matter, with the highest value in sample D.
The migration of KCl from the brine toward the cheese blocks increased the ash content of the Telemea cheese samples during the ripening period. Ayyash and Shah (2010) reported that ash content significantly increased when salt level increased.
As a results of lactose fermentation, the pH values significantly (p < 0.05) decreased during ripening. After 7 days of ripening, the pH values were higher in samples B and D, compared to samples A and C indicating that total or partial substitution of NaCl with KCl influences the pH values. This results are in agreement with those reported by Ayyash and Shah (2011b) and Katsiari et al. (1997). Such an aspect may be due to the higher pH of the KCl solution compared to the NaCl solution (Ayyash et al., 2012).
Salt concentration
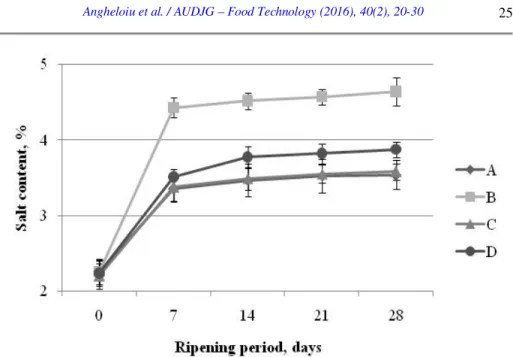
The evolution of salt content for all Telemea cheese samples is summarized in Figure 2. The salt content followed the pattern observed for dry matter that increased during ripening from 2.25 ± 0.16% to 4.63 ± 0.19%.
It seems that total substitution of NaCl by KCl increased the salt content significantly by 48.88% and reached a higher concentration for cheese sample B (4.43 ± 0.13%).
Figure 2. Evolution of salt content in telemea cheeses during 28 days of ripening
The nitrogen fractions and ripening degree dynamics
In Table 2 are presented the following indicators of proteolysis: total nitrogen (TN) and water soluble nitrogen (WSN) and the ratio between WSN and TN. In this study, an increase in the N-fractions of Telemea cheese during the ripening period was observed. This effect can be attributed to the proteinases and peptidases activity which enhanced the proteolysis process.
After 28 days of ripening, the TN content ranged between 2.31 ± 0.03% (A sample) and 2.33 ± 0.02% (D sample). It seems that total or partial substitution of NaCl by KCl as revealed by WSN has a minor influence on the primary proteolysis stage. Similar trends were observed by Michaelidou et al. (2005) and Radulović et al. (2011).
As it was expected, the level of ripening degree (RD) increased during ripening. Abd El Salam et al. (1993) reported that the RD of white brined cheeses usually ranges from 12 to 20% with a maximum value of 25%. In this study the RD at the beginning of the ripening period was 9.92 ± 0.65% and reached by the end of the ripening period a maximum value of 17.34 ± 0.84%.
Texture profile analysis
reported that total substitution of NaCl by KCl changes the hardness of Halloumi cheese and by Ayyash and Shah (2011b) who reported that hardness of Nabulsi cheese is affected by partial substitution of NaCl with KCl.
Table 2. Total nitrogen (TN), water soluble nitrogen (WSN) and ripening degree (RD) of Telemea cheeses during ripening
1
Salt treatment: NaCl (A), KCl (B), 1NaCl:1KCl (C) and 1NaCl:2KCl (D) All values are mean ± standard deviation
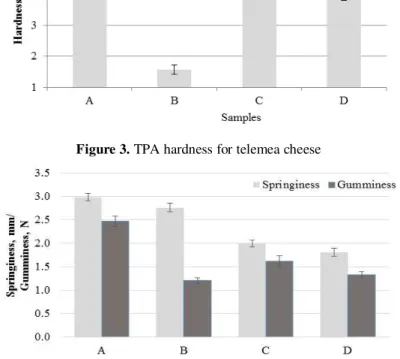
The highest values for springiness (Figure 4) were measured for cheese samples ripened in brine solution A (3 ± 0.11 N) and the lowest for the samples ripened in brine solution B (1NaCl:2KCl). In this research the partial substitution of NaCl with KCl significantly influenced this textural parameter.
The values of gumminess (Figure 4) for cheese samples ripened in brine solution B, C and D were the lowest and increased for the samples ripened in brine solution A. The mean values for gumminess ranged from 1.21 ± 0.05 N (B) to 2.47 ± 0.08 N (A). The decrease of gumminess is associated with Ca decrease during ripening (Ayyash et al., 2011).
The cohesiveness (Figure 5) of the Telemea cheese sample ripened in brine solution A was lower than for those ripened in brine solution B, C and D and ranged from 0.37 ± 0.05 to 0.43 ± 0.07. Similar results were reported by Ayyash et al. (2012) for Akawi cheese.
Ripening period (days)
Salt
treatment1 TN, % WSN, % RD, %
0
A
2.22 ± 0.02 0.22 ± 0.02 9.92 ± 0.65
B
C
D
7
A 2.28 ± 0.03 0.27 ± 0.03 11.75 ± 1.37
B 2.32 ± 0.03 0.28 ± 0.02 12.23 ± 1.17
C 2.34 ± 0.02 0.31 ± 0.05 12.98 ± 1.52
D 2.37 ± 0.02 0.34 ± 0.06 12.98 ± 2.48
14
A 2.39 ± 0.02 0.28 ± 0.03 11.86 ± 0.64
B 2.42 ± 0.01 0.29 ± 0.04 12.45 ± 1.11
C 2.44 ± 0.02 0.32 ± 0.02 13.16 ± 0.73
D 2.43 ± 0.02 0.36 ± 0.04 14.80 ± 1.76
21
A 2.36 ± 0.02 0.30 ± 0.03 12.81 ± 1.27
B 2.39 ± 0.02 0.33 ± 0.02 13.77 ± 0.98
C 2.38 ± 0.03 0.36 ± 0.03 15.11 ± 1.48
D 2.36 ± 0.02 0.39 ± 0.02 16.10 ± 0.70
28
A 2.31 ± 0.03 0.36 ± 0.02 15.65 ± 1.04
B 2.35 ± 0.03 0.37 ± 0.03 15.94 ± 1.29
C 2.34 ± 0.01 0.41 ± 0.01 16.56 ± 0.77
Figure 3. TPA hardness for telemea cheese
Figure 4. TPA springiness and gumminess for telemea cheese
The values of chewiness indexes (Figure 5) for cheese samples ripened in brine solution B, C and D were the lowest and increased for the samples ripened in brine solution A. The mean values for chewiness index ranged from 0.76 ± 0.04 N (C) to 1.28 ± 0.03 N (A). The decrease of chewiness indexes is associated with the increasing of proteolysis (Guinee et al., 2002).
Sensory evaluation
The results of the sensory evaluation of Telemea cheese are shown in Figure 6. Each Telemea cheese sample was evaluated for taste, odour, colour, appearance and texture (hardness, springiness, chewiness, gumminess and cohesiveness). The mean scores for taste ranged from 2.32 (B) to 3.81 (A) odour scores ranged from 1.72 (C) to 3.31 (B) and appearance scored from 3.83 (B) to 4.22 (M1). The hardness, cohesiveness, gumminess and chewiness index were higher (p < 0.05) for the samples ripened in brine solution A compared to the sample ripened in brine solution B.
significant changes in textural properties of cheese during ripening (p > 0.05), due to the proteolysis process that plays an important role in cheese texture.
Figure 5. TPA cohesiveness and chewiness index for telemea cheese
Figure 6. Sensory evaluation of telemea sample
From the sensory quality point of view, Telemea cheese containing potassium chloride was found acceptable by consumers. Similar results were reported by Katsiari et al. (1997; 1998) for Feta and Kefalograviera cheeses and Ayyash et al. (2012) for Akawi cheese salted with the NaCl/KCl mixture.
Conclusions
substitution of NaCl by KCl on the chemical composition and texture profile of Telemea cheese was insignificant. Further studies are needed to better understand the role of K ions in this type of cheese and their effect on proteolytic enzymes.
References
Abd El Salam, M.H., Alichanidis, E., Zrefridis, G.K. 1993. Cheese: chemistry, physics and microbiology, Vol. 2, 301–337, Chapman & Hall, London, UK.
Abd El-Salam, M.H., Alichanidis, E. 2004. Cheese varieties ripened in brine: In: Fox PF, McSweeney PLH, Cogan TM, Guinee TP, editors. Cheese: chemistry, physics and microbiology. Major cheese groups, Vol. 2, 3rd ed. 227 – 249, London, U.K.: Elsevier Academic Press.
Ayyash, M.M., Shah, N.P. 2010. Effect of partial substitution of NaCl with KCl on Halloumi cheese during storage: chemical composition, lactic bacterial count, and organic acids production. Journal of Food Science, 75(6), C525–C529.
Ayyash, M.M., Sherkat, F., Francis, P., Williams, R.P., Shah, N.P. 2011. The effect of sodium chloride substitution with potassium chloride on texture profile and microstructure of Halloumi cheese. Journal of Dairy Science, 94(1), 37–42.
Ayyash, M.M., Shah, N.P. 2011a. Effect of partial substitution of NaCl with KCl on proteolysis of Halloumi cheese. Journal of Food Science,76(1), C31–C37.
Ayyash, M.M., Shah, N.P. 2011b. The effect of substituting NaCl with KCl on Nabulsi cheese: chemical composition, total viable count, and texture profile. Journal of Dairy Science, 94(6), 2741–2751.
Ayyash, M.M., Sherkat, F., Shah, N.P. 2012. The effect of NaCl substitution with KCl on Akawi cheese: Chemical composition, proteolysis, angiotensin-converting enzyme-inhibitoryactivity, probiotic survival, texture profile, and sensory properties. Journal of Dairy Science, 95(9), 4747–4759.
Bourne, M.C. 1978. Texture profile analysis. Food Technology, 32(7), 62–66.
Costin, G.M. 2003. Ştiința și ingineria fabricării brânzeturilor, 400 – 413, Academica, Galați.
Cruz, A.G., Faria, J.A.F., Pollonio, M.AR., Bolini, H.M.A., Celeguini, R.M.S., Granato, D., Shah, N.P. 2011. Cheeses with reduced sodium content. Effects on functionality, public health benefits and sensory properties. Trends in Food Science and Technology, 22(6), 276–291.
Farahani, G., Ezzatpanah, H., Abbasi, S. 2014. Characterization of Siahmazgi cheese, an Iranian ewe’s milk variety: Assessment of physico-chemical, textural and rheological specifications during ripening. LWT – Food Science and Technology, 58(2), 335–342. Felicio, T.L., Esmerino, E.A., Cruz, A.G., Nogueira, L.C., Raices R.S.L., Deliza, R., Bolini
H.M.A., Pollonio, M.A.R. 2013. Cheese. What is its contribution to the sodium intake of Brazilians? Appetite, 66(1), 84–88.
Guinee, T P., Feeney, E.P., Auty, M.A.E., Fox. P.F. 2002. Effect of pH and calcium concentration on some textural and functional properties of mozzarella cheese. Journal of Dairy Science, 85(7), 1655–1669.
microbiological, and sensory properties of Halloumi cheese. Journal of Dairy Science, 95(3), 1140–1151.
Katsiari, M.C., Voutsinas, L.P., Alichanidis, E., and Roussis, I.G., 1997. Reduction of sodium content in Feta cheese by partial substitution of NaCl by KCl. Internatinal Dairy Journal, 7(6–7), 465–472.
Katsiari, M.C., Voutsinas, L.P., Alichanidis, E., Roussis, I.G. 1998. Manufacture of Kefalograviera cheese with less sodium by partial replacement of NaCl with KCl. Food Chemistry, 61(1–2), 63–70.
Katsiari, M.C., Voutsinas, L.P., Alichanidis, E., Roussis, I.G. 2000. Lipolysis in reduced sodium Feta cheese made by partial substitution of NaCl by KCl. Internatinal Dairy Journal, 10(5–6), 369–373.
Katsiari, M.C., Alichanidis, E., Voutsinas, L.P., Roussis, I.G. 2001. Proteolysis in reduced sodium Kefalograviera cheese made by partial replacement of NaCl with KCl. Food Chemistry, 73(1), 31–43.
Lawless, H.T., Heymann, H., 2010. Sensory Evaluation of food. Principles and Practices, 367, Springer, New York, USA.
Mallatou, H., Pappa, E.C. 2005. Comparison of the characteristic of Teleme cheese made from ewes, goats, cows or a mixture of ewes and goats milk. International Journal of Dairy Technology, 58(3), 158 – 163.
Michaelidou, A.M., Alichanidis, E., Polychroniadou, A., Zerfiridis, G. 2005. Migration of water soluble nitrogenous compounds of Feta cheese from the cheese blocks into the brine. International Dairy Journal, 15(6-9), 663 – 669.
Reddy, K.A., Marth, E.H. 1991. Reducing the sodium content of foods: A review. Journal of Food Protection, 54(2), 138–150.
Radulović, Z., Miočinović, J., Pudja, P., Barać, M., Miloradović, Z., Paunović, D.,
Obradović, D. 2011. Lactic acid bacteria in white brined cheese production.
Mljekarstvo, 61(1), 15–25.
Tamime, A.Y. 2006. Brined Cheeses, 63 – 68, Blackwell Publishing, Oxford, UK.