Sofia Leite Souza
Dissertation presented to obtain the Ph.D degree in Chemistry
Instituto de Tecnologia Química e Biológica | Universidade Nova de Lisboa
Oeiras,
December, 2012
Insert here an image
with rounded corners
On the physical-chemical
properties of ceramide C16
and of its mixtures with cholesterol,
Sofia Cristina Fazendas Borges Leite de Souza
Dissertation presented to obtain the Ph.D degree in Chemistry
Instituto de Tecnologia Química e Biológica | Universidade Nova de Lisboa
Oeiras, December, 2012
On the physical-chemical
properties of ceramide C16
i
Acknowledgements
To the pioneers! To the ITQB and IBET founders. For providing me the infrastructures, equipment, all a complete environment that allowed me to develop this Ph.D. in my country.
To Prof. Eurico, my supervisor, for the opportunity and privilege that he gave me to perform this Ph.D: the laboratory, fully equipped, the financial resources, the culture of the lab. I am grateful for the infinite patience that he had with me. For everything that he taught me. Not only from research, but also, far behind science. Knowledges, culture, treasures that I will carry with me forever.
To Prof. Winchill Vaz, that I had the privilege to meet at the laboratory of Prof. Eurico. For the privilege to have seen such a profound knowledge…For some beautiful scientific discussions.
I tank Prof. James Hamilton for having receiving me at his laboratory in Boston, Massachusetts. For having introduced me to Prof. Donald Small, and Prof. Shipley, to whom I had the privilege of having some discussions. For having stayed there, for all that I have learned.
To Prof. Manuel Carrondo, who gave life to this project, and opened for me the doors of ITQB. To his personal example, and of the team that he had the capacity to build: for the motivation, effort, hard work and enterprise spirit in the attitude towards work.
To my true friend Marta Abrantes, and all my friends and brothers in Christ, for all the help and support.
ii
To Josias, my husband. You have always encouraged me to proceed, and have given me your constant support. You have always shared with me the tasks involving the raising of the children, and the house-work. If it was not so, I would have been forced to give up, much time ago…
To my Lord, the God of Abraham, Isaac and Jacob. For continuous support and help. For giving me all the strength that was necessary. For providing, year after year the floaters, that allowed me to not sink.
iii
Abstract
iv
cholesterol. This data suggests the existence of the so-called “cholesterol
condensed complexes”. The reason for the detection of several lipid-ceramide
v
Resumo
vi
Estes compostos de C16-Cer constituem, tanto quanto sabemos, a primeira evidência experimental directa da existência de estruturas lateralmente organizadas de natureza cristalina compostas por lípidos anfifílicos formadores de bicamadas e colesterol. Este dado sugere a existência dos
chamados “cholesterol condensed complexes”. A razão para a detecção de
vii
Abbreviations
a.u. C16-Cer arbitrary units N-palmitoyl-D-erythro-sphingosine CE CEs cholesteryl ester cholesteryl esters CER CeramideCh Cholesterol
ChaI ChaII Chm
ChO
anhydrous cholesterol, polymorph I anhydrous cholesterol, polymorph II cholesterol monohydrate
cholesteryl oleate 13C MAS NMR
d 2D 3D DESY
13C magic angle spinning nuclear magnetic
resonance
distance between diffracting planes two-dimensional
three-dimensional
Deutsches elektronen synchrotron DPPC
DSC
dipalmitoylphosphatidylcholine differential scanning calorimetry egg-Cer natural ceramide of egg origin FA fatty acid
FTIR fourier transform infrared spectroscopy GIXD grazing incidence X-ray diffraction
HII inverted hexagonal phase
HPLC Lα
High performance liquid chromatography lamellar liquid crystalline phase
viii
Lβ Lβ´
lamellar gel phase lamellar gel tilted phase LC
LC1 LC2
LC3
LC4
LPP MAS NMR
N-SPHING CER
lamellar crystalline phase
pure or almost pure C16 ceramide
compound phase of C16 ceramide and cholesterol with relative molar proportion 2:3
compound phase of C16 ceramide, cholesterol and palmitic acid with the relative molar proportion 5:4:2 compound phase of C16 ceramide and cholesterol with relative molar proportion 1:3
long periodicity phase magic angle spinning
nuclear magnetic resonance N-sphingosyl ceramide
PA palmitic acid
s SAXS
reciprocal distance (s = 1/d) small angle X-ray scattering SC stratum corneum
TLC thin layer chromatography
ix
Index
1. Introduction
11.1. Lipids: ceramides, cholesterol, fatty acids and cholesteryl
esters 2
1.2. Ceramides: localization and biological function 5
Ceramides: the main lipid component of the skin barrier 5
Ceramides in plasma membrane and the ceramide-rich-domains 5
1.3. The composition and structural characteristics of stratum
corneum 6
Stratum corneum, the final product of epidermal differentiation 7
pH of the stratum corneum 9
Lipid composition of the stratum corneum matrix 10
Organization of the stratum corneum lipids 13
Empirical approach to the study of the stratum corneum lipid
matrix 14
1.4. Thermodynamic properties of pure lipids in water 15
The main phase transition 15
1.5. Structural properties of amphiphilic lipids in water 17
Structures formed by amphiphilic lipids in excess water 18
Lamellar phases 21
1.6. Thermotropism of mixtures of lipids: binary phase diagrams 23
Types of phase diagrams 24
Congruent transformation 25
1.7. N-sphingosyl ceramides 26
Single crystal structures of hydroxylated ceramides 26
Structure in monolayers at the air-water interface 28
Monolayers of ceramide, cholesterol mixtures 29
Thermotropic phase behaviour 29
Ceramides establish strong hydrogen-bonds 30
x
Hydration behaviour 31
Phase diagrams of ceramide with other lipids 31
1.8. Cholesterol 32
Structure in the solid state 32
Thermotropic phase-behaviour in water 33
Models for phospholipids/cholesterol mixtures: the “condensed
complex” formation proposal 34
1.9. Long chain fatty acids 37
Structure and thermotropic phase behavior in water 37
Induction of inverted hexagonal phases 39
Phase-behaviour of mixtures of palmitic acid and cholesterol in
excess water 39
1.10. Cholesteryl Esters 40
Structural arrangements of cholesteryl esters 40
Cholesteryl oleate structure and thermotropic phase-behavior 43
Solubility of cholesteryl esters in amphiphilic lipids 44
1.11. Powder pattern X-ray diffraction of lipid-water systems 44
1.12. 13C-magic angle spinning-nuclear magnetic resonance
applied to lipid bilayers 46
Probing cholesteryl ester environment 46
Solid State NMR techniques 48
1.13. References 49
2. Phase behavior of aqueous dispersions of mixtures
of N-palmitoyl ceramide and cholesterol: a lipid
system
with
ceramide-cholesterol
crystalline
lamellar phases.
612.1. Abstract 62
2.2. Introduction 62
2.3. Materials and methods 65
Reagents 65
Preparation of lipid dispersions 65
Differential scanning calorimetry 66
xi
2.4. Results 68
Thermal studies 68
X-ray diffraction studies 70
Mixtures from pure C16-Cer to pure Ch below 30 ºC 72
Thermotropic behavior of pure C16-Cer 75
Thermotropic behavior of pure Ch 77
Thermotropic behavior of samples with 5, 20, 46 and 55 mol %
Ch 78
Thermotropic behavior of samples with 65 and 70 mol % Ch 78
Thermotropic behavior of samples with 80 and 90 mol % Ch 79
2.5. Discussion 80
Pure ceramide and LC1 phase 80
Mixtures rich in Ch. The LC2 and LC4 phases 82
C16-Cer:Ch phase diagram 84
2.6. Conclusions 87
2.7. Acknowledgments 88
2.8. References 88
3. The thermotropism and prototropism of ternary
mixtures of ceramide C16, cholesterol and palmitic
acid. An exploratory study
953.1. Abstract 96
3.2. Introduction 97
3.3. Materials and methods 99
Reagents 99
Preparation of lipid dispersions 100
Differential scanning calorimetry 101
Cholesterol quantification by 1H-NMR for ΔHº determination 101
X-ray diffraction 102
Calculations 103
3.4. Results 105
Effect of progressive addition of fatty acid to mixtures of
ceramide/cholesterol (54:46) up to 60 mol % of fatty acid 105
xii
X-ray studies for 5 mol % PA 105
X-ray studies for 12 mol % PA 105
X-ray studies for 18 mol % PA 105
X-ray studies for 60 mol % PA 108
DSC studies for 0, 5, 10, and 20 mol % PA 109
Effect of pH variation for the mixture of ceramide C16,
cholesterol and palmitic acid with 44:38:18 molar ratio 110
Mixtures of ceramide, cholesterol, palmitic acid with increasing
amounts of palmitic acid, at pH 4.0 114
Pure PA 114
X-ray studies for 40-70 mo l% PA 114
3.5. Discussion 118
3.6. Conclusion 126
3.7. Acknowledgments 128
3.8. References 128
4. Study of the miscibility of cholesteryl oleate in a
matrix of ceramide, cholesterol and fatty acid
1354.1. Abstract 136
4.2. Introduction 136
4.3. Materials and methods 139
General reagents 139
Synthesis of labeled ChO 140
Preparation of dispersions 140
Differential scanning calorimetry 142
Cholesterol and ChO quantification by 1H-NMR for
Hº
determination 142
X-ray measurements 143
MAS NMR 144
4.4. Results and discussion 144
DSC of CER:Ch:FA matrix with ChO at pH = 9.0 145
CER:Ch:FA matrix with ChO at pH 4.0 and 9.0 – SAXS and
WAXS 147
CER:Ch:FA matrix plus ChO at pH = 4.0 and 9.0 – 13
xiii
153
Further comments on the experimental results 156
4.5. Conclusions 157
4.6. Acknowledgments 158
4.7. References 159
5. Final Discussion
165Chapter 1
2
1.1. Lipids: ceramides, cholesterol, fatty acids and cholesteryl
esters
Lipids, together with proteins, nucleic acids, and carbohydrates, are the basic building blocks (molecules) of all living organisms.
Lipid molecules are responsible for numerous biological functions. They are the main constituents of biological barriers forming the cell and the intracellular membranes, are used for storage of cellular energy, and in some living organisms lipids can be found playing roles as biological detergents and as signaling molecules like hormones (for example steroid hormones), prostaglandins, leukotrienes and pheromones.
This thesis will be mainly concerned with one class of lipids, the ceramides (CER), and its mixtures with other lipids. Ceramides have been quite neglected, as compared with other more common amphiphilic lipids, and the work here presented is a contribution for a better understanding of their physical-chemical properties and of the structures adopted by the aggregates formed by ceramides when alone or in mixtures with cholesterol, fatty acids and cholesteryl esters, lipids to which they are often associated in biological systems.
Introduction
3 ceramides, cholesterol, long chain fatty acids and cholesteryl esters2. If an application is to be found to the work here presented, this will be mainly related to the functions performed by ceramides in the stratum corneum (SC) lipid matrix, due to the fact that the systems studied were constituted by a large amount of ceramides, and eventually because some of the ternary mixtures studied present a similarity in the relative molar proportion of cholesterol and long chain fatty acid, that were additionally added.
Ceramides are a subclass of sphingolipids, and are composed of the amino alcohols D-erythro sphingosine, dihydrosphingosine or phytosphingosine (including also their C16, C17, C19, and C20 homologs), esterified to a long chain fatty acid. In the dihydrosphingosine backbone, the unsaturation is absent, and in phytosphingosine is replaced by a hydroxyl group located at C4. Ceramides containing additional hydroxyl groups in the fatty acid moiety are also detected in tissue extracts. More complex sphingolipids are obtained from ceramides, such as sphingomyelin, or cerebrosides, by the respective addition of a phosphocholine group or a sugar molecule.
The ceramide used in most studies that compose this thesis is a sphingosine derived ceramide, N-palmitoyl-D-erythro-sphingosine, (C16-Cer). The basic structure of this ceramide is presented in Figure 1.1.
Figure 1.1. - Molecular structure of N-palmitoyl-D-erythro-sphingosine.
Chapter 1
4
fractions in cell membranes3. The solubility of Ch in bilayers of glycerophospholipids range from 50 to 66 mol %4. This lipid performs important functions in the cell membranes, being essential for viability and cell proliferation3. Cholesterol is also a precursor of steroid hormones, bile acids and the active form of vitamin D.
Figure 1.2. - Molecular structure of cholesterol (5-cholesten-3β-ol).
Introduction
5 Cholesteryl esters, (CE), are ubiquitous in biological systems. In higher mammals, they are the form of both cholesterol transport in the blood-stream, and storage in living cells.
1.2. Ceramides: localization and biological function
Ceramides: the main lipid component of the skin barrier
The epidermis of mammals is responsible for their skin water barrier properties. The barrier is located in the SC layer, as become established in the 1950s6. Experimental data accumulated during the 80s and 90s of the last century, evidences that the SC lipid matrix plays the major role in this barrier function. This became evident with an experiment in which SC lipid removal with organic solvents, increased transepidermal water loss, TEWL7, and by the observation that inhibition of enzymes involved in the synthesis of CER, cholesterol and free fatty acid leads to impaired barrier function8,9. In the SC lipid matrix, ceramides are the most abundant lipid class2, performing a key role in this water barrier system.
Ceramides in plasma membrane and the ceramide-rich-domains
In the plasma membrane, ceramides have been established as a second messenger, involved in the induction of cell differentiation, inhibition of cell proliferation, regulation of inflammatory responses, and induction of apoptosis10.
Chapter 1
6
signaling in association with the tendency of mixtures of ceramide and phospholipid to form co-existing CER-enriched phase domains, lead to suggestions that CER signaling could occur in specific regions of the cell
membrane, like “rafts” and caveolae12. In these regions, shingomyelinase
would hydrolyze sphingomyelin, generating the CER domains. Additionally, it is claimed by some authors to have evidence for the formation of these CER-enriched membrane domains in cells13.
Ceramide formation is also known to induce protein-protein contacts, which can modify the activity of the proteins12, and could be relevant for the signaling function attributed to the CER enriched domains.
In addition, ceramides induce budding of vesicles in model membranes14, and this ability has also been confirmed in cells, what seems to indicate a functional role in the endocytic pathway12. Lateral phase separation of ceramide-rich domains seems to be involved in pathogen internalization and virus budding13.
1.3. The composition and structural characteristics of stratum
corneum
Introduction
7
Figure 1.3. - Structure of human skin.Adapted from ref. 16.
Stratum corneum, the final product of epidermal differentiation
Chapter 1
8
Figure 1.4. - Layers of the epidermis (cross section), evidencing the SC as the uppermost layer.
Adapted from ref. 18.
This differentiation process is continuously occurring in the body, and layers of
“old” SC are continuously shed away from our skin, in a process known as
desquamation. It is estimated that a complete cycle of the epidermis, from the basal layer to the SC comprises 20 to 30 days17.
Introduction
9 final lipid composition constituted mainly by ceramides, long chain fatty acids and cholesterol.
Additionally, the keratinocytes will develop in the inner part of the plasma membrane what is identified in electron microscopy as an electron-dense proteic layer with about 10 nm thickness. This membrane is known as the cornified envelope19. A covalently bound layer of lipids composed of long chain -hydroxyceramides will surround the extra-cellular surface of the corneocytes20,21. This layer is known as the lipid envelope.
The result of this differentiation program is the formation of a network of flat dead cells without nuclei, with the cytoplasm filled with keratin, surrounded by a lipid matrix, now constituting the skin uppermost layer, the SC.
pH of the stratum corneum
Chapter 1
10
Lipid composition of the stratum corneum matrix
The published reports of stratum corneum lipid composition are extremely abundant; nevertheless, the proposed amounts for each lipid class are not coincident.
From the determinations in the literature it is reasonable to consider that the SC lipid matrix is composed of ca. 44 mol % of ceramides, 38 mol % of cholesterol and 18 mol % of long chain fatty acids, calculated considering only these three main lipid classes. We have obtained this composition by selecting the three more coincident determinations obtained by three independent research groups using two different experimental techniques, among all the SC lipid determinations published in the literature collected by Wertz and Norlen23 (Table 1.1.). We chose the determination of Norlen
et al.24, in which the relative proportions are reported in weight, and converted to molar composition by using the molecular mass of a C24 ceramide for the ceramide fraction. Some of the more recent SC lipid determinations that appeared after the cited review are also presented in Table 1.1. As can be appreciated, those determinations do not change our conclusions.
Introduction
11
Table 1.1. - Selected stratum corneum lipid determinations. The first three determinations are
the more similar determinations selected from the compilation of Wertz and Norlen23. More
recent determinations are also presented. CAD – charged aerosol detector; HPTLC – high performance thin layer chromatography; LSD – light Scattering detector.
Study
Cer (mol%) base
MM(cer 24) =
650
Ch (mol%) MM = 387
FA (mol%) base
MM (C24) =
368
Method
Norlen et al., 1999 44 38 18 HPLC/LSD Wertz et al., 1987 41 45 15 TLC
Bonté et al., 1997 (a) 41 38 21 TLC
De Paepe et al., 2004 17 49 34 HPTLC
Pappanien et al., 2008 38 34 28 TLC
Merle et al., 2010 48 22 30 HPLC/LSD-CAD
(a) If we discard the unsaturated FA as a contamination, as proposed by Wertz and
Norlen23
Chapter 1
12
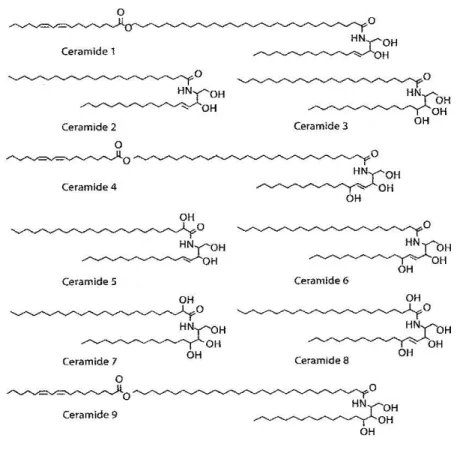
Figure 1.5. - Structures of the ceramides of the stratum corneum. Adapted from ref. 25.
As can be observed, each fraction contains one structural type of CER. There are combinations of sphingosines or phytosphingosines with amide linked normal or -hydroxy acids. Within each fraction, there is considerable heterogeneity in aliphatic chain length.
Introduction
13 thickness26,27, a long periodicity phase (LPP) detected in SAXS characterizations of intact SC28,29. In some studies, the authors only find the 13 nm phase when ceramide 1 is added to certain lipid mixtures, what they interpret as ceramide 1 being necessary for the LPP phase30,27. This long chain ceramide has a clearly established role in the formation of the corneocyte lipid envelope31,32, and the linoleic moiety seems to be required for the transglutaminase 1 enzyme to attach this lipid to the cornified envelope32. The long chain fatty acids of the SC, are straight-chain and saturated. The most abundant chain length ranges from C24, C26 and C282.
Cholesteryl esters are also detected. The amounts reported in the literature range from 2%19 to 18%24, depending on the study. This variability is frequent in lipid determinations of tissues, due to contamination. In a study conducted by Wertz and colleagues33, the lipid composition of the SC was determined in epidermal cysts. Epidermal cysts are isolated structures where the SC grows inside a capsule. Consequently, as no contamination occurs, this lipid determination can correspond more precisely to the true lipid composition of the SC. In this study, a 10 wt % in CEs was obtained, which makes cholesteryl esters as the fourth most abundant lipid class in the SC. Further confirming the relevance of CEs is a study in which the lipid determination of the SC of a reconstructed skin growth in vitro has been performed. This SC is obtained from keratinocytes that are growth over a collagen substrate, therefore without subcutaneous or sebaceous contamination, and cholesteryl esters were clearly detected34.
Organization of the stratum corneum lipids
Chapter 1
14
conventional bilayers. Several theoretical models explaining the molecular arrangement of lipids that give origin to this 13 nm large lamellar phase have been proposed in the literature36. Nevertheless, the existence of this LPP phase in native SC is not accepted by all authors, being currently a matter of debate37,38.
An X-ray signal with lipid origin, located at 4.6 Å, which is characteristic of lipids in the fluid state, is also detected28, co-existing with the 6.4 and 13.4 nm crystalline lamellar structures.
Empirical approach to the study of the stratum corneum lipid matrix
Introduction
15 containing only CER, cholesterol and long chain fatty acids has been confirmed in more complex mixtures45.
Note that the focus of most of these studies has been to replicate in vitro the properties of the SC lipid matrix and determine which components, from its complex composition, are the key structural lipids, and not to characterize the physical-chemical properties of the individual lipids, and their mixtures.
In this thesis the thermotropic phase behavior of well-defined binary (containing cholesterol) and ternary (with additional long chain fatty acid) N-sphingosyl ceramide mixtures has been studied. For the binary C16-Cer, cholesterol mixture, a phase diagram in excess water has been obtained. The structural studies by SAXS-WAXS allowed the identification of three stoichiometric aggregates in the mixtures studied, and to our knowledge, this constitutes the first direct experimental evidence of the existence of such structures in lipid bilayers. The miscibility of a model cholesteryl ester, cholesteryl oleate was also accessed, in a ternary mixture of C16-Cer, cholesterol, and long chain fatty acid.
1.4. Thermodynamic properties of pure lipids in water
An important component of the physical-chemical characterization of amphiphilic lipids in excess water is the study of their thermotropic phase behavior.
The main phase transition
Chapter 1
16
is a sharp peak. It corresponds to a phase transition from a state where the lipid chains are more ordered, with a high trans-gauche configurational ratio, to
a “liquid-crystalline”, “fluid” phase46, in which the hydrocarbon chain
configuration is characterized by a lower trans-gauche configurational ratio. In this specific example, a first small endotherm is also detected, which corresponds to a pre-transition to the ripped phase, P’. This pre-transition is
only observed for saturated phosphatidylcholine water mixtures. The maximum temperature of this peak, Tm, is used to characterize the transition, associated with the enthalpy of the transition.
Figure 1.6. - Typical differential scanning calorimetry heating scan of saturated chain
phosphatidylcholine bilayers in excess water. The lipid organization correspondent to each temperature region is depicted in the lower portion. L’ - Lamellar gel tilted; P’ - Rippled gel; L
Introduction
17 Compilation of Tm, ∆Ho and ∆S, for several lipid types is available47. The phase transition temperature is markedly dependent on the hydrocarbon chain length, the nature of the polar head-group, the presence, number and position of double bounds in the hydrocarbon chains, and ionic composition48.
The main phase transition in lipid bilayers is the result of hydrocarbon chain melting49. This has been concluded from two experimental facts. First, the wide angle powder diffraction pattern of saturated phosphatidylcholine bilayers below the temperature of the main phase transition is composed by one or several sharp lines and above Tm by a diffuse line at 4.5 Å, very similar to the profile of fluid long chain alkanes. Additionally, systematic studies of the dependence of Tm with acyl chain length, performed for saturated phosphatidylcholines, showed a systematic increase of the Tm with the increase in acyl chain length.
The phase transition in lipid bilayers has a non-zero transition enthalpy (Hº 0). Nevertheless it occurs in an appreciable range of temperatures. Impurities, and packing imperfections in the solid state, introduce artifact broadening of transition temperatures. With the measurements on purer dipalmitoylphosphatidylcholine (DPPC) samples50, it become clear that the main lipid bilayer transition is truly first order.
1.5. Structural properties of amphiphilic lipids in water
Chapter 1
18
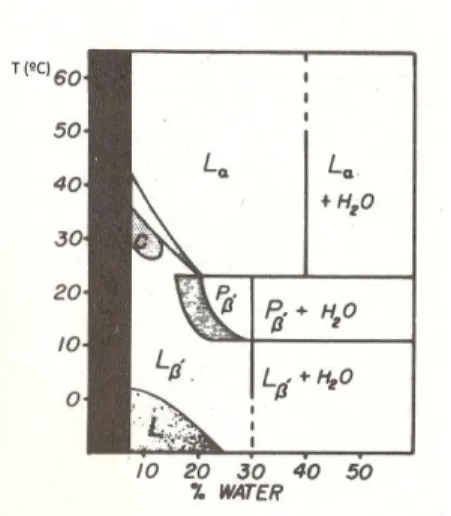
Figure 1.7. - Phase diagram of dimyristoyl phosphatidylcholine as a function of water content. Refer to Figure 1.6., for the meaning of L’, P’ and L. Adapted from ref. 51.
Structures formed by amphiphilic lipids in excess water
In mixtures with water, amphiphilic lipids display polymorphism. Several types of lamellar phases have been observed (Figure 1.8.).
Introduction
19
Figure 1.8. – Several lamellar forms of amphiphilic lipids in excess water. LC - Lamellar
crystalline, L - Lamellar gel. Refer to Figure 1.6., for the meaning of L’ and L. Adapted from ref.
51.
Chapter 1
20
Figure 1.9. - Structure of an inverted hexagonal phase and a bilayer cubic phase.Adapted from
ref. 52.
A very simplistic but useful model taking only into account geometric considerations can be used to predict and understand the structures formed by the amphiphilic molecules53. A surfactant parameter:
(1)
can be derived in which, V is the volume of the hydrocarbon portion, ao is the
effective area per head group, and l is the length of the hydrocarbon chains.
Bilayers may be formed for amphiphilic molecules with a surfactant parameter = 1. Inverted structures, such as inverted hexagonal phases, are formed for
surfactant parameter › 1.
Introduction
21
Lamellar phases
The nomenclature of lamellar lipid mesophases is composed by a first letter referring to the form of arrangement, and a second describing the acyl chain packing mode (Figure 1.8.).
Lamellar crystalline state: LC. The molecular lateral packing properties of
lipids in this phase are similar to those observed from single crystal X-ray studies of lipids in their anhydrous crystals51. Note that this L
C state is not a three dimensional crystal. The several powder pattern wide angle reflections observed in the LC state, evidence order that propagates only within each bilayer, and not to adjacent bilayers103.
Chapter 1
22
Figure 1.10. - Examples of acyl chain packing modes for several lattices. Adapted from ref. 54.
Lamellar gel phase: Lβ andLβ’. X-ray powder diffraction of lipid bilayers in
the L state show a hexagonal or orthorhombic hybrid subcell packing of the
hydrocarbon chains. In this state, the molecules are less tightly packed than in the lamellar crystalline phase, and this phase is more hydrated than the LC. In the Lβ’ phase, the acyl chain axes are tilted relative to the normal to the bilayer
plane. This tilting is rationalized as resulting from the differences in the in-plane area occupied by the head groups, which is slightly larger than the sum of the in-plane area of the two acyl chains.
Introduction
23 membranes are in the L state. The crystalline lamellae of the SC constitute an
exception28.
1.6. Thermotropism of mixtures of lipids: binary phase diagrams
A phase diagram indicates the phases present in mixtures of all possible combinations of the components, at all temperatures, and the information presented always represents the phase relationships that occur under equilibrium conditions. With a phase diagram we are able to predict, for a given temperature, pressure and chemical composition of the system, which phases are present, their composition and how they interconvert with changes in pressure, temperature or composition. For a system with C components the Gibbs phase rule relates the maximum number of phases present at equilibrium, P, with the degrees of freedom of the system, F:
F + P = C + 2 (2)
Chapter 1
24
occupy separate regions in space, meaning that interfacial effects are expected to be significant.
Types of phase diagrams
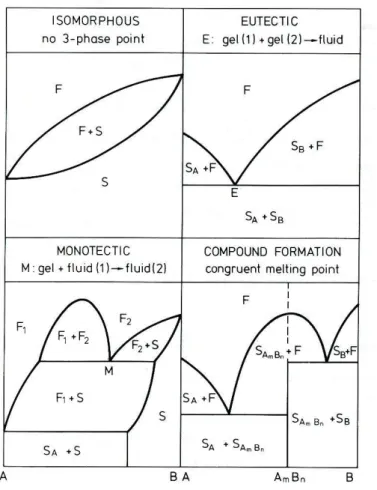
The properties of mixtures of substances give origin to different types of phase diagrams. Figure 1.11 illustrates some of the basic types.
Figure 1.11. - Main types of phase diagrams. F – Fluid; S – Solid; E – Eutectic point; M –
Introduction
25 An isomorphous phase diagram occurs in mixtures where the two components are mutually soluble. The components are soluble in all proportions, both in the liquid and in the solid state. This complete miscibility is only possible if the structure of the pure components is virtually identical57. In eutectic systems, the mixture of the two components induces a lowering of the melting point, relative to the melting temperature of each component. The liquidus curve passes through a minimum temperature, known as the eutectic point. For this specific composition, the solid mixture melts in a narrow temperature range, in the same manner as a pure compound. In eutectic systems, the components in the liquid state are miscible in all proportions, but miscibility in the solid state is limited. The binary monotectic phase diagrams are included in the eutectic class. The difference relies in the fact that during cooling, two co-existing immiscible liquids give origin to one solid immiscible with another liquid phase whereas in eutectic systems, the liquid melt originates two immiscible solids. Other types of more complex phase diagrams have been described namely the binary peritectic and the binary syntectic.
Congruent transformation
Chapter 1
26
1.7. N-sphingosyl ceramides
The melting point of dry N-24:0-sphingosylceramide and N-16:0-sphingosylceramide is respectively 93-95 ºC58 and 95.4 ºC59. Although the data are only available for two chain lengths, it seems to indicate that for dry ceramides the variation in the melting point with chain length is small. A similar behavior has been observed for other amphiphilic lipids such as phosphatidylcholines, phosphatidylethanolamines, and N-acyl sphingosyl sphingomyelins with saturated acyl chains47.
To the best of our knowledge there are no single crystal structure models for N-sphingosyl ceramides (N-SPHING CER) in the scientific literature, but there are determinations concerning hydroxylated ceramides. It is not straightforward that the structure of hydroxylated ceramides can be compared to that of N-sphingosyl ceramides. Nevertheless, due to the importance of the structural data obtained from single crystal studies and its possible implication for our work, this information is presented in the following section.
Single crystal structures of hydroxylated ceramides
Introduction
27
Figure 1.12. - Solid state packing arrangements of two hydroxylated ceramides. The ceramides are 24-PSp - N-tetracosanoyl-phytosphingosine; h218-PSp -
N-(2D,3D-dihydroxyoctadecanoyl)-phytosphingosine. Adapted from ref. 62.
In the crystal of N-tetracosanoyl-phytosphingosine60, the CER molecules are packed with extended chains in single layers, with the molecules adopting a V-shaped conformation (Figure 1.12). The molecules are connected by three intermolecular and one intramolecular hydrogen bond in the polar part of the molecule. The hydrocarbon chains are pointing out in opposite directions, adopting the V-shaped form, to allow space for the hydroxyl groups in the polar part of the molecule. This lipid also forms regular interdigitated bilayers, depending on the protocol of crystallization63.
Chapter 1
28
7.39 and c= 2.53 Å, with = 90.1 = 91.4 and = 89.6 º. The packing cross-section of the chains perpendicular to their long axis is 18.6 Å.
Pascher and Sundell61 interpret the reluctance of hydroxylated ceramides to adopt a bilayer structure has the result of a network of hydrogen bonds that is established at the monolayer center. This network of interactions seems to be more favorable than an alternative network in a bilayer arrangement.
Structure in monolayers at the air-water interface
The structure of synthetic N-C18:0-sphingosyl ceramide films at the air-water interface has been studied by X-ray reflectivity and grazing incidence X-ray diffraction64.
In this study, the authors find evidence for an arrangement of the CER film in two co-existing phases. One with hexagonal acyl chain packing (lattice constant a = 4.81 Å), and another with an orthorhombic arrangement (lattice constants a = 5.30 Å, b = 7.84 Å). At higher compressions, the hexagonal acyl chain packing is predominant. Without compression, both arrangements are detected, and a two dimensional gas phase also co-exists. In another work, Scheffer and colleagues studied monolayers of N-palmitoyl-D-erythro-sphingosine, also by grazing incidence X-ray diffraction measurements (GIXD)65. For uncompressed monolayers at the air-water interface, they have obtained four overlapping peaks at qxy = 1.45, 1.49, 1.53 and a small one at 1.62 Å -1. From their diffraction data they derive a near rectangular unit cell with
a = 5.02, b = 8.17 Å, and = 91.9º. At high pressures, approximately 20 mN.m-1, sharper peaks are obtained at
qxy = 1.43, 1.48, and at 1.62 Å -1
Introduction
29
Monolayers of ceramide, cholesterol mixtures
In the above mentioned study of Scheffer and colleagues, several mixtures of N-palmitoyl-D-erythro-sphingosine with cholesterol were also characterized by GIXD. At a CER:Ch ratio ranging from 100:0 to 70:30, they detect only crystalline CER. From 70:30 to 50:50 a crystalline mixed phase composed of ceramide and cholesterol is observed, co-existing with the pure CER phase. And from a CER:Ch ration of 33:77 up to 10:90, only the mixed phase is present. They observe continuous miscibility of cholesterol with CER, even at high cholesterol concentrations.
Thermotropic phase behavior
Shah et al.59 have characterized the phase behavior of anhydrous synthetic CER with a non-hydroxy fatty acyl palmitoyl chain, the C16-Cer. A single thermal transition at 95.4 ºC, with a ΔHº = 43.5 kJ.mol-1 is observed. By powder pattern X-ray diffraction, it was established that the low temperature organization is a lamellar phase with d = 4.21 nm, and four sharp reflections in the wide angle region located at 0.48, 0.43, 0.41 and 0.37 nm. At 92 ºC, a single broad reflection with a repeat distance of 2.75 nm with a diffuse band in the wide angle region at 0.47 nm, which is indicative of melted acyl chains, is observed.
Hydrated systems of C16-Cer display a broad exothermic transition at 50-70 ºC, followed by an endothermic transition at 90 ºC with a ΔHº of 13.8
kcal/mol59. The low temperature metastable phase is lamellar with d = 4.69 nm, and a broad wide angle peak at 0.41 nm. After the exothermic
Chapter 1
30
The C16-Cer thermotropism and phase behavior has also been characterized by FTIR66. At 63 ºC, a solid-solid phase transition, interpreted as an orthorhombic to hexagonal chain packing transition is observed. With further increase in temperature, at 90 ºC a transition to a phase with conformationally disordered chains is observed.
Ceramides establish strong hydrogen-bonds
In the characterization of N-sphingosyl ceramides, (bovine brain derived) prepared in excess water by FTIR, the presence of strong hydrogen bonds to the CER amide group is clearly detected67. This conclusion was derived from the reduction in amide I frequency, generally located at approximately 1650 cm-1, and mostly originated by C=O stretch, and the increase in amide II frequency, generally located at approximately 1550 cm-1, mostly resultant from C-N stretch and N-H in plane bending. This result has also been confirmed for synthetic N-C18:0-sphingosyl-ceramide68.
Dependence of Tm with acyl chain length
Introduction
31
Hydration behavior
In our experience N-SPHING CER do not behave as the most thoroughly studied phosphatidylcholines that can be observed to spontaneously hydrate in the presence of water, originating turbid, homogeneous dispersions. On the contrary, when N-sphingosyl ceramides water dispersions are prepared, their
macroscopic aspect can be described as a clear fluid containing some “solid
like” white plates floating at the water surface. This observation raise concerns
related with the capacity of N-SPHING CER to hydrate. Additionally, Jendrasiak and Smith69, predict that ceramides obtained from hydrolysis of egg and brain sphingomyelin are weak water adsorbers. These natural sphingomyelins have N-sphingosyl architecture. The authors measured the amount of water vapor adsorbed by a monolayer of CER along increasing water vapor pressure.
In opposition, and suggesting that N-sphingosyl ceramides are able to hydrate, a study of the thermotropism of this CER type with increasing water content, evidence a clear reduction in the main phase transition temperature with increasing water amount59. Dry synthetic N-C16:0-sphingosyl ceramide has a
Tm = 95.4 ºC with Ho = 43.5 kJ.mol-1. The main transition temperature decreases until a limiting water amount of 9.3 weight %, with a Tm = 90.2 ºC, and H o = 58.5 kJ.mol-1.
Phase diagrams of ceramide with other lipids
Chapter 1
32
diagrams. Several phase diagrams have been obtained such as of N-sphingosyl ceramide (bovine brain derived) with DPPC70, N-sphingosyl ceramide C16:0 with 1-palmitoyl-2-oleoyl phosphatidylcholine, POPC71, with dimyristoylphosphatidylcholine, DMPC72 and with dielaidoyl phosphatidylethanolamine, DEPE73. The overall picture that results from those diagrams74 evidences that the miscibility of CER with phospholipids in the gel state is reduced. In the liquid crystalline state, phase separation is already observed at very low ceramide concentrations. The studies were only performed in the region of low ceramide content, up to approximately 20%74. Only one study71 explored the phase diagram at high CER concentrations. To our knowledge, all the phase diagrams of CER with cholesterol and with fatty acids published in the literature have used phytosphingosine derived ceramides. These CER have distinct physical properties, and therefore are not directly comparable with the ceramide used in our studies, N-sphingosyl ceramide.
1.8. Cholesterol
Structure in the solid state
Introduction
33
Thermotropic phase-behavior in water
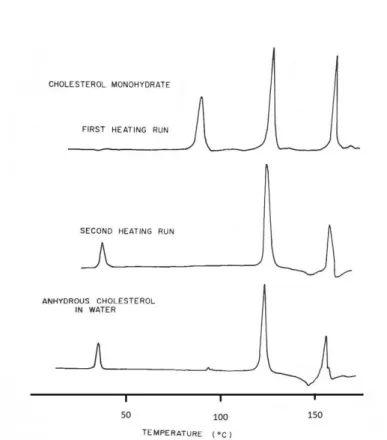
The phase behavior of cholesterol in the presence of water was studied by Loomis et al., in 197977. With the increase in temperature of anhydrous cholesterol:water mixtures, two major transitions are observed, at 39 ºC, with Ho = 0.91 0.5 kcal/mol, and at 151 ºC, with 6.59 0.25 kcal/mole (Figure 1.13. lower trace). The powder pattern X-ray diffraction of the lower temperature polymorph is similar to the phase that is formed above 39 ºC, except for differences in peak intensities. In addition, a new peak at 0.54 nm is detected for the polymorph stable above 39 ºC. Above 151 ºC, an isotropic liquid is formed, with an X-ray diffraction pattern containing two broad maxima centered at 0.6 and 2.1 nm. When the system is cooled, a hysteresis of 35 ºC was observed for the first crystallization. The lower transition also presents some hysteresis.
Chapter 1
34
Figure 1.13. - Phase transitions of cholesterol in water both in the monohydrate and anhydrous
forms. The differential scanning calorimetry heating scans where acquired at 5 ºC/min.
Adapted from ref. 77.
Models for phospholipids/cholesterol mixtures: the “condensed
complex” formation proposal
The hypothesis that cholesterol forms “complexes” with phospholipids has
been raised since the 60s, to explain the non-ideal physical properties of mixtures of Ch with phospholipids78. More recently, Mc Connell and co-workers have become defenders of these cholesterol/phospholipid aggregates that
they name “condensed complexes”, and performed a series of systematic
Introduction
35 In their studies of phospholipids mixtures containing cholesterol, in monolayers at the air-water interface, an unusual phase diagram with two upper immiscibility critical points is obtained. They interpret their data as evidencing the formation of stoichiometric aggregates between the phospholipid and Ch. A thermodynamic model assuming the formation of those aggregates that simulates the phase diagram experimental data has been developed. With this quantitative model it was possible to predict and interpret several properties of phospholipids mixtures with cholesterol, such as the Ch chemical activity and average molecular area. All these properties change rapidly near the composition for which cholesterol phospholipid stoichiometric aggregates are thought to be more abundant, which correspond to the position of the sharp cusp in between the two liquid immiscibility areas shown in Figure 1.14. The stoichiometry of the hypothetical aggregates can also be derived from this experimental point.
Chapter 1
36
McConnell and co-workers, suggest that the liquid ordered phase observed for cholesterol and some phospholipids mixtures can be constituted by stoichiometric aggregates of phospholipid and Ch78. They also defend that the
“lipid rafts”, lipid assemblies that provide laterally segregated platforms,
proposed to exist in cell membranes, and to be involved in several cellular functions such as protein and lipid trafficking and signal transduction80, can be composed of those aggregates78.
In alternative, several authors propose models for phospholipids mixtures containing Ch without making use of a special mechanism such as the formation of aggregates. Ipsen and colleagues81 propose that in the liquid phase, cholesterol tends to promote conformationally ordered acyl chains. They have developed a thermodynamic and a microscopic model that is able to explain the typical phospholipids cholesterol phase diagram. However, the formation of regular arrangements as also been advanced by some authors82. In regular distributions, the guest molecules are maximally separated in the lipid matrix, as a result of a repulsive interaction. This specific separation originates an ordered arrangement of the positions of the guest molecules in the lipid matrix. With this model, that results in cholesterol molecules being arranged in a hexagonal superlattice82, the authors are able to explain a series of breaks in the fluorescence intensity of probes incorporated in bilayers of phosphatidylcholines with Ch. A regular arrangement can be responsible for dramatic alterations both at the thermodynamic and structural level, at certain specific Ch molar fractions, and would simply result from a repulsive cholesterol-cholesterol interaction. The physical fundament proposed for the Ch/Ch repulsion is an unfavorable interaction between the bulky, rigid ring structure of sterol molecules. Huang and Feigenson have also proposed a
model, the “umbrella model”, which predicts that at certain cholesterol molar
Introduction
37 the phopholipid head-group “umbrella” to provide shielding of the nonpolar part
of cholesterol from exposure to water with further addition of cholesterol.
1.9. Long chain fatty acids
Structure and thermotropic phase behavior in water
The structure and thermotropic phase behavior of long chain fatty acids is influenced by their liotropism84. When mixed with water, the FAs can become neutral, ionized, or in a mixture of both forms depending on the surrounding media pH. As a consequence, an additional phase, the so-called fatty acid soap, has to be considered. Fatty acid soaps are the salts of mono, di, or trivalent metals with aliphatic carboxylic acids84.
Chapter 1
38
Figure 1.15. - Summary of long chain fatty acids phase behavior in excess water as a function
of pH and the state of acyl chain. FA – Fatty acid; Tm – main phase transition temperature.
Adapted from ref. 84.
Introduction
39 This is a simplified summary of long chain fatty acids thermotropic phase behavior, which is highly complex, and is also dependent on FA concentration, type of cation, concentration, and chain length84.
Induction of inverted hexagonal phases
When a neutral fatty acid is added to phosphatidylcholines, an inverted hexagonal phase is induced upon melting of the system85,86. This phenomenon occurs for FA with a chain length equal or superior to C16. This observation is rationalized in the following manner. The inverted structure is favored due to an excess in the acyl chain cross section when the FA is inserted, when compared to the choline head-group area. The formation of hexagonal phases in mixtures of ceramide, cholesterol and fatty acid is also reported by several authors87,88,41, and in our studies, refer to chapter 3, we have also observed inverted hexagonal phases when the fatty acid was added to a binary CER/Ch mixture.
Phase-behavior of mixtures of palmitic acid and cholesterol in excess
water
The thermotropic phase behaviour of some palmitic acid, Ch mixtures in excess water has been studied by Ouimet et al.89. Mixtures of palmitic acid with cholesterol, both at relative molar proportions of 50:50 and 25:75 at pH = 8.5, form fluid bilayers with a repeat distance of 4.9 nm between 25 ºC and 70 ºC.
Chapter 1
40
palmitic acid is increased above the eutectic point located between 50 and 70 mol% cholesterol, a co-existing phase rich in palmitic acid melts at 58 ºC89.
1.10. Cholesteryl Esters
Structural arrangements of cholesteryl esters
The phase behavior of cholesteryl esters is dependent on the fatty acid that is linked to the cholesterol moiety being saturated or unsaturated, and of its chain length. Cholesteryl esters display polymorphism organizing in several types of liquid crystalline states besides the solid and liquid states. In the solid state they can be arranged in three basic types of structures: bilayer, monolayer type II and monolayer type I.
Introduction
41 For example, cholesteryl myristate in the solid state forms bilayers84, Figure 1.16. An almost regular packing of alkanoate chains, with a recognizable subcell structure is observed at the center of the bilayer. The cholesteryl rings are parallel closely packed, with projecting cholesteryl tails forming the interface region between bilayers.
Figure 1.17. - Solid state organization of cholesteryl oleate, illustrating the monolayer type II arrangement. Adapted from ref.84.
Chapter 1
42
Figure 1.18. - Solid state organization of a cholesteryl nonanoate, illustrating the monolayer type
I arrangement. Adapted from ref. 84.
Cholesteryl nonanoate, cholesteryl decanoate and laurate may also be arranged in monolayers type I, Figure 1.18. Each tetracyclic system is almost perpendicular to the next. However, this form of organization is less stable than the previously shown monolayer type II.
With increasing temperature, some cholesteryl esters melt to preliminary liquid crystalline states that subsequently originate the liquid isotropic state. These liquid crystalline states are stable. In other esters, the liquid crystalline organizations can only be observed during cooling of the melted state. In this case, the liquid crystalline phases are metastable.
Introduction
43 Figure 1.19. These liquid crystalline arrangements are observed in other molecular classes and acquired relevance in technological applications.
Figure 1.19. - Schematic arrangement of smectic and cholesteric states. Left side – several examples (a-e) of smectic phases, right side– cholesteric phase. Adapted from ref. 84.
Cholesteryl oleate structure and thermotropic phase-behavior
In the work contained in this thesis, refer to chapter 4, cholesteryl oleate (ChO), was used as the model CE. This ester was elected, because it corresponds to the most abundant cholesteryl ester found in SC33.
Chapter 1
44
In the literature concerning this particular ester, X-ray data relative to the long spacing reports d = 1.88 nm for the solid monolayer type II crystal, and d = 3.60 nm for the smectic state90.
Solubility of cholesteryl esters in amphiphilic lipids
The solubility of CEs in phosphatidylcholine bilayers is very low, only occurring in the liquid crystalline state92, and in the presence of cholesterol this solubility is further reduced93. In sphingomyelin bilayers, the solubility of cholesteryl esters is also very low, and decreases by an order of magnitude, less than 0.1 mol % in the presence of 50 mol % cholesterol94. This behaviour contrasts markedly with Ch, which is able to incorporate in lipid bilayers up to 2:1 molar ratio.
The residual miscibility of CEs in the amphiphilic lipids studied, does not exclude the evaluation of their solubility in CER containing mixtures. In fact, there are reports in the literature of high miscibility of CEs in monomolecular films of a phosphatidylcholine95.
The studies presented in the thesis involve the use of experimental techniques that are shortly described in the next sections.
1.11. Powder pattern X-ray diffraction of lipid-water systems
Introduction
45 Hydrated lipid systems, produce a diffraction pattern characterized by several Bragg diffractions at small angles, together with a set of reflections in the wide angle region. These diffraction data, although not permitting a precise atomic level structural characterization, provide important structural information.
The reflections observed at small angles, in our set-up ranging from 0.1 to 0.390 nm-1, permit the deduction of the type of long range organization of the lipid aggregate. These reflections are attempted to fit to several equations, and the symmetry of the phase, whether lamellar, hexagonal or cubic among others is derived. Subsequently, from the parameters of the equation that fitted the data, the dimensions of the lattice are obtained such as for example the lamellar repeat distance in lipid bilayers. The wide angle reflections, in our set-up ranging from 1.78 to 3.05 nm-1, provide information about the acyl chain packing mode (refer to section 1.5). In lipid bilayers in the Lα state, a single broad reflection at 4.5 Å is observed. This reflection indicates a hexagonal lattice. When a single sharp reflection located at 4.2 Å is detected, the bilayer is in the Lβ state, with acyl chains packed in a hexagonal lattice with a
comparatively smaller inter-chain distance. For the LC bilayers several reflections are observed, the number and pattern being determined by the crystalline structure. It is important to refer that for bilayers in the rigid states Lβ and Lc, the area per head-group can also be derived from this wide angle lattice.
Chapter 1
46
Figure 1.20. - Assembly of successive powder pattern X-ray diffraction profiles along increasing temperatures. The diffraction patterns were obtained at small angles, panel A, and wide angles, panel B, every two minutes, along increasing temperatures at a rate of 1 ºC/min, for a sample composed of C16-Cer:Ch:PalmiticAcid 44:38:18 molar ratio in excess water at pH = 4.0.
In the setup used in our studies, at the Soft Condensed Matter beamline A2 of Hasylab, it is still possible to simultaneously detect the small and the wide angle regions, which in the case of samples of amphiphilic lipids, is essential for both the determination of the type of long range organization of the lipid aggregate and the correspondent acyl chain packing.
1.12.
13C-magic angle spinning-nuclear magnetic resonance
applied to lipid bilayers
Probing cholesteryl ester environment
13C NMR can be applied to answer a question as how cholesteryl ester,
Introduction
47 If CEs molecules are positioned in the bilayers exposing the carbonyl group to water, the folded interdigitated parallel hypothesis, the formation of hydrogen bonds with water at the surface of the bilayer, would result in a downfield shift of the 13C carbonyl resonance peak. In this manner 13C NMR can be used as a direct method to study the localization of carbonyl containing lipids in bilayers, taking advantage of a chemical shift change originated by a different surrounding environment. The localization of CEs in two different environments, one inserted and other coexisting outside the bilayer can be observed by the detection of two distinct 13C carbonyl peaks in the spectra, refer to Figure 1.21., at different positions97.
Figure 1.21. - 13C MAS NMR spectra (carbonyl region) of phosphatidylcholine bilayers with 1% 13C carbonyl cholesteryl oleate (ChO).The peaks at 171.85 ppm and 171.48 ppm correspond
respectively to ChO inserted in the bilayer and coexisting segregated in oily drops. Adapted from ref.98.
Chapter 1
48
resolution. Nevertheless, this imposes a limitation to the type of lipid mixtures able to be studied, narrowing its scope to high curvature lipid membranes. This might not be appropriate for certain purposes. In fact, a high curvature imposes a different acyl chain packing as compared with the nearly flat biologic lipid membranes. Solid state NMR provides high resolution spectra of turbid lipid dispersions98. The study of lipid dispersions of all types is made possible, including multilamellar lipid bilayers, MLVs, the nearly flat bilayers formed spontaneously by amphiphilic lipids. It is also possible to study mixtures of CER, cholesterol and fatty acid, with or without cholesteryl oleate, which are composed of solid lumps floating in the buffer.
Solid State NMR techniques
The conventional NMR spectra of solid samples display very broad featureless lines. This effect has its origin mainly in dipole-dipole interactions and chemical shift anisotropy99. These phenomena are also present in liquid samples, but as the molecules are tumbling rapidly, those directional effects average to zero. High resolution spectra in solid samples can be obtained, by associating several techniques, including a variety of radiofrequency irradiation patterns and magic angle spinning (MAS).
Decoupling procedures are applied to minimized dipole-dipole interactions. Continuous irradiation of one nucleus effectively decouples it from the other. Following this treatment the NMR spectrum still present broadening, which is caused by chemical shift anisotropy.
It can be deducted mathematically, that, if during the course of an NMR experiment, a sample is put to spin, and bended at the specific precise angle of 54.7º, the so called magic angle, the chemical shift anisotropy of the signals is eliminated. The result of this procedure is a substantial enhancement of spectral resolution.
Introduction
49 which the repeatedly transference of polarization from a more abundant species, generally protons, to the less abundant nuclei is performed. In this manner, the sensitivity problem associated with solid state NMR, which becomes more critical for natural abundance 13C NMR can be overcome.
1.13. References
(1) Menon, G., Ghadially, R. (1997). Morphology of lipid alterations in the epidermis: a review. Microscop. Res. and Techniq., 37, 180-192.
(2) Wertz, P.W. (2000). Lipids and barrier function of the skin. Acta Derm Venereol. Supp, 208, 7-11.
(3) Ohvo-Rekila, H., Ramstedt, B., Leppimaki, P., Slotte, J.P. (2002). Cholesterol interactions with phospholipids in membranes. Progr. Lipid Res., 41, 66-97.
(4) Huang, J.H., Buboltz, J.T., Feigenson, G.W. (1999). Maximum solubility of cholesterol in phosphatidylcholine and phosphatidylethanolamine bilayers. Biochim. Biophys. Acta, 1417, 89-100.
(5) Kamp, F., Hamilton, J.A. (1992). pH gradients across phospholipids membranes caused by fast flip-flop of un-ionized fatty acids. Proc. Natl. Acad. Sci USA, 89, 11367-11370.
(6) Kligman, A.M. (1983). A biological brief on percutaneous absorption. Drug Develop. and Indust. Pharmacy, 9, 521-560.
Chapter 1
50
(8) Feingold, K., Mao-Qiang, M., Menon, G.K., Cho, S.S., Brown, B.E., Elias P.M. (1990). Cholesterol synthesis is required for cutaneous barrier function in mice. J Clin. Invest., 86, 1738-1745.
(9) Holleran, W.M., Man, M.Q., Gao, W.N., Menun, G.K., Elias, P.M., Feingold, K.R. (1991). Sphingolipids are required for mammalian epidermal barrier function. Inhibition of sphingolipid synthesis delays barrier recovery after acute perturbation. J. Clin. Invest., 88, 1338-1345.
(10) Hannun, Y.A., Obeid, L.M. (1995). Ceramide: an intracellular signal for apoptosis. Trends Biol. Science, 20, 73-77.
(11) Goni, F.M., Alonso, A. (2006). Biophysics of sphingolipids I. Membrane properties of sphingosine, ceramides and other simple sphingolipids. Biochim. Biophys. Acta, 1758, 1902-1921.
(12) Kolesnick, R.N., Goni, F.M., Alonso, A. (2000). Compartmentalization of ceramide signaling: physical foundations and biological effects. J. Cell Physiol., 184, 285-300.
(13) Stancevic, B., Kolesnick, R. (2010). Ceramide-rich platforms in transmembrane signaling. FEBS Letters, 584, 1728-1740.
(14) Holopainen, J.M., Angelova, M.I., Kinninen, P.K.J. (2000). Vectorial budding of vesicles by asymmetrical enzymatic formation of ceramide in giant liposomes. Biophys. J., 78, 830-838.
(15) Menon, G.K. (2002). New insights into skin structure: scratching the surface. Adv. Drug Deliv. Rev., 54, S3-S17.
(16) Hickman, J., Roberts, L., Larson, A. (2001). Integrated principles of zoology. 11th edition. McGrawHill, London.
Introduction
51 (18) Harris, M.A. (1999). The Skin. Permachart Quick Reference Guide. Papertech, Ontario.
(19) Downing, D.T. (1992). Lipid and protein structures in the permeability barrier of mammalian epidermis. J. Lipid Res., 33, 301-313.
(20) Swartzendruber D.C., Wertz, P.W., Madison, K.C., Downing, D.T. (1987). Evidence that the corneocyte has a chemically bound lipid envelope. J. Invest. Dermatol., 88, 709-713.
(21) Wertz, P.W., Downing, D.T. (1987). Covalently bound omega-hydroxyacylsphingosine in the stratum corneum. Biochim. Biophys., Acta, 917, 108-111.
(22) Behne, M.J., Meyer, J., Hanson, K.M., Barry, N.P., Murata, S., Crumrine, D., Clegg, R.W., Gratton, E., Holleran, W.M., Elias, P.M., Mauro, T.M. (2002). NHE1 regulates the stratum corneum permeability barrier homeostasis: microenvironment acidification assessed with FLIM. J. Biol. Chem., 277, 47399-47406.
(23) Wertz, P., Norlén, L. (2004). “Confidence intervals” for the “true” lipid composition of the human skin barrier? In Skin, Hair and Nails. Forslin, B., Lindberg, M., Eds., Marcel Dekker, New York, pp. 85-106.
(24) Norlen, L., Nicander, I., Lundh Rozell, L.B., Ullmar, S., Forstind, B. (1999). Inter and intra individual differences in human stratum corneum lipid content related to physical parameters of skin barrier function in vivo. J. Invest. Dermatol., 112, 72-77.
(25) Madison, K.C. (2003). Barrier function of the skin: “La raison d’être” of
epidermis. J. Invest. Dermatol., 121, 231-241.
Chapter 1
52
(27) Kuempel, D., Swartzendruber, D.C., Squier, C.A., Wertz, P.W. (1998). In vitro reconstitution of stratum corneum lipid lamellae. Biochim. Biophys, Acta, 1372, 135-140.
(28) White, S.H., Mirejovsky, D., King, G.I. (1988). Structure of lamellar lipid domains and corneocyte envelopes of murine stratum corneum. An X-ray diffraction study. Biochemistry, 27, 3725-3732.
(29) Bouwstra, J.A., Gooris, G.S., van der Spek, J.A., Bras, W. (1991). Structural investigations of human stratum corneum by small-angle X-ray scattering. J. Invest. Dematol., 6, 1005-1012.
(30) Bouwstra, J.A., Gooris, G.S., Cheng, K., Weerheim, A., Bras, W., Ponec, M. (1996). Phase behavior of isolated skin lipids. J. Lipid Res., 37, 999-1011.
(31) Wertz, P.W., Madison, K.C., Downing, D.T. (1989). Covalently bound lipids of human stratum corneum. J. Invest. Dermat., 92, 109-111.
(32) Kalinin, A.E., Kajava, A.V., Steinert, P.M. (2002). Epithelial barrier function: assembly and structural features of the cornified cell envelope. BioEssays, 24, 789-800.
(33) Wertz, P.W., Schwartzendruber, D.C., Madison, K.C., Downing, D.T. (1987). Composition and morphology of epidermal cyst lipids. J. Invest. Dermatol., 89, 419-425.
(34) Pappinen, S., Hermansson, M., Kuntsche, J., Somerharjn, P., Wertz, P., Urtti, A., Suhonen, M. (2008). Comparison of rat epidermal keratinocyte organotypic culture (ROC) with intact human skin: lipid composition and thermal phase behavior of the stratum corneum. Biochim. Biophys. Acta, 1778, 824-834.