Received 8 Jan., 2014 Accepted 27 Jan., 2014 (006267)
1 Department of Food Technology, Faculty of Food Engineering, State University of Campinas – UNICAMP, Campinas, SP, Brazil, e-mail: [email protected] 2 BRF S.A., São Paulo, SP, Brazil
3 University of São Judas Tadeu, São Paulo, SP, Brazil *Corresponding author
Effects of micronized sodium chloride on the sensory profile and
consumer acceptance of turkey ham with reduced sodium content
Maria Teresa Esteves Lopes GALVÃO1*, Debora Braga MOURA2, Andrea Carla Silva BARRETTO3, Marise Aparecida Rodrigues POLLONIO1
1 Introduction
Sodium consumption, linked primarily to sodium chloride content in foods, has been criticized for impacting human health over the past decades and has been correlated with the increasing incidence of hypertension. Meat products are considered to be one of the main contributors to this high sodium consumption. According to Katz & Williams (2010), approximately 80% of the average consumer’s sodium intake comes from processed meat products.
Reducing sodium in meat products is challenging. This compound is the most common ingredient used in processing and has many functions in addition to flavoring (Toldra & Reig, 2011). Sodium chloride is responsible for extracting myofibrillar proteins and for increasing the ionic strength in the meat matrix improving various functional properties, including emulsifying capacity, gel formation, water binding, and fat binding (Horita et al., 2011).
Many studies in the literature have investigated the reduction of sodium in meat products (Guàrdia et al., 2008; Jimènez-Colmenero et al., 2010) and the substitution of sodium chloride for other salts, such as potassium chloride. There are fewer reports on how the reduction of sodium chloride alone impacts a product´s sensory characteristics and its acceptance by consumers (Lucas et al., 2011). Some recent studies have indicated that a simple reduction in the size of the sodium chloride particles may provide a way of reducing overall sodium
content in industrial formulations. Smaller sodium chloride particles can promote a higher perceived degree of saltiness because they dissolve more rapidly in the mouth. Kilcast & Angus (2007) evaluated the effects of different sizes and varieties of sodium crystals in potato chips on trained panelists’ perception using time-intensity methodology and observed that smaller crystals led to a faster, but less intense, perception of saltiness in comparison to that of larger crystals. However, no similar studies have been reported evaluating the substitution of sodium chloride for micronized salts.
Sensory techniques, such as CATA (check-all-that-apply) and flash profiling, are relatively new methods for conducting consumer studies and have been used to study jams (Dairou & Sieffermann, 2002), powdered juices, (Ares et al., 2010b), iced teas (Veinand et al., 2011), and milk desserts (Ares et al., 2010a). Flash profile is a rapid sensory profiling technique designed to meet industrial needs by combining free-choice profiling with ranking. CATA has been introduced in consumer studies to determine which sensory attributes consumers perceive in a product. Given that both techniques are quite new, there are currently no reports available on their use in meat products.
The present study aims to identify the impact of salt reduction and its substitution for micronized salt on the sodium chloride content and sensory characteristics of turkey ham and to evaluate consumer acceptance for these modifications.
Abstract
The impact of sodium chloride reduction and its substitution for micronized salt on consumer acceptance of turkey ham was investigated. Five formulations - F1 (control - 2.0% NaCl), F2 (1.7% NaCl), F3 (1.4% NaCl), F4 (1.7% micronized NaCl), and F5 (1.4% micronized NaCl) – were evaluated with respect to sodium chloride content and by consumers using a nine-point hedonic scale for overall acceptability and CATA (check-all-that-apply) using 24 sensory descriptors. Trained panelists characterized the products using the flash profiling technique. Reductions in the salt content by up to 30% did not affect the overall acceptability of the samples by the consumers. However, the consumers characterized the formulations with lower salt content as “less salty and less seasoned” in comparison to the contents in the control. Products containing 1.7% NaCl were considered very similar to the control. The results obtained indicate that it is possible to reduce NaCl content by 30% without affecting consumer acceptance of the product. The use of micronized salt did not affect the sensory characteristics when compared with those of formulations containing the same level of sodium chloride indicating that micronized salt does not influence perception of salt.
2.3 Sensory evaluation
The sensory protocol was previously approved by the Ethics in Research Committee of the University of Campinas, SP, Brazil under the number 1128/2011. All of the products were submitted to an acceptance test (overall acceptability) according to the method of Stone & Sidel (2004) using 77 consumers of sliced-meat products as test subjects and a 9-point hedonic scale (1=extremely disliked; 5=neither liked nor disliked; 9=extremely liked). The participants were offered water and a cracker between samples. After evaluating each product, the consumers were asked to select the words that expressed their opinion about the product they had tasted from a list of 24 sensory descriptors, following the protocol proposed by Ares et al. (2010a). The terms in the list were collected from previous studies in which consumers were asked to express their opinions about the same type of product using their own words. These terms, classified as descriptors of appearance, flavor, or texture, are presented in Table 2.
Flash profiling was performed by six panelists trained in profiling other food categories, according to the procedures recommended by Dairou & Siefferman (2002). A total of five sessions were conducted. The first and second were individual sessions and were intended to generate the list of individual attributes. The remaining sessions were used as opportunities
2 Materials and methods
2.1 Sample Preparation
Five turkey ham formulations were prepared using different levels of sodium content, as shown in Table 1.
The micronized salt was obtained from Romani company (5% retention on a mesh 20 sieve, Brazil). Ninety percent of the skinless turkey breast meat was ground through a 35mm disc, and 10% was thawed and ground through a 10 mm disc. The other ingredients, with the exception of the cassava starch and the isolated soy protein, were added to 60% of the water to produce the brine. The meat and the brine mixture were homogenized for 20 min under vacuum, after which the remaining ingredients were added and mixed for an additional 10 min. Approximately 0.8 kg of the product was stuffed into tubular casings (3.5´´ diameter) and cooked using a steam oven until it reached an internal temperature of 74 °C. After cooling in an ice bath, the products were stored at 4 °C for two weeks before the beginning the analysis.
2.2 Salt and sodium content analysis
The salt and sodium content was determined using the AOAC Official Method (Association of Official Analytical Chemists, 2007).
Table 1. Turkey ham formulations containing different amounts of refined or micronized salt (%w/w).
Ingredients F1 F2 F3 F4 F5
Turkey breast 70.0 70.0 70.0 70.0 70.0
Water 23.6 23.8 24.2 23.8 24.2
Refined salt 2.0 1.7 1.4 0 0
Micronized salt 0 0 0 1.7 1.4
Cassava starch 2.0 2.0 2.0 2.0 2.0
Isolated soy protein 1.0 1.0 1.0 1.0 1.0
Sugar 0.5 0.5 0.5 0.5 0.5
Seasonings 0.01 0.01 0.01 0.01 0.01
Phosphate 0.35 0.35 0.35 0.35 0.35
Carrageenan 0.3 0.30 0.30 0.30 0.30
Monosodium glutamate 0.20 0.20 0.20 0.20 0.20
Sodium erythorbate 0.05 0.05 0.05 0.05 0.05
Sodium nitrite 0.02 0.02 0.02 0.02 0.02
Cochineal carmine dye 0.01 0.01 0.01 0.01 0.01
Table 2. List of terms used for CATA survey.
Appearance Flavor Texture
• Healthy appearance • Ugly appearance • Beautiful appearance • Clear color
• Dark color
• Salt in the right amount • Bland taste
• Flavor
• Seasonings in the right amount • Turkey meat taste in the right amount • Strong turkey meatt flavor
• Strong overall flavor • Salty
• Strong seasoning • Weak turkey meatt flavor • Weak overall flavor • Without salt • Without seasonings • Bad flavor
• Tenderness • Juiciness • Easy mastication • Dry
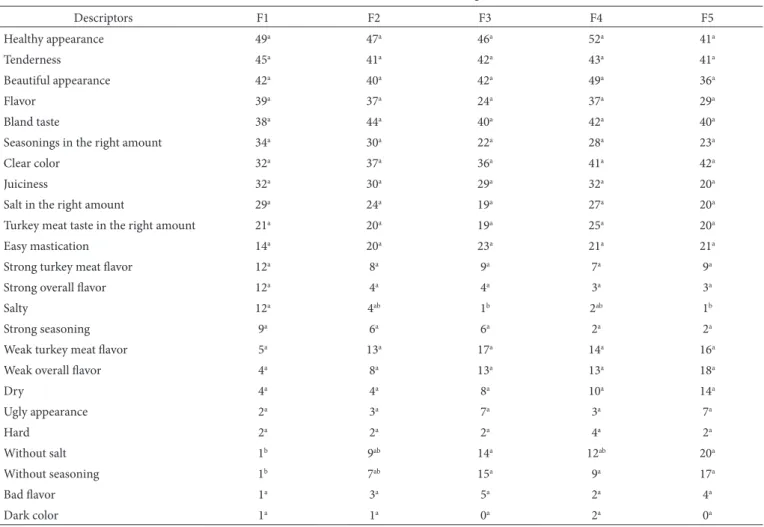
The number of times the descriptor “without salt” was selected for the formulations with 1.4% NaCl was statistically greater compared to that of the control. The descriptor “salty” was selected less frequently for the formulations containing 1.4% refined or micronized NaCl than the control. Both formulations with 1.4% salt and that with 1.7% micronized salt were statistically more frequently described as “without seasoning” than the control.
The list of terms generated by each subject in the flash profiling test is presented in Table 6.
The number of sensory descriptors generated by each subject varied from two to nine. Altogether, the panelists selected 19 terms related to flavor and texture. The only common sensory descriptor found was “salty taste”.
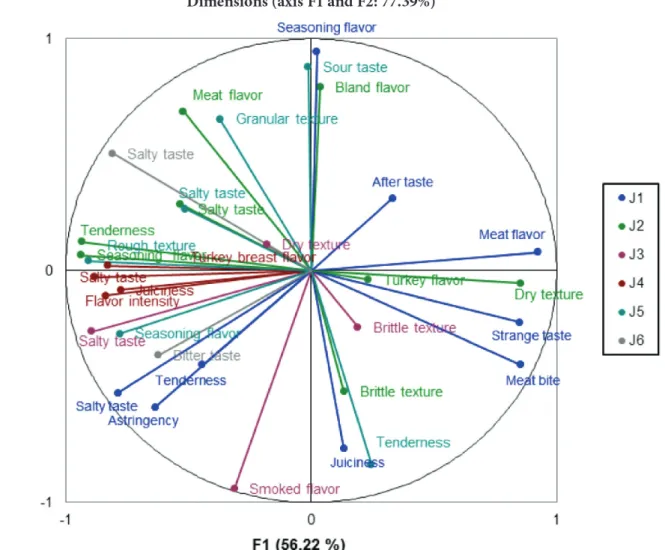
The first two principal components accounted for 77.39% of the total variability among the samples. The product positions and their sensory characterizations are presented in Figures 2 and 3, respectively.
The GPA analysis led to the formation of three groups. The first contained the control sample, F1 (2% salt), and F2 (1.7% salt). F3 (1.4% salt) and F4 (1.7% micronized salt) generated a second group, whereas group 3 consisted of only F5 (1.4% micronized salt). Based on this analysis, the sample with 1.7% salt may be considered the most similar to the control. Analysis of the sensory descriptors indicates that both F1 and F2 are characterized by their salty taste and seasonings, whereas F3 and to rank the products in triplicate. The last three sessions were
conducted at different times, and each lasted less than one hour.
2.4 Statistical analysis
The proximate composition data were statistically analyzed using the Tukey test at a significance level of 5%. The acceptance data were subjected to analysis of variance (ANOVA) at a significance level of 5%, and the data from CATA questions were analyzed using frequency of mentions. To evaluate whether the consumers perceived significant differences among the products, a Chi-Square test for k proportions was conducted
using the XLSTAT®2012 v.05 software. The sensory profile data
from the flash profiling were analyzed by Generalized Procrustes
Analysis (GPA) using the XLSTAT®2012 v.05 software.
3 Results and discussion
Data on sodium chloride (salt) content are presented in Table 3.
The differences in the sodium content added and the sodium content analyzed were perceived as more acute in the formulations with micronized salts (F4 and F5). As a result, the effective reductions in the sodium content in samples F2, F3, F4, and F5 in comparison to the content of the control were 19%, 34%, 23%, and 42%, respectively. These significant sodium content decrease was expected. However, there were significant differences (p<0.05) between the formulations with the same sodium content added (e.g., F2 and F4 or F3 and F5), likely due to differences in the moisture content (i.e., hygroscopicity) between the two salts.
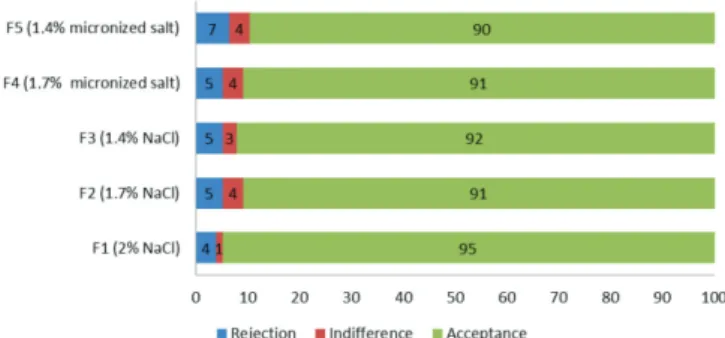
The results of the acceptability test are shown in Table 4. No significant differences were detected among the products with respect to overall acceptability; the consumers moderately liked all of the formulations. Figure 1 illustrates the acceptance, rejection, and indifference levels for the five products studied revealing no relevant differences among the products for these levels. All products had >90% acceptance.
The results from CATA are presented in Table 5. Of the 24 sensory descriptors given to the consumers to characterize the formulations, only three were found to differ significantly among the formulations: without salt, salty, and without seasoning.
Table 3. Sodium chloride content and sodium content of the formulations.
F1 F2 F3 F4 F5
Sodium Chloride (%) 1.95a 1.58b 1.28c 1.51d 1.14e
Sodium (mg/100 g) 1048a 915b 740c 879b 761c
a, b, c, d, e - Measurements in the same row with matching letters did not differ significantly at p < 0,05 (Tukey’s test). F1-2.0% NaCl; F2-1.7% NaCl; F3-1.4% NaCl; F4-1.7% micronized NaCl; F5-1.4% micronized NaCl.
Table 4. Degree of overall acceptability and standard deviation of the formulations.
F1 F2 F3 F4 F5
Overall acceptability 7.34a 7.23a 7.18a 7.32a 7.04a
Standard deviation 1.26 1.56 1.44 1.42 1.46
a - Measurements in the same row with matching letters did not differ significantly at p < 0.05 (Tukey´s test). F1-2% NaCl; F2-1.7% NaCl; F3-1.4% NaCl; F4-1.7% micronized NaCl; F5-1.4% micronized NaCl.
F4, positioned on the opposite quadrant, exhibited a different flavor and texture profile. These products were characterized according to their blandness or meat taste and to the presence of an aftertaste. F5 was characterized primarily according to texture, with negative descriptors such as “dry” and “brittle.”
4 Conclusion
The substitution of refined salt for the same weight of micronized salt, (same amount) –reduced the salt content slightly but did not promote significant changes in the sodium content.
With respect to the sensory analysis, salt reductions by up to 30% did not influence the consumer acceptance of products despite the fact that the consumers charcterized the formulations tested as less salty and less seasoned than the control. The use of micronized salt to substitute table salt did not increase saltiness perception. Sensory profiling revealed that salt reductions resulted in products that were perceived as less salty and less seasoned. High levels of salt reduction in products containing micronized salt also affected texture characteristics. Products containing low levels of salt were considered to be dry and brittle. Color was not affected by salt reduction.
Figure 2. Mean products plotted on the first two principal axes. F1-2% NaCl; F2-1.7% NaCl; F3-1.4% NaCl; F4-1.7% micronized NaCl; F5-1.4% micronized NaCl.
Table 5. Total counts of CATA attributes used to characterize the formulations containing either reduced sodium or micronized salt.
Descriptors F1 F2 F3 F4 F5
Healthy appearance 49a 47a 46a 52a 41a
Tenderness 45a 41a 42a 43a 41a
Beautiful appearance 42a 40a 42a 49a 36a
Flavor 39a 37a 24a 37a 29a
Bland taste 38a 44a 40a 42a 40a
Seasonings in the right amount 34a 30a 22a 28a 23a
Clear color 32a 37a 36a 41a 42a
Juiciness 32a 30a 29a 32a 20a
Salt in the right amount 29a 24a 19a 27a 20a
Turkey meat taste in the right amount 21a 20a 19a 25a 20a
Easy mastication 14a 20a 23a 21a 21a
Strong turkey meat flavor 12a 8a 9a 7a 9a
Strong overall flavor 12a 4a 4a 3a 3a
Salty 12a 4ab 1b 2ab 1b
Strong seasoning 9a 6a 6a 2a 2a
Weak turkey meat flavor 5a 13a 17a 14a 16a
Weak overall flavor 4a 8a 13a 13a 18a
Dry 4a 4a 8a 10a 14a
Ugly appearance 2a 3a 7a 3a 7a
Hard 2a 2a 2a 4a 2a
Without salt 1b 9ab 14a 12ab 20a
Without seasoning 1b 7ab 15a 9a 17a
Bad flavor 1a 3a 5a 2a 4a
Dark color 1a 1a 0a 2a 0a
Association of Official Analytical Chemists. (2007). Official Methods of Analysis (18th ed.) Washington: AOAC.
Dairou, V., & Sieffermann, J. M. (2002). Comparison of 14 jams characterized by conventional profile and a quick original method, the Flash profile. Journal of Food Science, 67(2), 826-834. http:// dx.doi.org/10.1111/j.1365-2621.2002.tb10685.x
Guàrdia, M. D., Guerrero, L., Gelabert, J., Gou, P., & Arnau, J. (2008). Sensory characterization and consumer acceptability of small calibre References
Ares, G., Barreiro, C., Deliza, R., Gimènez, A., & Gámbaro, A. (2010a). Application of check-all-that-apply questions to the development of chocolate milk desserts. Journal of Sensory Studies, 25(1), 67-86. Ares, G., Deliza, R., Barreiro, C., Gimènez, A., & Gambarro, A. (2010b).
Comparison of two sensory profiling techniques based on consumer perception. Food Quality and Preference, 21(4), 417-426. http:// dx.doi.org/10.1016/j.foodqual.2009.10.006
Figure 3. Terms plotted for each panelist from flash profiling using GPA analysis.
Table 6. Descriptors generated by each subject in the flash profiling test.
Subject 1 Subject 2 Subject 3 Subject 4 Subject 5 Subject 6
Salty taste Meat flavor Strange taste Aftertaste Seasoning flavor
Juiciness Meat bite Astringency
Tenderness
Salty taste Meat flavor Seasoning flavor
Turkey flavor Bland flavor Brittle texture
Dry texture Tenderness
Salty taste Smoked flavor
Dry texture Brittle texture
Salty taste Flavor intensity
Juiciness
Turkey breast flavor
Salty taste Seasoning flavor
Sour taste Tenderness Rough texture Granular texture
Lucas, L., Riddell, L., Liem, G., Whitelock, S., & Keast, R. (2011). The influence of sodium on liking and consumption of salty food. Journal of Food Science, 76(1), S72-S76. http://dx.doi.org/10.1111/j.1750-3841.2010.01939.x
Stone, H., & Sidel, J. L. (2004). Affective Testing. In H. Stone & J. L. Sidel (Eds.), Sensory evaluation practices (chapter 7, pp. 247-277). San Diego: Elsevier Academic Press. http://dx.doi.org/10.1016/ B978-012672690-9/50011-1
Toldra, F., & Reig, M. (2011). Innovations for healthier processed meats.
Trends in Food Science and Technology, 22(2011), 517-522. http:// dx.doi.org/10.1016/j.tifs.2011.08.007
Veinand, B., Godefroy, C., Adam, C., & Delarue, J. (2011). Highlight of important product characteristics for consumers: comparison of three sensory descriptive methods performed by consumers. Food Quality and Preference, 22(5), 474-485. http://dx.doi.org/10.1016/j. foodqual.2011.02.011
fermented sausage with 50% substitution of NaCl by mixtures of KCl and potassium lactate. Meat Science, 8(4), 1225-1230. http:// dx.doi.org/10.1016/j.meatsci.2008.05.031
Horita, C. N., Morgano, M. A., Celeghini, R. M. S., & Pollonio, M. A. R. (2011). Physico-chemical and sensory properties of reduced-fat mortadella prepared with blends of calcium, magnesium and potassium chloride as partial substitutes for sodium chloride.
Meat Science, 89(4), 426-433. http://dx.doi.org/10.1016/j. meatsci.2011.05.010
Jimènez-Colmenero, F., Cofrades, F., Lópes-Lópes, I., Ruiz-Capillas, C., Pintado, T., & Solas, M. T. (2010). Technological and sensory characteristics of reduced/low fat, low-salt frankfurters as affected by the addition of kinjac and seaweed. Meat Science, 84(3), 356-363. http://dx.doi.org/10.1016/j.meatsci.2009.09.002
Katz, B., & Williams, L. A. (2010). Salt reduction: gains momentum.
Food Technology, 64(5), 24-32.