MONITORING THE WHEAT, CORN AND COTTON AREAS IN AN EASTERN
MEDITERRANEAN AGRICULTURAL BASIN BETWEEN 2007 AND 2013
O. Satir a, O. Yeler b
a YYU, Agriculture Faculty, 65080 Tuşba Van, Turkey - osatir@yyu.edu.tr b YYU, Muradiye Vocational School, 65080 Tuşba Van, Turkey – oyeler@yyu.edu.tr
KEY WORDS: Eastern Mediterranean Agricultural Basin, Cukurova Region, Object Based Classification, Crop Pattern Mapping and Monitoring.
ABSTRACT:
Detecting the seasonal agricultural crop pattern accurately is a vital part of the agricultural planning. In this extent, Cukurova Region that is located in Eastern Mediterranean Region of Turkey was evaluated on agricultural landscape pattern. This region is the most productive agricultural region of Turkey also crop variability and yield are higher than many parts of the world. The main agricultural part of the area is called Lower Seyhan Plane (LSP) and it has been formed by the Seyhan, Ceyhan and Berdan rivers. The purpose of the study was to define the wheat, corn and cotton crop pattern using multi-temporal Landsat satellite images and object based classification approach for 2007 and 2013 cropping years. Three main crop’s areal difference were evaluated and changes were monitored between 2007 and 2013. The accuracy of the classifications were obtained by the spatial kappa statistics. Overall kappa accuracy was derived to be 0.9. Classification results were shown that wheat areas were decreased 35% and corn and cotton areas were increased 49% and 69% respectively. Particularly, government subventions and market demands were impacted cropping pattern in the region significantly. In addition, multi-temporal Landsat images and object based classification were a great combination to define regional agricultural crop pattern with very good accuracy (>90%).
1. INTRODUCTION
Many field crops have various growing cycle in a season and mapping the agricultural fields are not an easy process because of temporal variability (Chen et al. 2008). Regional or large scale agricultural basins like study area, the Nile delta or Californian irrigated farmlands are requires remote sensing for monitoring studies due to energy, cost and time saving capability.
Supervised classification techniques are applied to satellite images or aerial photos frequently in mapping stage in agricultural areas. However, supervised object based classification approach is outshined in the literature recently (Şatır and Berberoğlu, 2012). Object based classification provides more accurate results especially in agricultural or urban areas because of pixel grouping based on spectral, textural and shape similarities of the pixels (Blaschke 2010).
Agricultural mapping accuracy depends on the RS data type, classification scheme, available classifier and training samples (Cingolani et al. 2004). Image classifications with coarse spatial resolution data have some uncertainties on mixed pixel effects. For example; if a pixel size is 1 X 1 km, there should be more than 2 different land use/cover (LUC) in one pixel and traditional hard classification techniques are not effective in this condition. However, fuzzy techniques can be used to map mixture degree of each pixel (Ozdogan and Woodcock 2006).
Mixed pixel effects are not a big problem while used a high resolution remotely sensed data. On the other hand, a classified
high spatial resolution data contains small misclassified pixels, particularly in agricultural areas, and a generalization or segmentation process is required to increase accuracy (Şatır and Berberoğlu 2012). Also some comparison researches between pixel and object based classifications were proved advantages of object based techniques (Yuan and Bauer 2006).
In our study, agricultural crop pattern of the Cukurova Region was monitored using multi-temporal Landsat dataset and object based classification approach. Classification accuracy and crop pattern change were tested using ground truth data and kappa statistic. Also ability of the object based classification on crop monitoring was investigated.
2. STUDY AREA
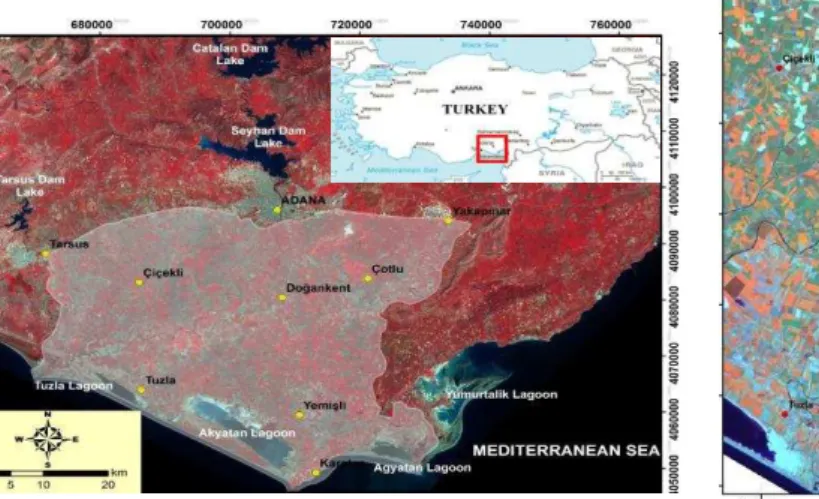
Lower Seyhan Plane study area is located in Southern Turkey. The area is covered 217000 ha and almost 80% of the area is arable lands (Figure 1). Seyhan, Ceyhan and Berdan rivers were formed to LSP carrying sediments from upper basin. More than one crop can be grown in one season in the same field because of ideal climate, soil type and channel irrigation systems. Dominant crops are wheat in winter time, and corn and cotton in summer time in a season. Additionally region is very important on citrus growth. Almost 10% agricultural production of Turkey is provided from this region. This rate can be changed according to the crop types such as 29% of cotton production of Turkey was obtained from here in 1991 (Yurdakul 1991).
Figure 1. Location of the study area
3. DATASET
Multi-temporal Landsat TM/ETM satellite dataset and parcel based ground truth data were used in this study.
3.1 Landsat Dataset
Landsat imageries have a great potential for monitoring and mapping agricultural crops and forest because of their large time series database, available with a spatial resolution of 30 m and spectral (Visible (VIS), Near-Infrared (NIR), Shortwave-Infrared (SWIR) and Thermal-Shortwave-Infrared (TIR)) coverage (Özyavuz et al. 2011). Landsat imageries were selected according to the crop rotation and growing period of the crops for mapping crop pattern. Winter and summer crops were mapped separately (Table 1).
Date Sensor Specific Purpose 29th March
2007
Landsat ETM
Mapping the wheat area (the greenest time of the wheat) 25th June
2007
Landsat ETM
Corn area mapping (The greenest time of the corn)
27th July 2007
Landsat TM
Cotton area mapping (The greenest time of the cotton) 14th April
2013
Landsat ETM
Mapping the wheat area (the greenest time of the wheat) 3rd July
2013
Landsat ETM
Corn area mapping (The greenest time of the corn)
27th July 2013
Landsat ETM
Cotton area mapping (The greenest time of the cotton)
Table 1. Multi-temporal Landsat dataset used in this study
3.2 Ground Truth Data
Classification of two time periods needs validation and field based Ground Truth (GT) dataset is necessary in order to test agricultural crop pattern classification accuracy. Long term crop pattern data for 2007 and 2013 cropping seasons was derived from Gazi irrigation district management office. Crop pattern data was created in field scale regularly to calculate the water price, so this data is recorded parcel based. Almost 169 GT parcels were used for validation (Figure 2).
Figure 2. GT parcels distribution
4. METHODS
There three part of the study; object based classification, kappa accuracy assessments and wheat, corn and cotton crop pattern change detections.
4.1 Object Based Classification
Many complex land covers exhibit similar spectral characteristics making separation in feature space by simple per-pixel classifiers difficult, leading to inaccurate classification. Therefore, an object-based classification is a potential solution for the classification of such regions. The specific benefits are an increase in accuracy, a decrease in classification time and that it helps to eliminate within-field spectral mixing (Berberoglu et al., 2000; Liu and Xia, 2010).
Basically, there are three steps in object based classification as segmentation, classification and per field integration. An image was divided segments dependent on pixel spectral similarities, structure of the image and surface texture characteristics. This progress is up to variables like scaling factor, smoothness vs. compactness and shape factors. Ideal variables can be found experimentally using a subset area or all study area (Şatır and Berberoğlu 2012).
4.2 Kappa Statistic
The error matrix approach is the one most widely used in accuracy assessment (Foody 2002). In order to properly generate an error matrix, one must consider the following factors: (1) reference data collection, (2) classification scheme, (3) sampling scheme, (4) spatial autocorrelation, and (5) sample size and sample unit (Congalton and Plourde 2002). After generation of an error matrix, other important accuracy assessment elements, such as overall accuracy, user accuracy, producer accuracy (table 6), and kappa coefficient can be derived. Kappa is the difference between the observed accuracy and the chance agreement divided by one minus that chance agreement (Lillesand and Kiefer 1994).
4.3 Wheat, Corn and Cotton Change Detection
Standard post-classification change detection analyze was applied to the classified images. Parcel based change and diversity were performed. So that similar and changed regions were monitored on the study area between 2007 and 2010.
5. RESULTS
Results contain; mapping crop pattern for wheat, corn and cotton, accuracy assessments and change detection sections.
5.1 Crop Pattern Mapping
Firstly, 2007 wheat, corn and cotton crops were mapped. 29th March Landsat ETM data was used to map wheat area. At the end of the March and April time are the greenest time of the wheat and it is a good time to avoid mixing effect with other crops. Corn and Cotton crops were mapped using summer time data as 25th of June and 27th of July 2007 dataset. Times of the Landsat data were defined according to growing season of the corn and cotton. In 2007, 48433 ha wheat, 37919 ha 1st crop corn, 9811 ha 2nd crop corn, 9454 ha 1st crop cotton and 3695 ha 2nd crop cotton agricultural lands were classified. Almost 170000 ha area is arable land in the study area and 28% of the area was wheat in winter time. Total corn areas covered 28.5% and cotton areas were 8% (Figure 2).
Secondly, 2013 dominant crops were mapped by 14th April, 3rd July and 27th July 2013 dataset. As a result of the 2013 classifications were showed that 31054 ha wheat, 49758 ha 1st crop corn, 22606 ha 2nd crop corn, 13117 ha 1st crop cotton and 3695 ha 2nd crop cotton area were defined. Wheat areas were covered 18%, corn areas were 42.5% and cotton areas were 13% of total arable lands respectively in 2013 (Figure 3).
Figure 2. Classified wheat, Corn and Cotton crop pattern in 2007
Figure 3. Classified wheat, corn and cotton areas in 2013
5.2 Accuracy Assessment
Kappa matching statistic was used to test accuracy of the classifications. Parcel based GT data and classified images were crosschecked. Overall kappa value or the 2007 and 2013 were obtained to be 0.88 and 0.9 respectively. Wheat and 1st crop corn were detected in very good accuracy, however, 2nd crop cotton accuracies for both 2007 and 2013 were a little bit less
than other crops. Cotton crops can be mixed with ground nut in the region because of similar spectral and temporal characteristics. However, an image from September or October time may be increased the accuracy of the cotton fields because of harvest time differences between cotton and groundnut (Figure 4).
Figure 4. Kappa statistic results wheat, corn and cotton and difference for 2007 and 2013
5.3 Change Detection of Wheat, Corn and Cotton Areas Crop pattern changes and farmers aspects on dominant field crops were detected between 2007 and 2013. While wheat production reduced, corn and cotton productions increased in the region in 7 years. Especially, government crop subvention policies were very dominant on crop rotation. Wheat production subventions were not increased as corn and cotton in time. Today, Turkey is exported wheat from other countries such as Russia and Ukraine (Figure 5).
Figure 5. Areal difference of the wheat, corn and cotton areas between 2007 and 2013.
Wheat parcels of the area was decreased almost 40% in 7 years and wheat cropping areas were assembled to the mid of the study area in 2013. Because the most productive lands were mainly located in mid and west part of the study area for all crops (Şatır 2013). Although the unsatisfied government subventions on wheat, production was continued in high productive areas because of cost-income balance. However, middle or low productive areas were fallow lands in winter time and 1st crop corn or cotton were produced instead of wheat in these lands. First crop corn fields were not changed too much in general, but a small trend was observed from N.East to South and West part of the study area. Cotton fields were increased almost two times. Particularly, in South part of the area because, this part has a soil salinity problem and only cotton can be grown in saline areas without too much yield loss. Additionally,
2nd crop cotton was observed in high productive areas after the wheat farming (Figure 6).
Figure 6. Areal movements of the wheat, corn and cotton production areas in 7 years.
6. DISCUSSION AND CONCLUSIONS
This paper presented a dominant agricultural crop pattern mapping and monitoring study in a complex Mediterranean Agricultural Basin. In this extent, object based classification capability on crop pattern mapping was tested and dominant crop pattern change was evaluated in 7 years. Accuracy of the classifications defined by kappa statistic in field scale and object based classification approach classified with high accuracy both 2007 and 2013 crop patterns.
Agricultural plots are uniform in their structure. For instead; one field includes one crop in winter or summer time. So that pixel based classification approaches can be caused an error inside the parcel. Some small paths or bed growing areas are broken the field uniformity and one or two pixels can be classified to be bare ground or fallow field. Object based classification was fixed this error using pixel grouping ability. In conclusion, object based classification is capable to map agricultural lands using multi-temporal satellite images. Dominant crop changes in 7 years was shown that government subventions are effected to cropping pattern significantly in the region. Particularly, corn and cotton production were increased in 2013 almost 2 times than 2007. Wheat production was reduced 40% respectively due to unsatisfied subventions and this situation not only observed in study area but also observed in all Turkey in 2013. As a result of lower wheat production that Turkey started to import more wheat from the Russia and other countries.
REFERENCES
Berberoglu S., Lloyd CD., Atkinson PM. & Curran PJ. (2000). The Integration of Spectral & Texture Information Using Neural Networks for Land Cover Mapping In The Mediterranean. Computers and Geosciences 26, 385-396.
Blaschke T. (2010). Object based image analysis for remote sensing. ISPRS Journal of Photogrammetry and Remote Sensing 65: 2 – 16.
Chen Z., Li S., Ren J., Gongi P., Zhang M., Wang L., Xiao S. and Jiang D. (2008). Monitoring and management of agriculture with remote sensing, in: Liang, S. (Ed.), Advanges in Remote Sensing, Springer Science + Business Media B.V, pp. 397 – 421.
Cingolani AM, Renison D., Zak MR. & Cabido MR. (2004). Mapping Vegetation in a Heterogeneous Mountain Rangeland Using Landsat Data: An Alternative Method to Define and Classify Land-Cover Units. Remote Sensing of Environment 92: 84– 97.
Congalton RG. & Plourde L. (2002). Manual of Geospatial Science and Technology, In: Quality assurance and accuracy assessment of information derived from remotely sensed data J. Bossler (Ed.), pp. 349–361, Taylor & Francis, London.
Foody, G.M. (2002). Status of Land Cover Classification Accuracy Assessment. Remote Sensing of Environment 80: 185–201.
Lillesand, TM. & Kiefer RW. (1994). Remote Sensing and Image Interpretation, New York: Oxford University Press.
Liu, D., & Xia, F. (2010). Assessing object-based classification: advantages and limitations, Remote Sensing Letters, 1,(4): 187-194.
Ozdogan M. Woodcock CE. (2006). Resolution dependent errors in remote sensing of cultivated areas. Remote Sensing and Environment 103: 203 – 217.
Özyavuz M., Şatır O. & Bilgili BC. (2011). A Change Vector Analysis Technique to Monitor Land Use/Land Cover In Yıldız Mountains, Turkey. Fresenius Environmental Bulletin 20(5), 1190 – 1199.
Şatır, O., Berberoğlu S. (2012). Land use/cover classification techniques using optical remotely sensed data in landscape planning. In M. Ozyavuz, ed. Landscape Planning. INTECH Rijeka, Croatia, pp. 21–54.
Şatır O. (2013). Determining the agricultural land use suitability using remote sensing and geographical information system in Lower Seyhan Plane, PhD Thesis, Cukurova University Natural and Applied Sciences Ins. Adana, Turkey.
Yuan, F., Bauer. (2006). Mapping impervious surface area using high resolution imagery: a comparison of object-based and per pixel classification. In: ASPRS 2006 annual conference proceedings, Nevada, Reno, pp. 1-8.
Yurdakul O., Emeksiz F, Orhan ME., Ören N., Gürgen Y., Erkan O., Akdemir Ş., Özçatalbaş O. (1991). Economic structure and problems of Cukurova Agriculture and suggestions. 1st Cukurova Agriculture Congress, Adana,
Turkey.