Bhangale Pallavi Raghunath et al. Int. Res. J. Pharm. 2013, 4 (6)
Page 220
INTERNATIONAL RESEARCH JOURNAL OF PHARMACY
www.irjponline.com ISSN 2230 – 8407
Research Article
SPECTROPHOTOMETRIC METHOD FOR SIMULTANEOUS ESTIMATION OF FORMOTEROL FUMARATE AND MOMETASONE FUROATE IN RESPICAPS
Bhangale Pallavi Raghunath, Jain Hemant Kumar* Sinhgad College of Pharmacy, Vadgaon (BK.), Pune, Maharashtra, India
*Corresponding Author Email: hemantkjain2001@yahoo.co.in
Article Received on: 16/03/13 Revised on: 03/04/13 Approved for publication: 01/05/13
DOI: 10.7897/2230-8407.04650
IRJP is an official publication of Moksha Publishing House. Website: www.mokshaph.com
© All rights reserved.
ABSTRACT
The present work represents a UV-Spectrophotometric method for the simultaneous estimation of Formoterol Fumarate (FF) and Mometasone Furoate (MF) in respicaps dosage form. This method is based on area under curve (AUC) in the wavelength range of 210-220nm and 242-252nm. Linearity was found in the concentration ranges of 3-18μg/ml and 6-21μg/ml, for Formoterol Fumarate and Mometasone Furoate, respectively. This method was validated as per International Conference on Harmonization (ICH) guidelines. Validation results suggest that the proposed method is simple, rapid, accurate, sensitive and precise that can be applied for routine estimation of FF and MF in bulk drug and combined dosage form.
Keywords: Simultaneous estimation, Formoterol Fumarate, Mometasone Furoate, Area under curve, Ultraviolet spectrophotometry, Respicaps.
INTRODUCTION
Formoterol Fumarate dihydrate (FF) is chemically known as N-[2-hydroxy-5-[(1RS)-1-hydroxy-2-[[(1RS)-2-(4-methoxy-phenyl)-1-methylethyl] amino] ethyl] phenyl] formamide (E)-butanedioate dihydrate1 (Figure 1). It is a selective beta-2 (β2)
adrenergic receptor agonist which acts as bronchodilator for the treatment of asthma by relaxing muscle spasms in the air passages of lungs2-4. This drug is official in USP5, EP6, IP7 and BP8. Mometasone Furoate (MF) is chemically known as 9, 21-dichloro-11β-hydroxy-16α-methyl-3, 20-dioxopregna-1, 4-diene-17-yl furan-2-carboxylate9 (Figure 2). It is a corticosteroid which helps to decrease inflammation in the lungs and controls various asthmatic symptoms6,10. This drug is official in BP8, USP9 and EP11. The combination of FF and MF is used to control asthma effectively, which cannot be control by single drug alone4,6. Literature survey reveals that several analytical methods have been published for the estimation of Formoterol Fumarate alone or in combination with other drugs. Some of these methods include HPLC12-15, GC16 and UV spectrophotometry17. Various methods have been reported for estimation of Mometasone Furoate alone or in combination with other drugs including UV spectrophotometry18 and supercritical fluid chromatography19. However, no UV method has been reported for simultaneous estimation of FF and MF by area calculation technique. Therefore, attempts were made to develop a UV spectrophotometric method by area under curve (AUC) for simultaneous estimation of Formoterol Fumarate Dihydrate and Mometasone Furoate in respicaps.
MATERIALS AND METHODS Instruments
A Shimadzu UV 1800 double beam spectrophotometer with spectral band width of 1nm and a pair of matched quartz cell and UV probe software, was used for this study. Shimadzu AX200 (Japan) digital balance and Spectrolab UCB40 (Germany) ultrasonicator were also used in the work.
Reagents and Materials
The active pharmaceutical ingredients of Formoterol Fumarate Dihydrate and Mometasone Furoate were supplied
as gift sample by Zydus Cadilla Pvt. Ltd., Ahmedabad, India. Respicaps (Formost 200 contains 6µg of Formoterol Fumarate and 200µg of Mometasone Furoate) were procured from the market, AR grade methanol was obtained from Merck specialties Pvt. Ltd., Mumbai, India and Acrodisc PSF GHP 0.45μm nylon filters were purchased from Pall Life Science limited, Mumbai, India.
Preparation of Standard Solutions
Formoterol Fumarate (100mg) was accurately weighed and transferred to a 100ml volumetric flask containing small amount of methanol. The drug was dissolved with sonication and the final volume was adjusted with methanol up to the mark. This standard stock solution was further diluted with same solvent to get 12μg/ml. Similarly, solution of Mometasone Furoate in methanol was also prepared to get a concentration of 12μg/ml.
Preparation of sample solution
Twenty capsules were accurately weighed and average weight was calculated. Capsule shells were removed; powder equivalent to one capsule was weighed accurately and transferred into a 10ml volumetric flask. Then, Methanol (5ml) was added to dissolve the content present in this flask and 0.94ml of standard stock solution of Formoterol Fumarate was added. This solution was sonicated for 30minutes with occasional swirling and diluted up to mark with same diluent. This solution was filtered using Acrodisc PSF GHP 0.45μm nylon filters and further subjected for UV analysis.
Area under curve method
Bhangale Pallavi Raghunath et al. Int. Res. J. Pharm. 2013, 4 (6)
Page 221 Whereas, α is area of portion bounded by curve data and a
straight line connecting the start and end point, β is area of portion bounded by a straight line connecting the start and end point on curve data and horizontal axis, λ1 and λ2 are
wavelengths representing start and end point of curve region. The selection of wavelength range was done on the basis of linearity between area under curve and concentration. Working standards were prepared by dilutions of standard stock solutions of these drugs and these solutions were scanned in the spectrum mode (200‐400 nm), an overlain spectrum was recorded (Figure 3). The selected sampling wavelength ranges for calculation of area under curve were 220-230 nm and 242.0-252.0 nm. Similarly, Area under curve of sample solutions was also measured at these selected wavelength ranges.
Method Validation
Validation of an analytical procedure is the process by which it is established by laboratory studies that the performance characteristics of the procedure meet the requirements for the intended analytical application23. The proposed method was validated for various parameters such as linearity, precision, accuracy, Limit of detection (LOD), Limit of Quantitation (LOQ) according to ICH Q2 (R1) guidelines.
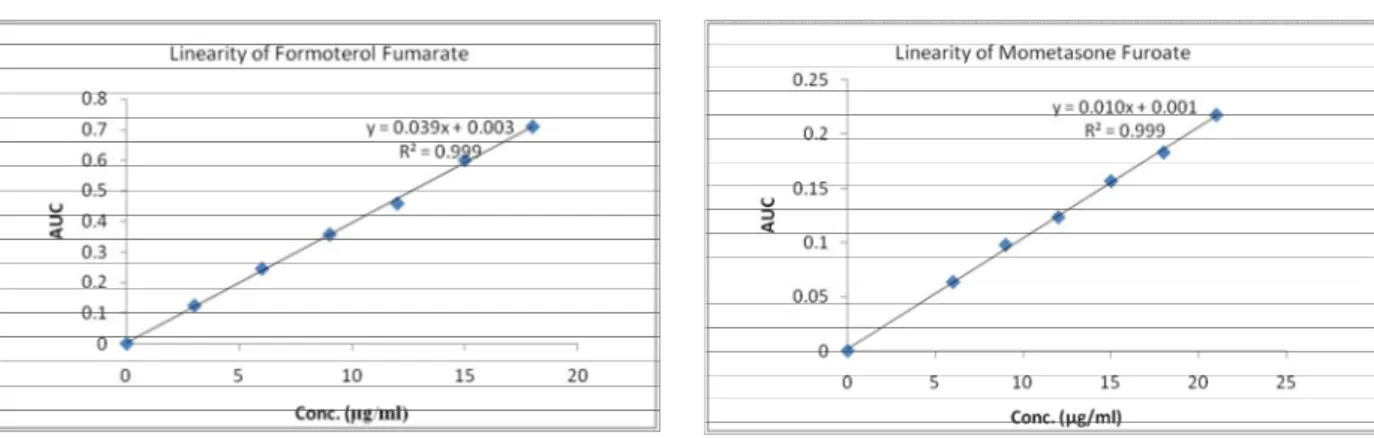
Linearity and Range
The linearity of response for Formoterol Fumarate and Mometasone Furoate was determined by measuring the area under curve in the concentration range of 3-18 µg/ml of Formoterol Fumarate and 6-21µg/ml of Mometasone Furoate. The calibration curves were plotted between concentration range and area under curve, as shown in Figure 4 and 5 for FF and MF, respectively.
Precision
Precision of the method was studied by intra and inter-day variations in the test method of FF and MF. Method repeatability (intra-day precision) was evaluated by assaying six samples, prepared as described under sample preparation. Inter day precision was performed by assaying six samples in different days as described in the sample preparation. The results were expressed as percentage relative standard deviation (%RSD) in Table 2 and 3.
Accuracy
Accuracy of the method was determined by calculating recovery of FF and MF at 80%, 100% and 120% level of sample solutions of FF and MF. The accuracy of the analytical method was established in triplicate across its range. The results of recovery experiments are given in Table 4.
Limit of Quantitation (LOQ) and Limit of Detection (LOD)
Six sets of known concentrations were prepared for both drugs. Calibration curves were plotted for each set. LOD and LOQ were calculated using the formulae as
S SD LOD =3.3
S SD LOQ =10
Where, S is value of slopes of calibration plot and SD is calculated using values of y intercepts of regression equations. The results of LOD and LOQ
are presented in Table 5.
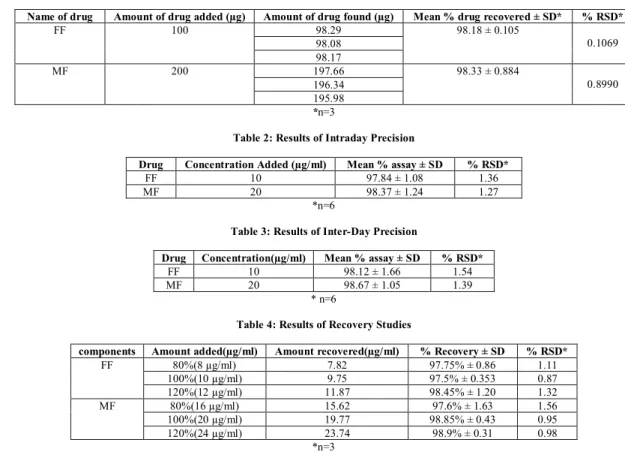
Table 1: Results of Analysis of Respicaps Formulation
Name of drug Amount of drug added (µg) Amount of drug found (µg) Mean % drug recovered ± SD* % RSD*
FF 100 98.29 98.18 ± 0.105
0.1069 98.08
98.17
MF 200 197.66 98.33 ± 0.884
0.8990 196.34
195.98 *n=3
Table 2: Results of Intraday Precision
Drug Concentration Added (µg/ml) Mean % assay ± SD % RSD*
FF 10 97.84 ± 1.08 1.36
MF 20 98.37 ± 1.24 1.27
*n=6
Table 3: Results of Inter-Day Precision
Drug Concentration(µg/ml) Mean % assay ± SD % RSD*
FF 10 98.12 ± 1.66 1.54
MF 20 98.67 ± 1.05 1.39
* n=6
Table 4: Results of Recovery Studies
components Amount added(µg/ml) Amount recovered(µg/ml) % Recovery ± SD % RSD*
FF 80%(8 µg/ml) 7.82 97.75% ± 0.86 1.11
100%(10 µg/ml) 9.75 97.5% ± 0.353 0.87
120%(12 µg/ml) 11.87 98.45% ± 1.20 1.32
MF 80%(16 µg/ml) 15.62 97.6% ± 1.63 1.56
100%(20 µg/ml) 19.77 98.85% ± 0.43 0.95
120%(24 µg/ml) 23.74 98.9% ± 0.31 0.98
Bhangale Pallavi Raghunath et al. Int. Res. J. Pharm. 2013, 4 (6)
Page 222
Table 5: Summary of Results of Analytical Method Validation
Parameters FF MF
λ max (nm) 210-220 242-252
Linearity range (µg/ml) 3-18 6-21
Slope 0.0393 0.0102
y-intercept 0.003 0.0017
Correlation Coefficient (R2) 0.999 0.9991
Intraday 1.36 1.27
Inter-day 1.54 1.39
Accuracy (Mean % Recovery) 97.5-98.45 97.6-98.9
LOD (µg/ml) 0.0491 0.278
LOQ (µg/ml) 0.016 0.0195
Figure1: Chemical structure of Formoterol Fumarate dehydrate Figure 2: Chemical structure of Mometasone Furoate
Figure 3: Overlain spectrum of Formoterol Fumarate and Mometasone Furoate in Methanol
Figure 4: Calibration curve of Formoterol Fumarate at 210-220nm Figure 5: Calibration curve of Mometasone Furoate at 242-252nm
RESULTS AND DISCUSSION
The percentage assay of marketed formulation was 98.18±0.105 and 98.33±0.884, respectively for FF and MF (Table 1), which suggest no interference from the excipients of formulation. The summary of validation parameters for the proposed analytical spectrophotometric method is given in
Bhangale Pallavi Raghunath et al. Int. Res. J. Pharm. 2013, 4 (6)
Page 223 accurate. Sensitivity of the method was determined by
calculating limit of detection (LOD) and limit of quantification (LOQ). Limit of detection for FF and MF was 0.0491μg/ml and 0.278μg/ml, respectively. Limit of quantitation with desired accuracy as well precision for FF and MF was found 0.016μg/ml and 0.0195μg/ml, respectively.
CONCLUSION
It can be concluded from the results that the proposed spectroscopic method was found to be simple, sensitive, accurate and precise for the analysis of FF and MF in respicaps dosage form. This method was validated as per ICH guidelines. Thus, it can be used for routine quality control studies for assay of FF and MF in bulk and combined dosage form.
ACKNOWLEDGEMENT
The authors thanks to the Principal, Sinhgad College of Pharmacy, Pune, India for providing the facilities to carry out this work and special thanks to Zydus Cadilla Pvt. Ltd, Ahmadabad, India for providing gift sample of FF and MF API for this research study.
REFERENCES
1. Neil O, Maryadele J. The Merck Index, An Encyclopaedia of Chemicals,
Drugs, and Biologicals, 14th
ed, Merck and Co., Inc., Whitehouse Station: New Jersey, USA, Monograph No. 4245; 2006. p. 728
2. Tripathi KD. Essentials of Medical Pharmacology, 6th
ed, Jaypee Brothers Medical Publishers (P) Ltd, New Delhi; 2008. p. 213-227
3. Rang HP, Dale MM, Ritter JM, Moore PK. Pharmacology, 5thed,
Churchill Livingstone, Elsevier science limited, India; 2003. p. 340-349
4. Dulera official FDA information; Merck and Co., Inc. Whitehouse
station, NJ 08889 USA, U.S. Patent No. 6068832; 2013.
5. USP36- NF 31, United States Pharmacopeial Convention, inc. 12601, twarkway, Rockville, official; 2013. p. 3669-70
6. European pharmacopoeia, PHARMEUROPA, EDQM publication,
France; 7th
ed 2011; 2: 2067-2069.
7. Indian pharmacopoeia, Ministry of Health and Family Welfare, Govt. of
India, Published by The Indian Pharmacopoeia Commission Ghaziabad 2007; 2: 527.
8. British pharmacopoeia, Medicines and Healthcare Products regulatory a
gency (MHRA), London 2009; 1: 2677, 4033.
9. USP36- NF 31, United States Pharmacopeial Convention, inc. 12601, twarkway, Rockville, official; 2013. p. 4394-95
10. Neil O, Maryadele J. The Merck Index, An Encyclopaedia of Chemicals,
Drugs, and Biologicals, 14thed, Merck and Co., Inc., Whitehouse Station: New Jersey, USA, Monograph No. 6241; 2006. p. 1077
11. European Pharmacopoeia, PHARMEUROPA, EDQM publication,
France; 7thed 2011; 2: 2523-2525.
12. Ahmed S, Jayakar B. Development of reverse phase high performance liquid chromatography method and its validation for estimation of Formoterol Fumarate rota caps, IJPSR 2011; 2 (suppl. 2): 319-324. 13. Akapo S, McCrea C, Gupta J, Chiral. HPLC analysis of Formoterol
stereoisomers and thermodynamic study of their interconversion in aqueous pharmaceutical formulations, J Pharm Biomed Anal 2009; 49: 632-637. http://dx.doi.org/10.1016/j.jpba.2008.12.004 PMid:19150186 14. Akapo S, Asif M. Validation of a RP-HPLC method for the assay of
formoterol and its related substances in formoterol fumarate dihydrate drug substance, J Pharm Biomed Anal 2003; 33: 935-945. http:// dx.doi.org/10.1016/S0731-7085(03)00425-4
15. Trivedi R, Chendake D, Patel M. A Rapid Stability-Indicating RP-HPLC
Method for the Simultaneous Determination of Formoterol Fumarate, Tiotropium Bromide, and Ciclesonide in a Pulmonary Drug Product sci pharm 2012; 80: 591–603.
16. Akapo S, Wegnar M, Mamangun A. Optimization and validation of a gas chromatographic method for analysis of (RS,SR)-diastereoisomeric impurity in formoterol Fumarate, Journal of Chromatography A 2004; 1045:211–216.http://dx.doi.org/10.1016/j.chroma.2004.06.023 PMid:15378897
17. Gousuddin M, Appala R; Development and validation of
Spectrophotometric methods for estimation of Formoterol bulk drug and its pharmaceutical dosage forms, IJPPS 2011; 3( suppl. 3): 306-309.
18. Priyanka G, Santhi priya M. International workshop on transdermal drug
delivery system regulatory requirements in asian scenario (homepage on the internet), AP (India), Department of science and technology Government of India; (updated 2012 nov 14, Cited 2013 Feb 8). http://kvsrsiddharthapharma.edu.in/images/booklet.pdf
19. Wang Z, Zhang H, Liu O. Development of an orthogonal method for Mometasone Furoate impurity analysis using supercritical fluid
chromatography, Journal of Chromatography A 2011; 1218: 2311–2319.
http://dx.doi.org/10.1016/j.chroma.2011.02.027 PMid:21376330 20. Jain HK, Singhai AK, Agrawal RK. Estimation of Losartan Potassium
from Tablets. Indian Drugs 2000; 37(5): 239-242.
21. Jain HK, Agrawal RK. Simultaneous Estimation of Gliclazide and
Metformin Hydrochloride in Combined Dosage Forms. Indian Journal of Pharmaceutical Sciences 2002; 64: 88-91.
22. Shimadzu Corporation- Kyoto Japan, Analytical and Measuring
Instruments Division, Instruction Manual- operation Guide UV-1800; 2008. p. 13.21-13.25.
23. ICH, Q2 (R1) Validation of Analytical Procedures: Text and
Methodology, International conf. on Harmonization, Geneva,
November; 2005.
Cite this article as:
Bhangale Pallavi Raghunath, Jain Hemant Kumar. Spectrophotometric method for simultaneous estimation of Formoterol fumarate and Mometasone furoate in respicaps. Int. Res. J. Pharm. 2013; 4(6):220-223