*Correspondence: F. R. Lourenço. Departamento de Farmácia, Faculdade de Ciências Farmacêuticas –USP. Av. Prof. Lineu Prestes, 580 – Bloco 13 - 05508-900 – São Paulo – SP, Brazil. E-mail: [email protected]
A
rti
Pharmaceutical Sciences vol. 47, n. 3, jul./sep., 2011
Antibiotic microbial assay using kinetic-reading microplate system
Felipe Rebello Lourenço, Terezinha de Jesus Andreoli Pinto
Department of Pharmacy, Pharmaceutical Sciences School, University of São Paulo
The aim of this study was to determine the optimal experimental conditions to develop a methodology for microbiological assay of apramycin employing microplate and kinetic reading mode, and to validate the developed method, through evaluation of parameters of selectivity, linearity, linear range, limits of detection and quantiication, accuracy and precision. The turbidimetric assay principle is simple: the test solution is added to a suspension of test microorganism in culture media, the mixture is incubated under appropriate conditions and the microbial growth is measured by photometric reading. Microplate with kinetic reading mode employed in antibiotic assay is of considerable interest since it allows reduction of material and analysis time and enables a large number of samples to be analyzed simultaneously, with automated reading and calculating. Established conditions considered the standard-curve of apramycin at concentrations from 5.0 to 35.0 µg mL-1, and tryptic soy broth inoculated with 5% Escherichia coli
(ATCC 8739) suspension. Satisfactory results were obtained with 2 hours of incubation. The developed method showed appropriate selectivity, linearity in the range from 5.0 to 35.0 µg mL-1, limits of detection
and quantiication of 0.1 and 0.4 µg mL-1, respectively, as well as satisfactory accuracy (recuperation =
98.5%) and precision (RSD = 6.0%). Microplate assay combined the characteristics of microbiological (evaluation of antibiotic activity against sensitive test microorganism) and physico-chemical (operationally straightforward and faster results) assays.
Uniterms: Antibiotics/microbial assay. Apramycin/microbial assay. Apramycin sulfate. Turbidimetric assay/medicines analysis.
O objetivo deste trabalho é determinar as condições experimentais ideais para o desenvolvimento de metodologia para a dosagem microbiológica de apramicina empregando microplacas e modo de leitura cinético e validar o método desenvolvido, através da avaliação dos parâmetros de especiicidade e seletividade, linearidade, faixa ou intervalo linear, limite de detecção e quantiicação, exatidão e precisão. O ensaio turbidimétrico é simples: a solução-teste é adicionada à suspensão de microrganismo-teste em meio de cultura, a mistura é incubada em condições apropriadas e o crescimento microbiano é medido por meio de leitura fotométrica. O emprego de método de microplacas com leitura cínética para a dosagem de antibióticos é de interesse considerável, uma vez que possibilita reduzir quantidade de material e tempo de análise necessários e permite o ensaio de grande número de amostras simultaneamente, com leitura e cálculo automatizados. As condições estabelecidas abrangem curva-padrão de apramicina com concentrações entre 5 e 35 µg/mL, e emprego de meio de cultura caldo de triptona-soja inoculado com Escherichia coli (ATCC 8739) na proporção de 5%. Foram obtidos resultados satisfatórios após 2 horas de incubação. O método desenvolvido apresentou especiicidade e seletividade adequadas, linearidade na faixa de 5 a 35 µg/mL, limite de detecção e quantiicação de 0,1 e 0,4 µg/mL, respectivamente, exatidão (recuperação = 98,5%) e precisão (DPR = 6,0%) satisfatórias. O ensaio em microplaca agrega características dos ensaios microbiológicos (avaliação da atividade do antibiótico frente a microrganismo-teste sensível) e físico-químicos (facilidade operacional e maior rapidez na obtenção dos resultados).
INTRODUCTION
Apramycin is an aminoglycoside antibiotic produ-ced by Streptomyces tenebrarius (Perzynshki et al., 1979; O’Connor et al., 1976; Walton, 1978; Tatsuta et al., 1984). Akin to the other aminoglycoside antibiotics, it is a polar hydrophilic compound slightly soluble in alcohol, inso-luble in acetone and ether that is non-volatile and has no chromophoric group in its structure (Figure 1). Apramycin sulfate is a yellowish amorphous powder which is used in veterinary treatment (Martindale, 2007). Apramycin is an extremely powerful inhibitor of bacterial protein synthesis, and its primary effect consists of the blocking of transloca-tion (Hermann et al., 2007). It induces irreversible reading error during translation, and this effect is proportional to drug concentration (Perzynski et al., 1979).
The lack of chromophoric groups in the structure of aminoglycosides makes it necessary to employ derivatiza-tion reagents, which provide ultraviolet (UV) detecderivatiza-tion or luorescence detection (Isoherranen, Soback, 1999; Stead, 2000; Sweeney, Coleman, 1998; Zhang et al., 2007). In addition to the UV detection or luorescence detection obtained by derivatization, other types of detection may be employed in the determination of aminoglycosides, such as amperometric detection (Megoulas, Koupparis 2005), evaporative light scattering detection (Serrano, Silva, 2006; Lovering et al., 1984) and mass spectrometry (Bogialli et al., 2005). Despite the advantages and popu-larization of employment of ion-pair reversed phase high performance liquid chromatography (HPLC), there are other methods that use ion-exchange chromatography with chemiluminescent detection (Polta et al., 1985). In addition the HPLC, spectrophotometry may also be employed in the determination of apramycin, tobramycin and kana-mycin in pharmaceutical dosages (Bontchev et al., 1984). Currently, chemical and physico-chemical methods, especially high performance liquid chromatography, have been focused as an interesting alternative for the analysis
of antibiotics (Yamamoto, 1999). However, in situations in which the antibiotic cannot be deined and/or quantiied in terms of its chemical or physico-chemical properties, microbiological assay remains the method of choice for determination of potency (Hewitt, 1977). The oficial tur-bidimetric assay recommends employment of Salmonella cholerasuis as the inoculum, an incubation temperature of 37 ºC and apramycin sulfate as the reference standard. Standard and sample solutions are prepared employing phosphate buffer solution pH 8.0 as the diluent. The cul-ture medium employed is composed of dextrose, tryptone and yeast extract (British Pharmacopoeia, 2008).
The turbidimetric method is characterized by a series of tubes containing different concentrations of antibio-tics in a liquid culture medium inoculated with the test microorganism. Reading data obtained after incubation provides a curve displaying the antibiotic concentration with turbidity. Turbidimetric assays have been employed for evaluation of antibiotics since the beginning of the use of penicillin (Kavanagh, 1963). The understanding of turbidimetric assay for evaluation of antibiotics is based on two concepts: (a) interaction between the antibiotic and test microorganism; and (b) meaning of the turbidity (Kavanagh, 1972). It is a requirement for an adequate turbidimetric assay that the antibiotic interacts with the test microorganism in order to alter its growth kinetic, and allows the response (antibiotic concentration related to turbidity) to be elucidated (Kavanagh, 1972). There are two parameters of microbial growth affected by the pre-sence of the antibiotic: microbial generation time and lag phase period. Most antibiotics work by reducing microbial generation time, while some substances act by increasing the period of lag phase (Kavanagh, 1972).
antibiotic residues in food (Lamar, Petz, 2007).
In a new approach, the turbidimetric assay for eva-luation of antibiotics can be accomplished by the use of microplates, which allows the test to be conducted in a single 96-well microplate, eliminating the need for several test tubes. The microplate assay demands a signiicantly reduced amount of materials such as solutions and culture media. Water baths are not necessary for the microplate assay, since the incubation is performed in the microplate-spectrophotometer (Brady, Katz, 1991). This assay em-ploys optical density reading after a given incubation time (endpoint-reading method).
The aim of this study was to develop a method for microbiological assay of apramycin employing the kinetic reading microplate system and to validate the developed method by assessing selectivity, linearity, linear range, limits of detection and quantiication, accuracy and pre-cision. The study also sought to investigate aspects of the inluence of experimental conditions on the micro-biological assay of apramycin employing kinetic reading microplate system.
MATERIAL AND METHODS
Samples and reference standard
Samples of the commercial product ApralanTM
So-luble (powder for oral solution) supplied by Eli Lilly do Brasil Ltda (SP, Brazil) were tested. The apramycin sulfate reference standard (lot RS0192, potency 873 µg mg-1) used
in the tests was kindly provided by Eli Lilly of Brasil Ltda (SP, Brazil).
Test Microorganism
The test microorganism used in the assay was Esche-richia coli (ATCC 8739), provided by the Instituto Adolfo Lutz (SP, Brazil). Cultures of Escherichia coli (ATCC 8739) were maintained in slants of tryptone-soy agar.
Determination of experimental conditions
An aliquot of a fresh culture of Escherichia coli
(ATCC 8739) was transferred to a lask containing 100 mL of tryptone soy broth and incubated at 32.5±2.5ºC for no
longer than 24 hours. The suspension obtained from this growth, containing 107-108 CFU mL-1, was used as the
inoculum. Appropriate amounts of tryptone-soy broth were inoculated at 1.0, 3.0 and 5.0%.
Solutions of reference standard were prepared con-taining various concentrations (1, 2, 4, 8, 10, 20, 30, 40, 50, 60, 70, 80, 90 and 100 µg mL-1) of apramycin sulfate,
employing tryptone-soy broth as the diluent. Aliquots of 100 µL of each apramycin sulfate solution were transferred
to a microplate. Also, aliquots of 100 ml of tryptone-soy broth inoculated with Escherichia coli (ATCC 8739) at 1.0, 3.0 and 5.0% were transferred to the microplate. Negative controls (NC) and positive controls (CP) were also included in the microplate. A scheme of the distribution of apramycin sulfate solutions in the microplate is shown in Scheme 1.
A microplate spectrophotometer (Biotek Elx808, WI, USA) was used for incubation and reading of mi-croplates. Incubation was performed at a temperature of 37.0±1.0 ºC for a period of 8 hours. Absorbances were
measured at 630 nm at intervals of 5 minutes.
SCHEME 1 - Scheme of distribution of apramycin sulfate solutions at various concentrations (1, 2, 4, 8, 10, 20, 30, 40, 50, 60, 80, 90
Method validation
After establishing the best conditions for obtaining the dose-response curve, the method was validated by assessing selectivity, linearity, linear range, limits of detection and quantiication, accuracy and precision. The method validation was performed considering three diffe-rent reading modes: 1) endpoint-reading mode (single me-asurement after period of incubation); 2) kinetic-reading mode by reaction time (RT) (time required for increase in absorbance reading, based on several measurements during incubation period); and 3) kinetic-reading mode by area under the curve (AUC) (area under the microbial growth curve, based on several measurements during incubation period).
In method validation, aliquots of 100 µl of
stan-dard solutions (5, 10, 15, 20, 25, 30 and 35 µg mL-1) and
sample solutions (10, 15, 20, 25 and 30 µg mL-1) were
transferred to a microplate. Also, aliquots of 100 ml of tryptone-soy broth inoculated with Escherichia coli
(ATCC 8739) at 5.0% were transferred to the microplate. Negative controls (NC) and positive control (CP) were also included in the microplate. A scheme of the distribu-tion of standards and sample soludistribu-tions in the microplate is shown in Scheme 2.
Three analytical curves were prepared with solutions containing various concentrations (5, 10, 15, 20, 25, 30 and 35 µg mL-1) of apramycin sulfate. The linearity was
evaluated by analysis of linear regression. The linearity of the method was considered satisfactory for a coeficient of correlation (r) greater than or equal to 0.90. The limits of detection and quantiication were determined based on the results of linearity.
Accuracy was determined by evaluation of simu-lated samples spiked with known amounts of apramycin. The experimental concentrations were plotted against the theoretical concentrations. The accuracy was considered satisfactory when the conidence interval for the linear coeficient (ixed bias) and angular coeficient (relative bias) included the values 0 and 1, respectively. Precision was assessed by the relative standard deviation (RSD) at different concentrations. Three simulated samples were evaluated at 5 different concentrations, giving a total of 15 independent trials.
RESULTS
Determination of experimental conditions
The turbidimetric assay for evaluation of antibio-tics is based on the interaction between the antibiotic and the test microorganism and on the meaning of the turbidity. The interaction between the antibiotic and the test microorganism occurs such that the antibiotic inhibits microbial growth. In this way, turbidity provided by mi-crobial growth is inversely proportional to the antibiotic concentration (Kavanagh, 1972). The test microorganism should be sensitive to the antibiotic tested and should grow in liquid culture medium in differently depending on the concentration of antibiotic (Cooper, 1963; Falk, 1953; Loy, Wright, 1959).
The experimental conditions chosen were those that yielded best dose-response curve. Solutions with concentrations in the range 1 to 100 µg mL-1 of apramycin
were evaluated, employing tryptone-soy broth inoculated with Escherichia coli (ATCC 8739) at 1%, 3% and 5%.
SCHEME 2 - Scheme of distribution of apramycin sulfate standard solutions at various concentration (5 (S5), 10 (s10), 15 (S15),
20 (S20), 25 (S25), 30 (S30) and 35 (S35) µg mL-1), sample solutions at various concentration (10 (A10, B10 and C10), 15 (A15,
B15 and C15), 20 (A20, B20 and C20), 25 (A25, B25 and C25) and 30 (A30, B30 and C30) µg mL-1), negative control (NC) and
The range of concentration of apramycin between 5 and 40 µg mL-1 showed best response, which means microbial
growth curves that permit establishing of a correlation between turbidity and antibiotic concentration.
Figure 2 shows the results of the microbial growth curve in tryptone soy broth with Escherichia coli (ATCC 8739) at 1%, 3% and 5% containing apramycin sulfate at 30 µg mL-1. Escherichia coli (ATCC 8739) at 5% was
chosen due to the fast growth curve under this condition, which reduces incubation time. After the accomplish-ment of the preliminary tests for choices of experiaccomplish-mental conditions, additional tests were conducted for method validation.
The microbial growth curves of solutions at various concentrations (5, 10, 15, 20, 25, 30 and 35 µg mL-1) of
apramycin in tryptone-soy broth inoculated with Esche-richia coli (ATCC 8739) at 5% and incubated for 180 minutes (absorbances measured at 630 nm at intervals of 30 minutes) are shown in Figure 3. The microbial growth observed was faster for low concentrations of apramycin than for high concentrations.
Considering that the conditions of incubation (tem-perature, pH, composition of culture medium) are constant and identical in each of the 96 wells and that the generation time and lag phase period of the test microorganism are functions of the concentration of antibiotic, microbial gro-wth occurs differently for each concentration of antibiotic. Thus, the slope of the dose-response curve increases with longer incubation time, facilitating the readings of the samples of antibiotic (Kavanagh, 1963, 1972). The results obtained with the microplate assay employing Escherichia
0 20 40 60 80 100 120 140 160 180
0 50 100 150 200 250 300 350
Time (min)
Absorbance (mAU)
1% 3% 5%
FIGURE 2 - Graph of microbial growth in tryptone soy broth
inoculated with Escherichia coli (ATCC 8739) at 1%, 3% and
5% containing apramycin sulfate at 30 µg mL-1.
0
50 100 150 200 250 300
0 50 100 150 200
Time (min)
Absorbance (mAU)
0,005 mg/mL 0,010 mg/mL 0,015 mg/mL 0,020 mg/mL 0,025 mg/mL 0,030 mg/mL 0,035 mg/mL
FIGURE 3 - Graph of microbial growth in tryptone soy broth
inoculated with Escherichia coli (ATCC 8739) at 5% containing
apramycin sulfate at various concentrations (5, 10, 15, 20, 25,
30 and 35 µg mL-1).
coli (ATCC 8739) at 5% conirmed this statement (Figure 4).
Method validation
The developed method was evaluated by assessing selectivity, linearity, linear range, limits of detection and quantiication, accuracy and precision, considering both endpoint-reading and kinetic-reading (reaction time – RT – and area under the curve – AUC) modes.
The methods employing Escherichia coli (ATCC 8739) at 5% using an endpoint-reading mode after 120 mi-nutes of incubation, and kinetic-reading mode (RT) with 25 mAU differential of absorbance and a kinetic-reading mode (AUC) for120 minutes of incubation, showed satis-factory linearity (Figure 5).
0 50 100 150 200 250 300
0,600 0,800 1,000 1,200 1,400 1,600
Log(Conc)
Absorbance (mAU)
0 min
30 min
60 min
90 min
120 min
150 min
180 min
FIGURE 4 - Graph of absorbance (mAU) vs. logarithm of
apramycin concentration (µg mL-1) employing tryptone soy
broth inoculated with Escherichia coli (ATCC 8739) at 5% after
The limits of detection and quantiication for the method employing Escherichia coli (ATCC 8739) at 5% and endpoint-reading after 120 minutes of incubation were 0.1 µg mL-1 and 0.4 µg mL-1, respectively. For
the method using kinetic-reading mode (reaction time) employing Escherichia coli (ATCC 8739) at 5% and 25mAU differential of absorbance, the limits of detection and quantiication were 0.5 µg mL-1 and 1.7 µg mL-1,
respectively. Limits of detection and quantiication of 0.7 µg mL-1 and 2.2 µg mL-1, respectively, were obtained
for the method employing Escherichia coli (ATCC 8739) at 5% and kinetic-reading mode (AUC) for 120 minutes of incubation.
The methods employing Escherichia coli (ATCC 8739) at 5% using an endpoint-reading mode after 120 minutes of incubation, a kinetic-reading mode (RT) with 25 mAU differential of absorbance and a kinetic-reading mode (AUC) for 120 minutes of incubation, showed
ade-quate accuracy, with recoveries of 98.5%, 102.3% and 103.4% respectively.
The methods employing Escherichia coli (ATCC 8739) at 5% using an endpoint-reading mode after 120 minutes of incubation, a kinetic-reading mode (RT) with 25 mAU differential of absorbance and a kinetic-reading mode (AUC) for 120 minutes of incubation, showed precision (RSD) of 6.0%, 32.6% and 11.7% respectively.
Comparison of endpoint-reading and kinetic-reading (RT and AUC) modes
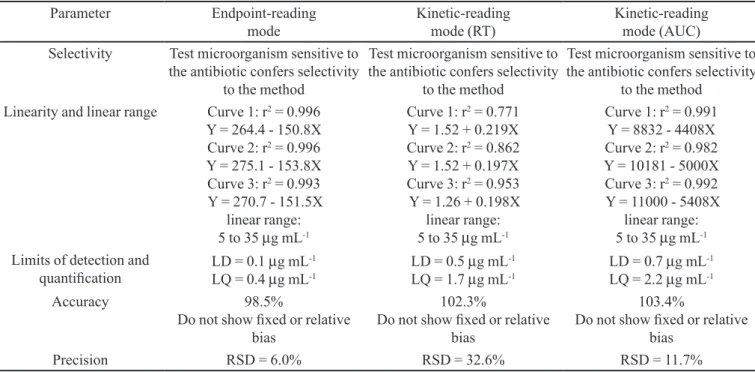
The method validation covered the evaluation of the parameters of selectivity, linearity, linear range, limits of detection and quantiication, precision and accuracy. For the three modes of reading (endpoint-reading, kinetic-reading RT and kinetic-kinetic-reading AUC) the absorbance data for the microbial growth in the presence of the antibiotic were the same, albeit treated in different ways. The results of the validation of the methods using end-point reading, kinetic-reading RT and kinetic-reading AUC are shown in Table I.
Comparisons between microplate assay and other methods
Some fundamental aspects should be considered before choosing a speciic method: (a) cost of equipment and reagents necessary, (b) time involved in execution, (c) number of samples to be tested; and (d) the possibi-lity of automation of the method. The technical aspects inherent to the method should also be taken into account: (a) selectivity, (b) linearity and linear range, (c) accuracy, (d) limits of detection and quantiication, (e) accuracy (f) precision.
With this approach, it is important to list advantages and disadvantages of the microplate assay in compari-son with others (Table II). Thus, the microplate assay employing Escherichia coli (ATCC 8739) at 5% after 120 minutes of incubation was compared with the agar diffusion microbiological assay and high eficiency liquid chromatography (HPLC).
DISCUSSION
The microplate assay is fundamentally a turbidi-metric assay that employs low amounts of materials and permits the evaluation of microbial growth throughout incubation time. Therefore, it was decided to discuss the results of microplate assay in comparison to the traditional turbidimetric assay.
(A)
0
20 40 60 80 100 120 140 160 180
0,600 0,800 1,000 1,200 1,400 1,600
Log(Conc)
Absorbance (mAU)
Curve 1 Curve 2 Curve 3
(B)
1,55 1,6 1,65 1,7 1,75 1,8 1,85 1,9 1,95
0,600 0,800 1,000 1,200 1,400 1,600
Log(Conc)
Log(RT)
Curve 1 Curve 2 Curve 3
(C)
0 1000 2000 3000 4000 5000 6000 7000 8000
0,600 0,800 1,000 1,200 1,400 1,600
Log(Conc)
Area Under the Curve (AUC)
Curve 1 Curve 2 Curve 3
FIGURE 5 - Calibration curve for microplate assay employing
Escherichia coli (ATCC 8739) inoculated at 5% using A) endpoint-reading mode, B) kinetic-reading mode (RT) and C) kinetic-reading mode (AUC). Curves 1, 2 and 3 are independent analytical curves prepared with solutions containing various
concentrations (5, 10, 15, 20, 25, 30 and 35 µg mL-1) of
TABLE I - Comparison of method validation results for microplate assay using endpoint-reading, reading (RT) and
kinetic-reading (AUC) modes
Parameter Endpoint-reading
mode Kinetic-reading mode (RT) Kinetic-reading mode (AUC)
Selectivity Test microorganism sensitive to
the antibiotic confers selectivity to the method
Test microorganism sensitive to the antibiotic confers selectivity
to the method
Test microorganism sensitive to the antibiotic confers selectivity
to the method
Linearity and linear range Curve 1: r2 = 0.996
Y = 264.4 - 150.8X
Curve 2: r2 = 0.996
Y = 275.1 - 153.8X
Curve 3: r2 = 0.993
Y = 270.7 - 151.5X linear range:
5 to 35 µg mL-1
Curve 1: r2 = 0.771
Y = 1.52 + 0.219X
Curve 2: r2 = 0.862
Y = 1.52 + 0.197X
Curve 3: r2 = 0.953
Y = 1.26 + 0.198X linear range:
5 to 35 µg mL-1
Curve 1: r2 = 0.991
Y = 8832 - 4408X
Curve 2: r2 = 0.982
Y = 10181 - 5000X
Curve 3: r2 = 0.992
Y = 11000 - 5408X linear range:
5 to 35 µg mL-1
Limits of detection and
quantiication LD = 0.1 µg mL
-1
LQ = 0.4 µg mL-1 LD = 0.5 µg mL
-1
LQ = 1.7 µg mL-1 LD = 0.7 µg mL
-1
LQ = 2.2 µg mL-1
Accuracy 98.5%
Do not show ixed or relative bias
102.3%
Do not show ixed or relative bias
103.4%
Do not show ixed or relative bias
Precision RSD = 6.0% RSD = 32.6% RSD = 11.7%
TABLE II - Comparison among microplate assay using endpoint-reading mode, the agar diffusion method and HPLC method
employing OPA-mercaptoacetic acid derivatization
Parameter Microplate assay
(Endpoint-reading) Agar Diffusion Method MethodHPLC
Linear range 5 – 35 µg mL-1 1 – 4 µg mL-1 20 – 40 µg mL-1
Precision RSD = 6.0% RSD = 6.0% RSD = 1.1%
Estimated time for accomplishment
of the test
5 hours (3 hs for preparation +
2 hs for incubation)
21 hours (3 hs for preparation +
18 hs for incubation)
5 hours (3 hs for preparation + 2 hs for chromatographic run)
Advantages 1) Evaluates biological activity,
2) Rapid and 3) Operational simplicity
1) Evaluates biological activity, 2) Higher sensitivity and 3) Does not need speciic
equipment
1) Higher precision, 2) Reproducibility and
3) Rapid
Disadvantages 1) Needs speciic equipment and
2) Lower precision 1) Long incubation time and 2) Lower precision 1) Needs speciic equipment and 2) Does not evaluate biological
activity
Microbial growth curves in tryptone-soy broth inoculated at 5% containing apramycin at various concen-trations (5, 10, 15, 20, 25, 30 and 35 µg mL-1) showed that
the rate of growth of Escherichia coli (ATCC 8739) was reduced. The slopes of the growth curves of Escherichia coli (ATCC 8739), in log phase, showed that the rate of microbial growth was lower for higher concentrations of antibiotic (Figure 3), according to the principles of the
turbidimetric assay (Kavanagh, 1972; Cooper, 1963; Pinto
et al., 2003). Also, it was ascertained that not all concen-trations of apramycin altered the lag phase of growth of Escherichia coli (ATCC 8739).
makeup, which allows quick microbial growth (Kavanagh, 1972; Cooper, 1963); (b) the use of fresh microbial culture prepared in culture medium identical to that employed in the test to reduce the lag phase (Kavanagh, 1972; Pinto
et al., 2003; Joslyn, Galbraith, 1950); and (c) use of high burden of microorganism as inoculum (Kavanagh, 1972; Foster, Woodruff, 1943). The inoculum of Escherichia coli (ATCC 8739) was thus prepared in the same culture medium used in the test, namely, tryptone-soy broth. This culture medium, which is rich in nutrients, coupled with the high burden of microorganisms used as the inoculum (proportion of 5%) allowed quick microbial growth and consequently less time to reach the required turbidity.
Although the use of a high burden of microorga-nism as the inoculum promotes shorter incubation time, this feature reduces sensitivity of the method (Foster and Woodruff 1943). The interaction between the antibiotic and test microorganism reduces the growth rate in a uni-form way. However, this occurs non-uniuni-formly at higher concentrations of antibiotic (Kavanagh, 1972; Joslyn, Galbraith 1950). The results obtained using microplate assay employing Escherichia coli (ATCC 8739) at 5% were consistent with the results found in the literature.
The turbidimetric assay, in which the incubation time is long, requires the use of sterile culture media and test solutions. The sterility of test solutions is not a pre-requisite for assays in which the incubation times are short (Bond, Davies, 1948). This situation is evident for growth factor assays, in which the long incubation times demands the sterility of test solutions. However, the absence of microbial contamination is required, particularly by microorganism non-sensitive to the antibiotic evaluated, which can cause turbidity in the culture medium and inluence the assay.
The dose-response curves obtained for long incu-bation periods (120, 150 and 180 minutes) have a higher slope than those obtained for short incubation periods (30, 60 and 90 minutes), as shown in Figure 4. Considering the 150 and 180 minutes periods of incubation, the linear range is limited to low concentrations of antibiotic (5 to 20
µg mL-1). Although this condition has increased sensitivity,
it takes longer to obtain the responses. The dose-response curve obtained for 120 minutes of incubation had the most cost-effective ratio: a wide linear range (5 to 35 µg mL-1)
and a satisfactory slope.
Non-uniform thermal conduction represents a prac-tical problem during the incubation time for conventional turbidimetric assay (Pinto et al., 2003). This situation is minimized when the microplate assay is employed, since the volume of solutions used in the assay (about 200 µL)
allows for better thermal conduction during the incubation period. It is important to highlight the versatility of
micro-plate readers, which allow incubation of the micromicro-plate in the spectrophotometer (Brady, Katz, 1991).
In conventional turbidimetric assay, another con-cern is the sedimentation of bacteria at the bottom of the tube, which can inluence microbial growth due to limited amount of oxygen. Vortexing during the incubation time (intermittent or continuous) is used in order to avoid this problem (Kavanagh, 1963; Pinto et al., 2003; Bond, Da-vies, 1948; McMahan, 1944). Some microplate readers have mechanisms for periodic agitation of the micropla-te, which minimizes the sedimentation of bacteria at the bottom of the microplate. Furthermore, the volume of solutions used in microplate assay (200 µL) minimizes the
differences in oxygen concentration on the surface and at the bottom of the microtube.
A limitation of conventional turbidimetric assay, par-ticularly for samples of biological luids and exudates (blood samples, cerebrospinal luid and urine), is the need for a large amount of sample solution (Rammelkamp, 1942; Fiel-ding, 1947; Fleming, 1944; Fleming, 1947). This problem is minimized in the microplates assay, since the amount of sample employed is about 100 µL for each replicate.
Throughout the methodological development of the conventional turbidimetric assay, standardized tubes (Joslyn, 1944) with interruption of microbial growth by placing the tubes in a bath of hot water (McMahan, 1944) were used. These modiications were adopted in order to reduce the work involved in the readings of turbidity (eli-minate transfer of suspensions to speciic containers before reading in spectrophotometer) and to minimize the errors due to the interval between readings (due to uninterrupted microbial growth). The microplate assay eliminates these restraints, since the readings are performed in the micro-plate itself during incubation.
Another disadvantage inherent to conventional turbidimetric assay is interference in the photometric re-ading due to sample color (Kavanagh 1963; Loy, Wright 1959; Pinto et al., 2003). This interference is eliminated in microplate assay, by correcting responses through initial absorbance readings.
The latest photometric devices are equipped with software that allows automated reading and calculation of results. The interpolation of data using an online computer system cuts down signiicantly on the work and time invol-ved in processing the data, besides reducing the occurrence of errors in transferring data and in calculations.
incubation temperature of 37 ºC and apramycin sulfate as the reference standard. The culture medium employed contains dextrose, tryptone and yeast extract (British Pharmacopoeia, 2008). The microplate assay has advan-tages over the conventional turbidimetric assay in that the smaller amount of material involved in the test, shorter incubation time to obtain responses and operational sim-plicity (incubation and readings performed simultaneously on the same equipment).
Determination of the potency of apramycin can also be performed by the agar diffusion method (plate assay), using a two-layer system employing Bacillus subtilis
(ATCC 6633) as the test microorganism and test solutions at concentrations ranging from 1 to 4 µg mL-1 (Lourenço et
al., 2011). Although the agar diffusion method has shown greater sensitivity, its incubation time is approximately 18 hours.
Chemical characteristics of aminoglycosides, parti-cularly of apramycin, hamper the development of chemical and physico-chemical methods suitable for its evaluation. The lack of chromophoric groups in its structure of amino-glycosides makes it necessary to employ derivatization re-agents (Isoherranen, Soback, 1999; Stead, 2000). Whereas the use of physico-chemical methods in the evaluation of samples of biological luids and exudates (blood samples, cerebrospinal luid and urine) in which the amount of anti-biotic is low has the limitation of lack of sensitivity of the methods. Chromatographic methods using luorescence detection are more sensitive and therefore suited for this purpose. For situations involving higher concentrations of antibiotic, liquid chromatography using UV detection can be an interesting option, particularly because it is more common and relatively inexpensive.
Study of optimization of derivatization conditions of amine groups present in apramycin employing O -phthaldialdehyde (OPA) in the presence of 2-mercapto-ethanol (luorescence detection) or mercaptoacetic acid (ultraviolet detection) showed that the utilization of the latter was more stable than the former. The results also veriied that the ideal proportion of OPA-apramycin is 5:1. The HPLC method employing OPA-mercaptoacetic acid derivatization showed good correlation to the conventional turbidimetric assay (Antunes et al. 2011).
The microplate assay employing the endpoint-reading mode showed better validation results than with the kinetic-reading mode (RT and AUC). Even when the antibiotic is assessed using the endpoint-reading mode, the reading of responses at set time intervals is useful, particu-larly in situations of method development, since it allows individual reading time to conigure an endpoint-assay.
Although the kinetic-reading (AUC) mode has
shown advantages regarding shorter incubation time, it demonstrated low precision (RSD = 32.6%) and limited linearity (r2 between 0.771 and 0.953). Nevertheless, the kinetic-reading (AUC) mode may be valuable in situations where the amount of antibiotic present in the sample co-vers a wide range of concentrations, being employed as a serial dilution test.
The use of the kinetic-reading (AUC) mode is use-ful since it shows the response curve based on microbial growth over a given timeframe and not only in terms of absorbance readings at a given point in time (endpoint-reading mode). The growth curves allow more consistent evaluation, establishing how the interaction between antibiotic and test microorganism occurs: the antibiotic reduces the generation time of the test microorganism and / or prolongs its lag phase. This information is valuable particularly for the study of new antibiotics and other substances that exhibit antimicrobial activity.
CONCLUSION
Both microbiological assays, microplate and agar diffusion methods, allow the evaluation of activity of the antibiotic against a sensitive test microorganism. This feature is particularly useful in cases where there is sus-picion of ineficiency or loss of antibiotic activity. The microplate assay has advantages in comparison to the agar diffusion method regarding operational simplicity, shorter incubation time, the possibility of analyzing a large num-ber of samples simultaneously, and the lower amount of reagents and culture media involved in the test. The high cost of the equipment needed for incubation and reading of microplates is the main disadvantage of the microplate assay in comparison to the agar diffusion method.
In comparison to the HPLC method, the main ad-vantage of microbiological tests, either by the microplate assay or agar diffusion method, concerns the ability to evaluate the activity of the antibiotic against a sensitive test microorganism Another advantage of the microplate assay over the HPLC method is being able to simultaneously analyse a large number of samples without increasing the time involved in the test. The lower precision and lower reproducibility however, constitute disadvantages of the microplate assay in comparison to the HPLC method.
REFERENCES
BAMBA, H. Assay for susceptibility of Helicobacter pylori to antibiotics using 96-well flat-bottom microplate and
microplate reader. Rinsho Kensa, v.41, n.1, p.101-106,
ANTUNES, E.A.B.; LOURENÇO, F.R.; PINTO, T.J.A. Determination of apramycin in oral soluble powder by a HPLC method using pre-column derivatization with
o-phthalaldehyde and UV detection. Braz. J. Pharm. Sci.,
v.47, n.2, p.261-268, 2011.
BARRET, J.M. Evaluation of DNA repair inhibition by antitumor or antibiotic drugs using a chemiluminescence
microplate assay. Carcinogenesis, v.18, n.12, p.2441-2445,
1997.
BOGIALLI, S., CURINI, R., CORCIA, A., LAGANÁ, A., MELE, M., NAZZARI, M. Simple confirmatory assay for analyzing residues of aminoglycoside antibiotics in bovine milk: hot water extraction followed by liquid
chromatography-tandem mass spectrometry. J. Chromatogr.
A, v.1067, n.1-2, p.93-100, 2005.
BOND, C.R., DAVIES, O.L. The microbiological assay of penicillin by the turbidimetric method, using Staphylococcus
aureus. Analyst, v.73, n.866, p.251-254, 1948.
BONTCHEV, P.R., PAPAZOVA, P., CONFINO, M., DIMOVA, D. Spectrophotometric method for determination of tobramycin, apramycin and kanamycin in formulations.
Mikrochim. Acta, v.3, n.5-6, p.459-465, 1984.
BORISEVICH, V. A highly sensitive and versatile vírus titration
assay in the 96-well microplate format. J. Virol. Methods,
v.147, n.2, p.197-205, 2008.
BRADY, M.S., KATZ, S.E. Turbidimetric assay for tetracyclines
in feeds using a microtiter plate system. J. Assoc. Off. Anal.
Chem., v.74, n.3, p.465-470, 1991.
BRITISH PHARMACOPOEIA (Veterinary). London: Her Majesty’s Stationery Ofice, 2008. 289 p.
BURTON, E. A microplate spectrofluorimetric assay for
bacterial bioilms. J. Ind. Microbiol. Biotechnol., v.34, n.1,
p.1-4, 2007.
COOPER, K.E. The theory of antibiotic inhibition zones. In:
KAVANAGH, F. Analytical microbiology. New York:
Academic Press, 1963. p.1-86.
FALK, C.R. Adaptation of antibiotic assay methods for routine
use. Am. J. Public Health, v.43, n.4, p.419-425, 1953.
FIELDING, J. A simple method of estimating penicillin and
other bacteriostatics. Br. Med. J., v.1, n.4490, p.136-137,
1947.
FLEMING, A. Micromethods of estimating penicillin in blood
serum. Lancet, v.247, n.6324, p.620-621, 1944.
FLEMING, A. Estimation of penicillin in serum use of glucose,
phenol red, and serum water. Lancet, v.252, n.6448,
p.401-402, 1947.
FOSTER, J.W., WOODRUFF, H.B. Microbiological aspects
of penicillin. I. Methods of assay. J. Bacteriol., v.46, n.5,
p.187-202, 1943.
HERMANN, T., TERESHKO, V., SKRIPKIN, E., PATEL, D.J. Apramycin recognition by human ribosomal decoding site.
Blood Cells Mol. Dis., v.38, n.3, p.193-198, 2007.
HEWITT, W. Microbiological assay: an introduction to
quantitative principles and evaluation. New York: Academic Press, 1977. 284 p.
HOLOWACHUK, S.A. A kinetic microplate method for quantifying the antibacterial properties of biological luids.
J. Microbiol. Methods, v.55, n.2, p.441-446, 2003.
ISOHERRANEN, N., SOBACK, S. Chromatographic Methods
for Analysis of Aminoglycoside Antibiotics. J. AOAC Int.,
v.82, n.5, p.1017-1045, 1999.
JOSLYN, D.A. Penicillin assay. Outline of four-hour
turbidimetric method. Science, v.99, n.2558, p.21-22, 1944.
JOSLYN, D.A., GALBRAITH, M. A turbidimetric method for
the assay of antibiotics. J. Bacteriol., v.59, n.6, p.711-716,
1950.
KAVANAGH, F. Elements of photometric assaying. In:__.
Analytical microbiology. New York: Academic Press, 1963. p.141-217.
KAVANAGH, F. Photometric assaying. In:__. Analytical
microbiology. New York: Academic Press, 1972. v. II, p.43-121.
LAMAR, J., PETZ, M. Development of a receptor microplate assay for detection of beta-lactam antibiotics in different
food matrices. Anal. Chim. Acta, v.586, n.1-2, p.296-303,
LETHINEN, J. Real-time monitoring of antimicrobial activity
with the multiparameter microplate assay. J. Microbiol.
Methods, v.66, n.3, p.381-389, 2006.
LOURENÇO, F.R.; BARBOSA, E.A.; PINTO, T.J.A.
Microbiological assay for apramycin soluble powder. Lat.
Am. J. Pharm., v.30, n.3, p.554-557, 2011.
LOVERING, A.M., WHITE, L.O., REEVES, D.S. Identiication of aminoglycoside - acetylating enzymes by high pressure liquid chromatographic determination of their reaction
products. Antimicrob. Agents Chemother., v.26, n.1,
p.10-12, 1984.
LOY, H.W., WRIGHT, W.W. Microbiological assay of amino acids, vitamins and antibiotics. Application of tube methods.
Anal. Chem., v.3l, n.6, p.971-974, 1959.
MARTINDALE. The complete drug reference. 35.ed. London:
Ed. Pharmaceutical Press, 2007. 3322pp.
MAYO, L.A., CURNUTTE, J.T. Kinetic microplate assay for superoxide production by neutrophilis and other phagocytic
cells. Methods Enzymol., v.186, n. 59, p.567-575, 1990.
MCMAHAN, J.R. An improved short time turbidimetric assay
for penicillin. J. Biol. Chem., v.153, n.1, p.249-158, 1944.
MEGOULAS, N.C., KOUPPARIS, M.A. Development and validation of a novel HPLC/ELSD method for the direct determination of tobramycin in pharmaceuticals, plasma
and urine. Anal. Bioanal. Chem., v.382, n.2, p.290-296,
2005.
O’CONNOR, S., LAM, L.K.T., JONES, N.D., O.CHANEY,
M. Apramycin, a unique aminocyclitol antibiotic. J. Org.
Chem., v.41, n.12, p.2087-2092, 1976.
PERZYNSKI, S., CANNON, M., CUNDLIFE, E., CHAHWALA, S.B., DAVIES, J. Effects of apramycin, a novel aminoglycoside antibiotic on bacterial protein
synthesis. Eur. J. Biochem., v.99, n.3, p.623-628, 1979.
PETTIT, R.K. Microplate alamar blue assay for Staphylococcus
epidermidis biofilm susceptibility testing. Antimicrob.
Agents Chemother., v.49, n.7, p.2612-2617, 2005.
PINTO, T.J.A., KANEKO, T.M., OHARA, M.T. Controle
biológico de qualidade de produtos farmacêuticos, correlatos e cosméticos. São Paulo: Atheneu, 2003. 325 p.
POLTA, J.A., JOHNSON, D.C., MERKEL, K.E. Liquid chromatographic separation of aminoglycosides with
pulsed amperometric detection. J. Chromatogr., v.324, n.
2, p.407-414, 1985.
RAMMELKAMP, C.H. A method for determining the concentration of penicillin in body luids and exsudates.
Proc. Soc. Exp. Biol. Med., v.51, n.1, p.95-97, 1942.
SERRANO, J.M., SILVA, M. Rapid and sensitive determination of aminoglycoside antibiotics in water samples using a strong cation-exchange chromatography non-derivatisation
method with chemiluminescence detection. J. Chromatogr.
A, v.1117, n.2, p.176-183, 2006.
SMITH, S.M. An enhanced miniaturized assay for antimicrobial
prospecting. J. Microbiol. Methods, v.72, n.1, p.103-106,
2008.
STEAD, D.A. Current methodologies for the analysis of
aminoglycosides. J. Chromatogr. B, v.747, n.1-2, p.69-93,
2000.
SWEENEY, D.J., COLEMAN, M.R. Determination of apramycin in swine kidney tissue by liquid chromatography
with luorescence detection. J. AOAC Int., v.81, n.6,
p.1141-1145, 1998.
TAMURA, H. Methodological and clinical evaluation of a
microplate assay of endotoxin in whole blood sample. Igaku
no Ayumi, v.38, n.12, p.1341-1346, 1990.
TAMURA, H. Sensitive microplate method for plasma
endotoxin assay. Igaku no Ayumi, v.158, n.4, p.227-228,
1991.
TAMURA, H. A new sensitive microplate assay of plasma
endotoxin. J. Clin. Lab. Anal., v.6, n.4, p.232-238, 1992.
TAMURA, H. A new kinetic automated microplate assy of
endotoxin and (13)-β-D-glucan. Igaku no Ayumi, v.166,
n.12, p.811-812, 1993.
TATSUTA, K., AKIMOTO, K., TAKAHASHI, H., HAMATSU, T., ANNAKA, M., KINOSHITA, M. Total synthesis of aminoglycoside antibiotics, apramycin and saccharocin
(KA-5685). Chem. Soc. Japan, v.57, n.2, p.529-538, 1984.
WALTON, J.R. Apramycin, a new aminocyclitol antibiotic. I. In
vitro microbiological studies. J. Antimicrobiol. Chemoth.,
YAMAMOTO, C.H. Aspectos da qualidade da tetraiclina em preparações farmacêuticas sólidas. Correlação entre os métodos de dosagem por cromatografia líquida de alta eiciência e tubidimétrico. São Paulo, 1999. 277 p. [Thesis of PhD degree. Faculty of Pharmaceutical Sciences, University of São Paulo].
ZHANG, L., WANG, Z., CHANG, B., YANG, W. Determination of Apramycin in Animal Feeds by Solid-Phase Extraction and Liquid Chromatography with Precolumn Derivatization
and Fluorescence Detection. J. AOAC. Int., v.90, n.4,
p.885-891, 2007.
ZHONG, G., SMITH, G.P. Kinetic microplate assay of titering
microbial cells. BioTechiques, v.16, n.5, p.838-839, 1994.
Received for publication on 4th November 2010