Vol. 51, n. 3 : pp.447-451, May-June 2008
ISSN 1516-8913 Printed in Brazil BRAZILIAN ARCHIVES OF
BIOLOGY AND TECHNOLOGY
A N I N T E R N A T I O N A L J O U R N A L
Spectrophotometric Determination of Tannins and Caffeine
in Preparations from
Paullinia cupana
var.
sorbilis
Maria Inez de Godoy Pelozo, Mara Lane Carvalho Cardoso and João Carlos Palazzo de Mello*
Programa de Pós-Graduação em Ciências Farmacêuticas; Departamento de Farmácia e Farmacologia; Universidade Estadual de Maringá; Av. Colombo, 5790; 87.020-900; mello@uem.br; Maringá - PR - Brazil
ABSTRACT
The present work was designed to quantify the caffeine and total polyphenols in the extractive solution and the granulated form from the seeds of Paullinia cupana var. sorbilis, by the spectrophotometric method. The method showed linearity for the caffeine and polyphenols in the range of 5-25 µg/ml and 2.4-5.6 µg/ml respectively. The solutions of the semipurified fraction (EPA) and granulated form (GRA) showed linear responses in the range of 0.288-0.672 and 0.4-1.2 µg/ml, respectively. The precision and accuracy were determined for the EPA solution at a concentration of 100 µg/ml. The spectrophotometric method performed well in quantifying the caffeine and total polyphenols.
Key words:Caffeine, Paullinia cupana, Total polyphenols, Spectrophotometric quantification assay
*
Author for correspondence
INTRODUCTION
The seeds from Paullinia cupana var. sorbilis
(guaraná), a plant native to the Amazon region, are popularly used as a brain-function stimulant, aphrodisiac, tonic, diuretic, and sedative, among others (Henman, 1982; Duke, 1985). Reports have shown that the extracts from its powdered seeds show antioxidant (Ushirobira, 2003; Mattei et al., 1998), antiplatelet (Bydlowski et al., 1988), antifatigue (Espínola et al., 1997) and antidepressant activities (Otobone et al., 2005). The analyses of P. cupana demonstrated that the caffeine (Henman, 1982; Corrêa, 1984; Ushirobira, 2003; Bempong et al., 1993; Andrade, 1996) and condensed tannins such as flavan-3-ol and procyanidins (Ushirobira, 2003; Andrade, 1996; Carlson et al., 1998) were the main constituents of the extracts from its seeds. The
granulated form (GRA), obtained from the dried and crushed guaraná seeds.
MATERIAL AND METHODS
Chemicals and reagents
The following reagents were used: Folin-Ciocalteau 2 mol l-1 (Laborclin) reagent, 14.06% sodium carbonate solution (w/v), and 2.5% sulfuric acid solution (v/v). Pyrogallol (Merck) and caffeine (Merck) were used as the external standards.
Apparatus
A Cary 1E Varian UV-VIS Spectrophotometer was used.
Calibration curves
The pyrogallol standard was dissolved at 10 mg/100 ml in water. Five dilutions were prepared: 0.03, 0.04, 0.05, 0.06, and 0.07 mg/ml. From each dilution, 2.0 ml was removed and transferred to a volumetric balloon (25.0 ml), to which 10.0 ml of distilled water, 1.0 ml of Folin-Ciocalteau reagent, and calcium carbonate solution (14.06%, w/v) were added, yielding the concentrations of 2.4, 3.2, 4.0, 4.8, and 5.6 µg/ml. This process was carried out with the protection from light. The reading was done after 15 min at 740 nm, using distilled water as the compensation solution. The assay was repeated three times, and the curves were fitted by the linear regression.
The caffeine standard was prepared by dissolving in sulfuric acid solution (2.5%, v/v), yielding concentrations of 5.0, 10.0 15.0, 20.0, and 25.0 µg/ml, and analyzed at 271 nm, employing sulfuric acid solution (2.5%, v/v) as the compensation solution. The assay was repeated three times, and the curves were fitted by the linear regression.
Preparation and analysis of the extractive and granulated form
Preparation of the extractive solution
The extractive solution was prepared by partitioning 50.0 g of the crude extract lyophilized from the powder of the crushed seeds (Patent pending PI#0006638-9-Brazil; http://www.inpi.gov.br). The semipurified fraction was concentrated, lyophilized, and then dissolved in the water, yielding concentrations of 0.192,
0.288, 0.384, 0.48, 0.576, 0.672, 0.768, 0.864, 0.96, and 1.056 µg/ml.
Preparation of a solution of the granulated form
The granulated form was prepared from the semipurified suspension (humid process) employing the Aerosil 200®: talc (1:1, w/w) as a pharmaceutical adjuvant. To each 50.0 g of the suspension 2.0 g of adjuvant was added. The aqueous granulated solution was prepared and filtered through #1 filter paper (Whatman, UK), yielding the concentrations of 0.4, 0.6, 0.8, 1.0, 1.2, 1.4, 1.6, 1.8, 2.0, and 2.2 µg/ml.
Validation
The linearity was determined for the calibration curves obtained by the spectrophotometric analyses of the pyrogallol and caffeine for the extractive (EPA) and granulated (GRA) solution curves. The range of the appropriate amount of the samples was determined. The slope and other statistics of the calibration curves were calculated by the linear regression. The linearity was tested by the ANOVA and the residual analyses (Montgomery,1991).
The detection limit (DL) and quantification limit (QL) were calculated based on the standard deviation (S.D.), and the slope (S) of the calibration curves (Brasil, 2003). The precision of the method was determined following the ANVISA guidelines (Brasil, 2003). For the evaluation of the repeatability, the S.D. and residual standard deviation (R.S.D.) of three analyses were considered. The accuracy was determined by the recovery, adding the measured amounts of the pyrogallol and caffeine to the extractive solutions. The recovery experiment was performed at three concentration levels. The recovery was determined by subtracting the values obtained from those samples that were prepared with the added standards, dividing by the amount added, and then multiplying by 100 (Brasil, 2003).
RESULTS AND DISCUSSION
This work reports the standardization of a method, based on the spectrophotometric determination for the assay of the caffeine and polyphenol in an extract and the granulated form of the seeds of P.
cupana. The tests of the accuracy, precision,
to validate the analytical methods according to the ANVISA guidelines (Brasil, 2003). The type of the method and its respective use determine which parameters should be evaluated, especially when the samples are complex matrices, as in the case of solutions of plant extracts.
The linearity of the method was investigated for the pyrogallol in the range 2.4-5.6 µg/ml, and for the caffeine in the range 5-25 µg/ml, both at five concentration levels. The linearity of the method was also investigated by employing different amounts of the extractive and granulated solutions, obtaining three calibration curves. The calibration curves for the pyrogallol and caffeine were linear in the range of 2.4-5.6 µg/ml and 5-25 µg/ml, respectively, with the excellent correlation coefficients (r). The representative linear equations for the pyrogallol and caffeine were y =
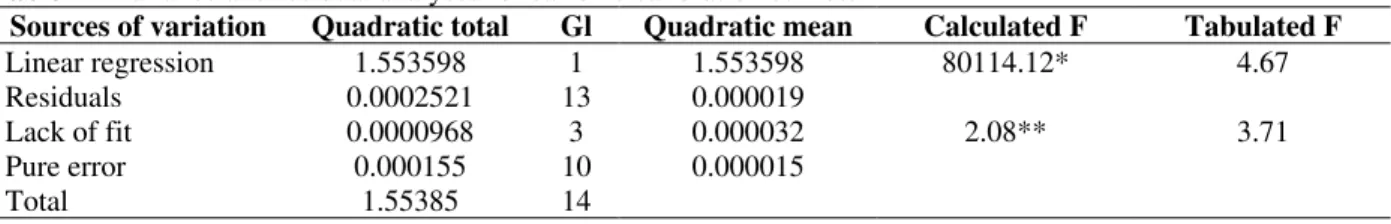
0.0224 + 0.14782x (n= 3, r= 0.9966) and y= 0.0012 + 0.0455x (n= 3, r= 0.9999) respectively. The linearity was confirmed by the residual analyses, as shown in Tables 1 and 2. The R.S.D.s of the slope of three lines were 1.31 and 0.78 % respectively.
The detection limits, taken as the lowest absolute concentration of the analyte in a sample which could be detected but not necessarily quantified under the stated experimental conditions were 0.21 and 0.18 µg/ml for the pyrogallol and caffeine respectively. The limits of the quantification, taken as the lowest concentration of the analyte in a sample which could be determined with the acceptable precision and accuracy, were 0.69 and 0.59 µg/ml for the pyrogallol and caffeine respectively.
Table 1 - Variance and residual analyses for pyrogallol calibration curves.
Sources of variation Quadratic total Gl Quadratic mean Calculated F Tabulated F
Linear regression 0.419539 1 0.419539 1900.020* 4.67
Residuals 0.002871 13 0.000221
Lack of fit 0.001877 3 0.000625 6.29** 6.55
Pure error 0.000994 10 0.000099
Total 0.422410 14
Explained variation: 99.32%
Maximum explicable variation: 99.76%
*Significant for α< 0.05; **Not significant for α< 0.01
The selectivity of the method and the interference from the adjuvant were evaluated by a spectrophotometry scan of the EPA and GRA solutions with the Folin-Ciocalteau reagent. Both the solutions showed an absorbance peak at 740 nm, the same peak obtained for the pyrogallol solution. Considering that the plant samples were
complex matrices, and also considering the associations of the adjuvant pharmaceutics in the granulated form, the presence of interference was possible. Therefore, the extractive and granulated solution curves were used to determine the sample amounts of the EPA and GRA, where the linearity was observed in terms of the pyrogallol.
Table 2 - Variance and residual analyses for caffeine calibration curves.
Sources of variation Quadratic total Gl Quadratic mean Calculated F Tabulated F
Linear regression 1.553598 1 1.553598 80114.12* 4.67
Residuals 0.0002521 13 0.000019
Lack of fit 0.0000968 3 0.000032 2.08** 3.71
Pure error 0.000155 10 0.000015
Total 1.55385 14
Explained variation: 99.98%
Maximum explicable variation: 99.99%
*Significant for α< 0.05; **Not significant for α< 0.05
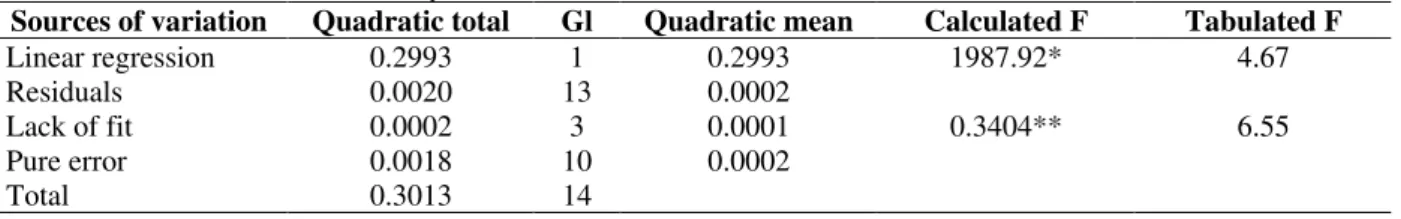
The calibration curves for the EPA and GRA were linear in the range 0.288-0.672 µg/ml and 0.4-1.2 µg/ml respectively, with acceptable correlation
0.4994x (n=3, r= 0.9967) respectively. The linearity of the method was confirmed by the residual analyses as shown in Tables 3 and 4, which explained 99.55 and 99.35% of the variation (r²), respectively. The R.S.D.s of the slope of three lines were 1.61 and 2.24% for the analyses of the EPA and GRA solutions respectively.
The detection limits under the stated experimental conditions were 0.03 and 0.06 µg/ml for the EPA and GRA solutions respectively. The limits of the quantification determined with the acceptable precision and accuracy were 0.09 and 0.19 µg/ml for the EPA and GRA solutions respectively.
Table 3 - Variance and residual analyses for EPA calibration curves.
Sources of variation Quadratic total Gl Quadratic mean Calculated F Tabulated F
Linear regression 0.182442 1 0.182442 2909.87* 4.67
Residuals 0.001782 13 0.000137
Lack of fit 0.001175 3 0.0003917 6.46** 6.55
Pure error 0.000607 10 0.000061
Total 0.183257 14
Explained variation: 99.55%
Maximum explicable variation: 99.67%
*Significant for α< 0.05; ** Not significant for α< 0.01
Table 4 - Variance and residual analyses for GRA calibration curves.
Sources of variation Quadratic total Gl Quadratic mean Calculated F Tabulated F
Linear regression 0.2993 1 0.2993 1987.92* 4.67
Residuals 0.0020 13 0.0002
Lack of fit 0.0002 3 0.0001 0.3404** 6.55
Pure error 0.0018 10 0.0002
Total 0.3013 14
Explained variation: 99.35%
Maximum explicable variation: 99.41%
* Significant for α< 0.05; ** Not significant for α< 0.01
The accuracy of the method for the assay analysis of the recovery was determined by preparing the samples by adding the pyrogallol and caffeine standards to the EPA solution. The observed percent recoveries were 102.45, 103.02, and 97.02% for the pyrogallol, and 98.73, 98.16, and 98.49% for the caffeine standard. The solution curves for the semipurified fraction (EPA) and the granulated form (GRA) showed linear responses in the range of 0.288-0.672 µg/ml and 0.4-1.2 µg/ml, respectively in terms of the pyrogallol. The precision was demonstrated for all the analyses. The accuracy was demonstrated for the EPA solutions by recovering the amounts of the caffeine and pyrogallol.
The analytical methods employed conformed to the ANVISA requirements in showing the specificity, sensitivity, precision, and accuracy for the indicated interval. The methodologies for the determination of the caffeine and polyphenols
were suitable for quality control of the EPA and the granulated form.
ACKNOWLEDGEMENTS
We thank the PROAP/CAPES and the Programa de Pós-Graduação em Ciências Farmacêuticas for financial support, and Admir Arantes and Cláudio Roberto Novello for technical support.
RESUMO
validados. O trabalho objetivou quantificar cafeína e polifenóis totais em soluções extrativas e no granulado obtidos das sementes de P. cupana var.
sorbilis através de método espectrofotométrico. O
método apresentou linearidade para a cafeína e polifenóis no intervalo de 5-25 µg/ml e 2,4-5,6 µg/ml, respectivamente. Soluções da fração semipurificada (EPA) e do granulado (GRA) mostraram resposta linear no intervalo de 0,288-0,672 µg/ml e 0,4-1,2 µg/ml respectivamente. A precisão e exatidão foram determinadas para a solução de EPA na concentração de 100 µg/ml. O método espectrofotométrico obteve um bom desempenho na quantificação de cafeína e polifenóis totais, uma vez que a presença de interferentes foi previamente avaliada.
REFERENCES
Andrade, L. (1996), Estudo da metodologia de análise da droga vegetal guaraná. M.Sc. Dissertation, Universidade Federal do Rio Grande do Sul, Porto Alegre, Brazil.
Basile, A.; Ferrara, L.; Del Pezzo, M.; Mele, G.; Sorbo,. Bassi, P.; Montesano, D. (2005), Antibacterial and antioxidant activities of ethanol extract from
Paullinia cupana Mart. J. Ethnopharmacol., 102, 32-36.
Bempong, D. K.; Houghton, P. J.; Steadman, K. (1993), The xantine content of guarana and its preparations.
Int. J. Pharm., 31, 175-181.
Brasil. (2003), Anvisa, Resolução Específica n. 899 de 29.05.2003. Diário Oficial da União, Brasília, Brazil Bydlowski, S. P.; Yunker, R. L.; Subbiah, M. T. R.
(1988), A novel property of an aqueous guarana extract (Paullinia cupana): inhibition of platelet aggregation in vitro and in vivo. Braz. J. Med. Biol. Res., 21, 535-538.
Carlson, M.; Thompson, R. D. (1998), Liquid chromatographic determination of methylxantines and catechins in herbal preparations containing guarana. J. Assoc. Off. Anal. Chem., 81, 691-701. Corrêa, M. P. (1984), Dicionário de plantas úteis do
Brasil, Imprensa Nacional, Rio de Janeiro, pp. 545-555.
Duke, J. A. (1985), Handbook of medicinal herbs, CRC, Florida.
Espínola, E. B.; Dias, R. F.; Mattei, R.; E.A. Carlini, E. A. (1997), Pharmacological activity of Guaraná (Paullinia cupana Mart.) in laboratory animals. J. Ethnopharmacol., 55, 223-229.
Farmacopéia Brasileira. (2003), fourth ed., Atheneu, São Paulo.
Henman, A. R. (1982), Guarana (Paullinia cupana var.
sorbilis): ecological and social perspectives on an economic plant of the central amazon basin. J. Ethnopharmacol., 6, 311-338.
Marx, F. (1990), Analysis of guaraná seeds. II. Studies on the composition of the tannin fraction, Z. Lebensm. Unters. Forsch., 190, 429-431.
Mattei, R.; Dias, R. F.; Espínola, E. B.; Carlini, E. A.; Barros, S. B. (1998), Guarana (Paullinia cupana): toxic behavioral effects in laboratory animals and antioxidants activity in vitro. J. Ethnopharmacol., 60, 111-116.
Montgomery, D. C. (1991), Diseño y analises de experimentos, Iberoamérica, México.
Nierestein, M. (1922), Catechutannins: Paullinia
tannin, J. Chem. Soc., 121, 23-28.
Otobone, F. J.; Sanches, A. C.; Nagae, R. L.; Martins, J. V. C.; Obici, S.; de Mello, J. C. P.; Audi, E. A. (2005), Effect of crude extract and its semi purified constituents from guaraná seeds [Paullinia cupana
var. sorbilis (Mart.) Ducke]on cognitive performance in Morris Water Maze in Rats. Arch. Biol. Technol.,
48, 723-728.
Ushirobira, T. M. A. (2003), Estudo químico, avaliação microbiológica e toxicológica pré-clínica (aguda e subcrônica) de extratos de sementes de Paullinia cupana H.B.K. var. sorbilis (Mart.) Ducke (Guaraná). M.Sc. Dissertation, Universidade Estadual de Maringá, Maringá, Brazil.