Journal of Social Sciences 2 (4): 89-92, 2006 ISSN 1549-3652
© 2006 Science Publications
Corresponding Author: Anastasios Michailidis, Department of Agricultural Economics, School of Agriculture, Aristotle University of Thessaloniki, 541 24 Thessaloniki, P.O. Box 225, Thessaloniki, Greece, Tel: (+30) 2310998807, Fax: (+30) 2310998828
89
Determining Relationships Among the Adoption Parameters of Computers and
Internet in Agriculture: An Application of Probit Model
Anastasios Michailidis
Department of Agricultural Economics, School of Agriculture, Aristotle University of Thessaloniki 541 24 Thessaloniki, P.O. Box 225, Thessaloniki, Greece
Abstract: The main reason for carrying out this study was to determine possible relationships among several adoption parameters of computer use, internet usage and internet access in agriculture. The key options for determining relationships (apart from non-parametric correlation techniques) are canonical correlation analysis, probit models and logit models.Canonical correlation analysis is generally seen as a weaker statistical technique than probit or logit models. The number of categorical variables in the data set made it difficult to fit logit models. So, the left probit models are the preferred techniques for testing the research question. To address the research question survey data was collected. Producers were asked to rank, in turn, how important computers and internet usage were to their business. These rankings could then be tested against other variables collected in order to determine whether it was the cost reduction or the productivity enhancing activities that were significant in explaining the rankings.
Key words: Internet, adoption, computers, farms, probit models
INTRODUCTION
Agriculture is a forgotten sector in the debate about the contribution of information technology to economic growth. For example, most studies of productivity changes in an economy focus on the non-farm sector[1,2]. Information technology applications allow not just direct productivity changes, but also organisational changes, marketing and consumer relationship changes and better control over supply chain management, because the greatest benefits from adoption of information technology have tended to be at the manufacturing and service industry levels[1].
Identifying why farmers in Greece take up information technology is important for two reasons. The first is that if productivity can be improved from using information technology, this might be an important way of achieving further growth in agriculture. Determining where opportunities lie for productivity gains, how they might be achieved and what are the barriers and triggers for take-up of information technology are important questions related to this issue. The second issue is about the net benefits that might be expected from adopting information technology. There is a large political debate about the provision of appropriate information technology services to rural and regional areas and the appropriate level of public funding (Government expenditure), quasi-public funding (community service obligations by telecommunications providers) and private funding. Estimates of the level of benefits and costs will be important to help provide information about the likely
demand for information technology services and the efficient use of public funding.
These goals are not easily achievable. First, measurement of e-commerce and e-business activities and information technology contributions are very difficult[3]. Most national statistics are collected on an industry basis and do not identify the contribution of particular components. It is difficult to identify transactions that occurred electronically, or to apportion actions and transactions that have an electronic component. Second, many of the benefits and costs relating to information technology are not priced in markets. Non-priced benefits range from many free products available on the Internet to the social benefits in isolated areas of gaining e-mail access. Non-priced costs include the additional time spent on solving problems and the potential for harmful events like virus infections or data loss.
The main reason for carrying out this study was to determine possible relationships among several adoption parameters of computer use, internet usage and internet access in agriculture, in a particular region in Northern Greece. The case study focused on broadscale cropping and agricultural industries, which tend to be small business enterprises supplying generic markets and not be highly specialised in production. As a consequence, these industries could be expected to be at the low end of demands and uptake for information technology services.
J. Social Sci., 2 (4): 89-92, 2006
90 and Internet use was providing more benefits in the form of reduced operating costs (including non-financial ones), or in the form of increasing productivity. The latter might occur in several ways, through items such as better management, improved application of technology, or new opportunities for marketing. If the key purpose of information technology was to replace labour, then its penetration and use in agriculture is likely to be limited. If the key purpose is to improve management and productivity, then the net benefits of adoption are likely to be much higher.
Survey data was collected to address the research question. Producers were asked to rank, in turn, how important computers and Internet usage were to their business. These rankings could then be tested against other variables collected in order to determine whether it was the cost reduction or the productivity enhancing activities that were significant in explaining the rankings. The self-assessment approach implicit in the survey was used for two main reasons. The first was that specific case study information on applications and adoption on information technology in the region of interest was not available. The second was that a large proportion of costs and benefits involved are non-financial ones (i.e., improved social communication) and personal assessment allows these factors to be considered.
In the survey, respondents were asked a series of questions about their use of computers and the Internet, as well for information about their enterprise and some demographic and attitudinal information. The key questions were about how they rated the value of computer use and Internet use in their business according to a number of factors such as use of accountancy records and use of online banking. In order to encourage participation and minimise the cognitive burden on respondents, most questions were framed with Likert scale intervals, where respondents could tick the category that best suited their operation.
The list of potential respondents was compiled from several sources. These comprised lists of members of several cooperatives and lists of grains and beef producers. The beef producers were taken from the region of Western Macedonia and could include any producer with greater than 11 head. The grains producers were supplied by a grain Extension Officer and were sourced from a list of producers. Participants were selected at random from the compiled lists. The survey was collected through a mail-out/telephone response format. All surveys were mailed out in batches of 20 per week from October to December 2005. Respondents were contacted by telephone in the following week and asked if they would like to participate. Respondents could either complete the forms in their own time and return them by post, or could give the answers to the interviewer over the telephone. One of the researchers and a
research assistant performed the mail-out and the telephone interviews.
By January 2006, 100 responses had been received from 350 surveys issued. There were another 20% of respondents who indicated that they did not own a computer and that the survey was not relevant to them, giving an overall response rate of 48.5%.
Probit model: The survey data generated mostly nominal and ordinal data. For the purpose of testing the research question and statistical analysis, the variables of interest, including the dependent variables, were ordinal. This restricts the pool of statistical techniques that may be used to construct relationships between the variables. The key options for determining relationships (apart from non-parametric correlation techniques) are canonical correlation analysis, probit models and logit models.Canonical correlation analysis is generally seen as a weaker (or last resort) statistical technique than probit or logit models[4]. The number of categorical variables in the data set made it difficult to fit logit models. This left probit models as the preferred technique for testing the research question.
The probit model was established by creating binary dependent variables for respondent perceptions about the values of computer usage and Internet usage to their businesses. Two options were created for each dependent variable. Under the first option, all the ‘high’ and ‘very high’ responses were combined into one response (‘high value’) and the ‘medium’, ‘low’ and ‘none’ responses were combined into the other response (‘low value’). Under the second option, only the ‘very high’ responses formed the first value (‘very high’), while the other responses formed the second value (‘other’).
Under the probit model, choices between one of the two options available are described in terms of significant independent variables. Results of a probit analysis generate a variate of coefficients similar to a multiple regression exercise. A least-squares regression exercise is used to generate starting values and then a bootstrapping procedure used to generate the probit model. Log-likelihood and χ2 statistics (for testing model significance) are also generated.
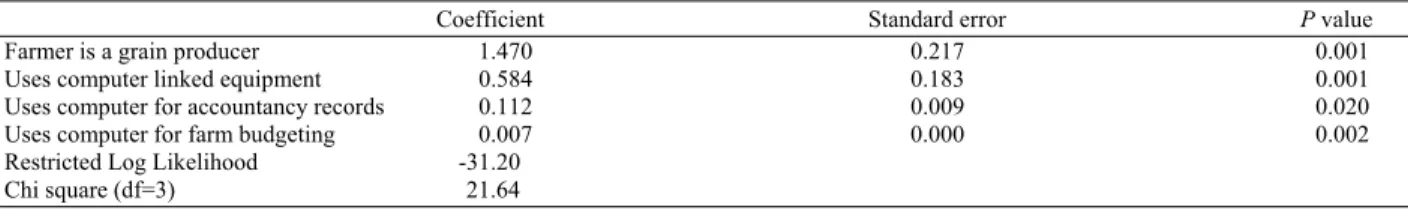
Two probit models for predicting values for computer use are reported below. In the first model (Table 1), the ‘high value’ of computer use was significantly related to four variables. Grain producers and those using computer linked equipment, accountancy packages and farm budgeting were more likely to rank computers as being of high value.
J. Social Sci., 2 (4): 89-92, 2006
91
Table 1: Probit model modelling ‘high value’ and ‘low value’ computer use
Coefficient Standard error P value
Farmer is a grain producer 1.470 0.217 0.001
Uses computer linked equipment 0.584 0.183 0.001
Uses computer for accountancy records 0.112 0.009 0.020
Uses computer for farm budgeting 0.007 0.000 0.002
Restricted Log Likelihood -31.20
Chi square (df=3) 21.64
Table 2: Probit model modelling ‘very high value’ and ‘other value’ computer use
Coefficient Standard error P value
Intercept -2.934 1.149 0.012
Farmer is a cattle producer 1.723 0.628 0.001
Uses computer linked equipment 0.689 0.394 0.072
Age of computer 0.374 0.126 0.003
Uses production records -0.002 0.001 0.006
Uses computer for farm budgeting 0.001 0.001 0.001
Uses computer for word processing 0.003 0.001 0.019
Value of Internet usage to farm 0.001 0.001 0.017
Restricted Log Likelihood -42.28
Chi square (df=12) 36.68
Table 3: Probit model modelling ‘high value’ and ‘low value’ Internet usage
Coefficient Standard error P value
Intercept -8.145 2.146 0.009
Cattle producer -2.734 1.567 0.033
Job off-farm -3.112 1.245 0.013
Days/weeks access Internet 0.643 0.198 0.005
Value of e-mail usage 2.220 0.634 0.008
Value of weather information -1.423 0.832 0.011
Value of market information -0.648 0.512 0.007
Value of better information form Internet 1.723 0.432 0.001
Advantage of less paper work 1.088 0.625 0.001
Advantage of faster response time 1.712 0.324 0.004
Restricted Log Likelihood -44.98
Chi square (df=7) 51.20
Table 4: Probit model modelling ‘very high value’ and ‘other value’ Internet access
Coefficient Standard error P value
Intercept -14.125 6.342 0.002
Days/weeks access Internet 1.882 0.533 0.006
Value of weather information -3.003 1.054 0.005
Value of technical information 2.442 1.003 0.005
Value of electronic banking 1.224 0.566 0.012
Value of social and recreational use 0.042 0.289 0.064
Restricted Log Likelihood -18.86
Chi square (df=3) 31.24
Assurance records. There was also a negative constant value in the model, indicating that there were other unspecified variables impacting on the choices made.
It is notable that use of computers for accountancy purposes only emerges as significant for high value usage and not for very high value usage. In contrast, using computers for budgeting is significant for both models. Budgeting may be a traditional activity that primary producers have automated with computer use. It may also be a newer management tool that has been more recently adopted with the aid of information technology. Both explanations have some validity, making it difficult to test the research question. However, to the extent that budgeting activities can be associated with new and improved management, it would appear that the benefits of computer use are moving from the cost minimisation phase towards improved management and production phases.
J. Social Sci., 2 (4): 89-92, 2006
92 The results of the ‘high value/low value’ model (Table 3) indicate that the groups most likely to put a low value on Internet use are cattle producers, those with jobs off-farm and those who want weather and market information. The groups that are most likely to put a high value on Internet use are those who access the Internet more frequently each week, those who rate e-mail highly, see that it provides more timely and better information for decision making, want less paperwork and want a faster response time for ordering goods in.
The results of the ‘very high/other value’ model (Table 4) indicate that respondents with a high value for weather information are less likely to put a high value on Internet use. The groups most likely to put a high value on Internet use are those with higher rates of access and those who put a high value on technical information, electronic banking and social and recreational uses.
It appears from these results that the respondents who value Internet use highly are those who can be classified as wishing to improve their efficiency. It is unlikely that high value simply comes from accessing information more easily, such as information about the weather or markets. Actions that save time and effort, such as electronic banking or ordering goods to speed up delivery time appear to be key components in providing value. The significance of technical information may suggest the importance of Internet access in increasing productivity in some businesses, while the importance of social and recreational uses highlight that these values are also important.
CONCLUSION
In this study, survey information from primary producers in Western Macedonia has been analysed with probit models to identify factors that are associated with perceptions of value for computer use and Internet access. The key goal was to identify whether benefits could be associated mainly with the reduction of costs or increases in productivity in agricultural enterprises.
While most enterprises surveyed use computers for financial accounting purposes, there were mixed results for this variable as an explanator for perceptions of value about computer usage. The variable emerged as significant when explaining ‘high value’ categorisations, but not significant for the ‘very high’ category. This suggests that primary producers who perceive most value in computer usage are moving
beyond the cost-minimisation applications such as financial packages. Other factors that were significant in explaining ‘very high’ value responses were the use of budgeting programs, computer-linked equipment and the Internet. To the extent that these variables can be associated with new and improved management, it would appear that the benefits of computer use are moving from the cost minimisation phase towards improved management and production phases. This will lead to computers being used to achieve production gains.
With regard to Internet usage, respondents to the survey were not generally able to identify either cost or time savings or production gains resulting from access. However, the statistical analysis did identify that high value rating for Internet access did appear to be associated with the use of technical information, electronic banking and social and recreational uses. It appears that the value of the Internet is not necessarily in replacing other means for sourcing information, such as about the weather. Some value comes from making processes more efficient, as in the use of electronic banking services or ordering goods on-line. Some value comes from providing better access to information (especially technical information).
On the other hand extension programs and materials should be developed that take into consideration the low level of computer and internet acceptance among farmers. In Greece, the extension services have very few skilled extension workers. To reach farmers, more extension workers should be trained and their visits to these areas should be supported.
REFERENCES
1. Brynjolfsson, E. and L.M. Hitt, 2000. Beyond computation: Information technology, organizational transformation and business performance. J. Econ. Persp., 14: 23-48.
2. Oliner, S.D. and D.E. Sichel, 2000. The resurgence of growth in the late 1990s: Is information technology the story? J. Econ. Persp., 14: 3-22. 3. Fraumeni, B., 2001. E-commerce: Measurement
and measurement issues. Am. Econ. Rev., 91: 318-322.