www.biogeosciences.net/12/961/2015/ doi:10.5194/bg-12-961-2015
© Author(s) 2015. CC Attribution 3.0 License.
Drought in forest understory ecosystems – a novel rainfall reduction
experiment
K. F. Gimbel1, K. Felsmann2, M. Baudis3, H. Puhlmann5, A. Gessler2,6,7, H. Bruelheide3,4, Z. Kayler2, R. H. Ellerbrock2, A. Ulrich2, E. Welk3,4, and M. Weiler1
1Chair of Hydrology, Faculty of Environment and Natural Resources, University of Freiburg, Freiburg, Germany 2Institute for Landscape Biogeochemistry, Leibniz Center for Agricultural Landscape Research e.V. (ZALF), Leipniz, Germany
3Institute of Biology, Geobotany and Botanical Garden, Martin Luther University Halle-Wittenberg, Germany 4German Centre for Integrative Biodiversity Research (iDiv) Leipzig, Germany
5Forest Research Institute Baden-Württemberg, Freiburg, Germany
6Research Unit Forest dynamics, Swiss Federal Research Institute for Forest, Snow and Landscape Research WSL, Zürchestr. 111, 8903 Birmensdorf, Switzerland
7Berlin-Brandenburg Institute of Advanced Biodiversity Research (BBIB), 14195 Berlin, Germany Correspondence to: K. F. Gimbel ([email protected])
Received: 16 June 2014 – Published in Biogeosciences Discuss.: 7 October 2014 Revised: 19 January 2015 – Accepted: 20 January 2015 – Published: 17 February 2015
Abstract. Precipitation patterns across Central Europe are expected to change over the 21st century due to climate change. This may reduce water availability during the plant-growing season and hence affect the performance and vital-ity of forest ecosystems. We established a novel rainfall re-duction experiment on nine sites in Germany to investigate drought effects on soil–forest–understory ecosystems. A re-alistic, but extreme annual drought with a return period of 40 years, which corresponds to the 2.5 % percentile of the an-nual precipitation, was imposed. At all sites, we were able to reach the target values of rainfall reduction, while other im-portant ecosystem variables like air temperature, humidity, and soil temperature remained unaffected due to the novel design of a flexible roof. The first year of drought showed considerable changes in the soil moisture dynamics relative to the control sites, which affected leaf stomatal conductance of understory species as well as evapotranspiration rates of the forest understory.
1 Introduction
Temperature and precipitation are two of the key drivers of ecosystem processes. Climate change alters global meteoro-logical processes such as atmospheric circulation and pre-cipitation (Seneviratne et al., 2006; IPCC, 2012). In Cen-tral Europe, climate change is predicted to severely affect precipitation patterns, which will result in reduced precip-itation input during the vegetation periods (Prudhomme et al., 2014; IPCC, 2012; Christensen and Christensen, 2007). Field experiments are a valuable tool to examine the con-sequences of changing climate on ecosystem processes, as demonstrated in numerous studies, and thus, a number of cli-mate change experiments have been established around the world in various ecosystems: e.g., dry heathland ecosystems in Denmark (Albert et al., 2011; Selsted et al., 2012), Ama-zonian rainforest Brazil (da Costa et al., 2011), temperate mixed broad-leaved forest (Schraml and Rennenberg, 2002) and sub-Mediterranean forest (Rodriguez-Calcerrada et al., 2009).
over-story (Ampoorter et al., 2014). The forest underover-story con-tains a great variety of the biodiversity in forests (Gillam, 2007), especially in Central Europe with its comparably low tree diversity. Whereas the effects of drought on grasslands have been addressed intensively there are only few studies examining the effect of climate change on the understory of forests (Ozolincus et al., 2009). It remains unclear how the forest understory will respond to continuously reduced pre-cipitation, as might be the case in a future Europe under cli-mate change (Kreuzwieser and Gessler, 2010). In general, we can expect both direct and indirect impacts of continu-ously reduced precipitation on the forest–understory system. Decreased transpiration and water potentials are short-term responses of plants to drought (Tschaplinski et al., 1998). As a result of the drop in water potential, stomatal closure will occur, limiting water fluxes at the cost of reduced CO2 uptake and assimilation. At the level of plant communities and long-term response, the stress induced by drought may modify competition and facilitation, or it may tip the balance towards a state where only stress-resistant plant species are able to survive (McDowell et al., 2008).
Since plants are closely linked to soil physical properties and interacting with soil microbiota, the response of plants to drought should be coordinated with detailed characteri-zation of soil and hydrological properties. Soil characteris-tics are closely linked to the activity of soil microbiota and plant roots, which modify water flow pathways along roots, organic matter and water repellency of soils (Birkhofer et al., 2012; Carminati et al., 2011; Gregory, 2006; Schaumann et al., 2007; Spohn and Rillig, 2012; Tang et al., 2011; Tis-dall and Oades, 1982). Through shrinkage and fracturing of soil aggregates, soil structure is also responding to chang-ing environmental conditions (in particular drought). Hence, the understory vegetation will be also be affected by indi-rect drought effects driven by soil processes. Since plants are closely linked to soil physical properties and interact with soil microbiota, the response of plants to drought should not be studied isolated.
Our current understanding of drought effects on the for-est understory is ambiguous and insufficient for predicting responses of the forest ecosystem: on one hand, the under-story remains largely unmanaged, while the overunder-story struc-ture of trees and canopy is a consequence of forest manage-ment practices. But on the other hand, the understory also harbors the tree seedlings, which will form the next tree gen-eration and thus we need a better mechanistic comprehension of this system. The knowledge of such mechanisms related to the understory response to drought need to be included in current forest growth models in order to understand all as-pects of the system – including natural regeneration – under climate change.
We thus propose to experimentally manipulate precipita-tion and investigate in detail the consequences for soil mois-ture, soil hydrological functions, and water uptake as well as vegetation structure, but also including more in-depth studies
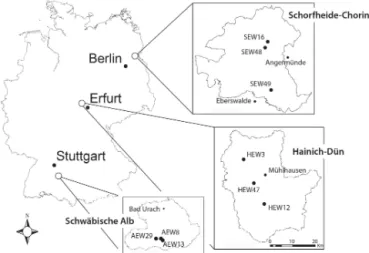
Figure 1. Location of the three Biodiversity Exploratories and the
experimental plots.
such as assessments of the microbial community structure. The aim of this study was to apply a realistic reduction of pre-cipitation whilst avoiding any associated effects on air tem-perature or humidity and to observe the initial drought effects on the forest–understory–soil system. Many other precipita-tion manipulaprecipita-tion experiments introduce extreme short-time drought events (e.g., Glaser et al., 2013), which often elimi-nate precipitation completely, generating unrealistic drought effects (Beier et al., 2012). In addition, the constructions used in previous studies often need electrical supply or in-tensive technical installation, supervision, and maintenance (e.g., Beier et al., 2004; Albert et al., 2011; Parra et al., 2012; Kopittke et al., 2014). Our approach employs a moderate, adaptive, and continuous rainfall reduction, equivalent to a drought with 40-year return period. To achieve our goal, nine investigation sites at three different geographical locations in Germany were established. Here, we describe and explain the set up and monitoring of the rainfall exclusion experi-ment and present the first results of rainfall reduction with soil physical and biological evidence on the effectiveness of the drought set up.
2 Material and methods 2.1 Investigation sites
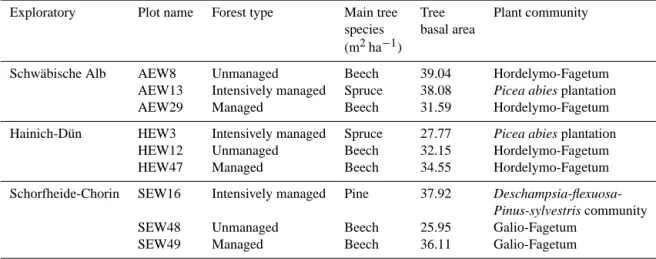
bio-Table 1. Forest type, main tree species, tree stand density and understory community at the various experimental plots.
Exploratory Plot name Forest type Main tree Tree Plant community species basal area
(m2ha−1)
Schwäbische Alb AEW8 Unmanaged Beech 39.04 Hordelymo-Fagetum AEW13 Intensively managed Spruce 38.08 Picea abies plantation
AEW29 Managed Beech 31.59 Hordelymo-Fagetum Hainich-Dün HEW3 Intensively managed Spruce 27.77 Picea abies plantation
HEW12 Unmanaged Beech 32.15 Hordelymo-Fagetum HEW47 Managed Beech 34.55 Hordelymo-Fagetum Schorfheide-Chorin SEW16 Intensively managed Pine 37.92
Deschampsia-flexuosa-Pinus-sylvestris community
SEW48 Unmanaged Beech 25.95 Galio-Fagetum SEW49 Managed Beech 36.11 Galio-Fagetum
geochemical cycles in real-world ecosystems (Fischer et al., 2010). In each of the Exploratories, we selected three forest plots, which cover different forest types, management inten-sities, and understory vegetation communities (Table 1), but are similar with respect to topography and soil type within each exploratory.
The site of the Biodiversity Exploratory Schwäbische Alb is located in the low mountain ranges of southwestern Ger-many; the underlying geology consists of Jurassic shell lime-stone. The soils at the investigation sites are extremely rich in clay, are very shallow (25 to 35 cm) and have a very high stone content. The soils of the Hainich-Dün site (situated in central Germany) generally have a loamy to clayey texture with soil depths between 45 and 65 cm and low water con-ductivity. Here, the underlying geology consists of Triassic limestone.
The site of the Biodiversity Exploratory Schorfheide-Chorin is located in a young glacial landscape in the low-lands of northeastern Germany. The dominant geological substrate is glacial till covered by glacio-fluvial or aeolian sands. Therefore, soils have textures in the range of sandy loam to pure sand. Due to their sandy texture, the soil depth in this area is identified by rooting depths.
More information on general plot properties is prepared in Table 2. All weather data is taken from stations of the German weather service (DWD, actual and annual data years 1950–2010) nearby (station IDs 03402, 00487, and 00164). 2.2 Roof construction for a flexible rainfall reduction At each of the nine selected plots, five roof subplots and five control subplots were instrumented. One of the five roof subplots and one of the five control subplots has a size of 10×10 m (“main subplot”, Fig. 2); the other four pairs of subplots (“satellite subplots”) have a size of 3×3 m. Roof and control subplots are in close proximity to each other (dis-tance between roof and control ranges between 15 and 30 m
for the main roofs, and between 6 and 15 m for the satellite subplots), in order to ensure similar subplot properties with respect to topography, soil and vegetation. A central over-story tree (Figs. 2, 3) is included in each of the central sub-plots, whereas the satellite subplots do not contain any large trees. The selected central trees are similar in age, size and canopy structure.
The roofs have a height of around 2 m and are supported by an unpainted timber construction leveled on a foundation of bricks or wooden support (Fig. 3a, b). All four sides of the timber construction are open in order to provide sufficient circulation and exchange with ambient air and to avoid heat-up and changes in air humidity. Due to the roof dimensions, it was not possible to circumvent supporting constructions in the center of the roofed area, but they were kept at a mini-mum to reduce shading.
The roofs are covered with transparent POLYLUX© trape-zoidal corrugated panels (Fig. 3c). To allow a flexible re-duction of precipitation, we decided to adjust the number of roof panels on a pre-defined time interval. In order to avoid any spatial persistent reduction of precipitation, we manually changed the position of the roof panels randomly in space. The roof panels of the large roofs have a size of 1.16 m×1.33 m=1.543 m2and those on the small satellite roofs 0.9 m×0.58 m=0.522 m2. The main roof allows for 48×7=336 possible positions for the roof panels. Com-plete coverage – without overlapping of panels – is real-ized with 56 units (covering 100 %). The satellite roofs hold 22×4=66 possible positions and are at maximum cov-ered with 12 small roofing units (covering: 100 %). The coverage of the roofs is adjusted every month by manu-ally adding/removing and repositioning the roof panels. The timber construction and gutters themselves already intercept 11 % (main roofs) and 15.5 % (satellite roofs) of precipita-tion.
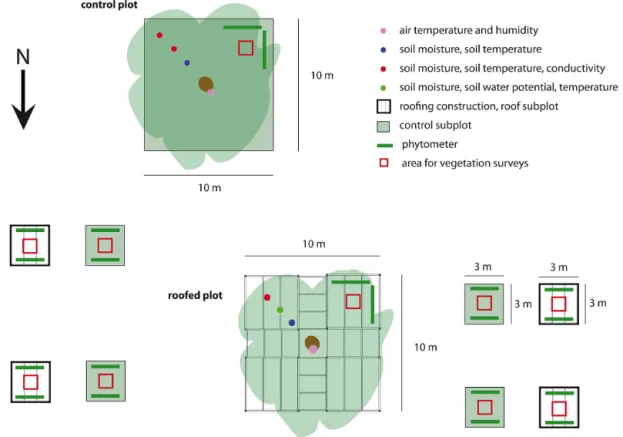
Figure 2. Schematic sketch of roofed and control subplots with roof construction indicated.
Table 2. General properties of the nine experimental plots.
Exploratory Plot name Mean annual Mean annual Elevation Soil class precipitation temperature m a.s.l.
Schwäbische Alb AEW8 766 m Cambisol AEW13 940 mm 6.5◦C 714 m Cambisol
AEW29 760 m Leptosol
Hainich-Dün HEW3 410 m Luvisol HEW12 533 mm 7.2◦C 332 m Luvisol
HEW47 333 m Stagnosol
Schorfheide-Chorin SEW16 69 m Cambisol SEW48 589 mm 8.5◦C 74 m Cambisol
SEW49 65 m Cambisol
and is drained into rain barrels. Stemflow (of all roofed beech trees) is also collected and drained to the rain barrels by a stem rim (Fig. 3d). The water level in the rain barrels is con-tinuously logged with a pressure transducer to quantify the total amount of water removed by the roof. Above a certain water level, the barrel is emptied through an electromagnetic valve and the water is conveyed through a hose away from the roof. Eight of the nine plots are situated at very flat angled-slopes, therefore re-entering of the water is prevented. Only plot AEW8 is situated on a steeper slope, which made com-promises in the construction necessary; to balance the dif-ferences in height of the central roof, one side of the roof
is placed directly on the ground without wooden support, the other is 3.2 m above ground. Nevertheless, the roof has the same dimensions, rain gutters and instrumentation as the other eight plots. No adjustment had to be made at the smaller satellite roofs at this plot.
Figure 3. Roof construction sketch of the main roof (10×10 m) (a). Roof with panels, rain gutters, water barrel and main tree (b, c). Roof detail with main tree and stem rim to collect stem flow (d). All pictures were taken at plot SEW48.
takes place) as the surrounding forest, but also of preserving the hydrochemical composition. This would not be the case if precipitation was completely intercepted and tap or river water was used for monthly irrigation.
2.3 Rainfall reduction for realistic drought conditions Our target rainfall reduction level was a total annual pcipitation input equivalent to a drought with a 40 year re-turn interval. However, any other target value can be de-fined with the roof construction described above. We as-sume that the relative reduction in measured gross pre-cipitation is equal to the relative reduction in throughfall under the forest canopy. The target value of the precipi-tation reduction was calculated from long-term precipita-tion data (1950–2010) using climate staprecipita-tions of the Ger-man Weather Service (DWD) in the vicinity of the investi-gation sites (Schorfheide-Chorin: DWD station Angermünde (ID 00164); Hainich-Dün: Erfurt-Bindersleben (ID 00487); Schwäbische Alb: Münsingen/Apfelstetten (ID 03402)). An-nual precipitation varies in the observation period between 322 and 714 mm in Angermünde, between 295 and 767 mm in Erfurt-Bindersleben, and between 618 and 1228 mm in Münsingen/Apfelstätten.
The 2.5 percentile of the annual precipitation, correspond-ing to a drought with a 40 year interval, was derived for each climate station, the result of which was used as the target value for the reduction of the precipitation on the roofed plots. The target value for the reduced annual precipitation sum at the Schorfheide-Chorin site is 392 mm, which corre-sponds to an average reduction of the incoming precipitation by 27 %. The target values for Hainich-Dün and
Schwäbis-che Alb are 355 and 700 mm corresponding to a reduction of 33 and 26 %, respectively (Fig. 4).
The practical implementation of the precipitation reduc-tion on the plots involves a monthly adjustment of the per-centage of reduction (i.e., the number of roof panels) and their spatial distribution (i.e., the position of the panels on the roof). Therefore, the target values for the reduced annual precipitation sum were transferred to monthly target sums. To preserve the inter-annual variability, we calculated the monthly target sum by weighting the average monthly sum (i.e., one twelfth of the annual target sum) by the ratio be-tween the long-term mean precipitation sum of each calendar month and the mean annual precipitation sum (Eq. 1). ami=aa×
Pmeanmi Pmeana
, (1)
whereamis the monthly target sum of a given monthi;aa is the annual target sum (2.5 % percentile of annual precipi-tation);Pmeanmi is the long term mean precipitation of given
monthi;Pmeanais the annual mean precipitation.
To calculate the reduction actually required, the reduced precipitation input under the roofs of the current month is compared with the target values. If the antecedent input fits the target value, the reduction is set to the theoretical re-duction obtained from the long-term series for the month to achieve the target value. If the antecedent input under the roof is above or below the target value, the reduction is set higher or lower according to the magnitude of deviation.
Figure 4. Cumulated sums of precipitation. Grey lines:
individ-ual years 1950–2010. Black line: cumulated mean of 1950–2010. Dark green line: appearance distribution of precipitation 1950–2010 (density). Light blue bars: reduction of precipitation 2012 in vol %. Dark blue bars: reduction of precipitation 2013 in vol %. Blue line: cumulated precipitation of year 2012. Green line: cumulated pre-cipitation of year 2013. Solid red line: cumulated 2.5 % percentile (target value). Dashed red line: cumulated precipitation under roofs in 2012. Dashed orange line: cumulated precipitation under roofs in 2013.
(for the main roof and 15.5 % for the satellite subplot roof, for construction reasons) from mid-November/early Decem-ber until January/February. To account for the absent re-duction in winter months, the rere-duction in spring balances winter-month excess or deficit. Similarly, November reduc-tion can be increased to create a reserve for wet winter months.
2.4 Monitoring and sampling
The effects of the imposed precipitation reduction on the at-mosphere and soil were continuously monitored under the central roof subplots and compared with parallel measure-ments and sampling campaigns at the central control sub-plots. The central subplots are divided into four sectors: one for field experiments and soil sampling, one for vegetation surveys and experiments, one for long-term soil-hydrological monitoring, and one remains untouched and is reserved for possible future investigations (Fig. 2). The satellite control and roof subplots are used exclusively for vegetation surveys and soil sampling for microbial analyses.
2.4.1 Meteorology and soil hydrology
Monitoring at the main subplots includes measurements of soil moisture and soil temperature (5TM, Decagon Devices Inc.), soil electrical conductivity (5TE, Decagon Devices Inc.) and only under the roofs matric potential (MPS-2, Decagon Devices Inc.) at 2, 3, and 4 m distance from the cen-tral tree, and in four soil depths (5, 15, 30, and 60 cm). At the shallow sites (HEW3, HEW12, HEW47, AEW8, AEW13, AEW29), the 60 cm depth probes were omitted in at least one distance from the central tree. The measuring accuracy according to the technical data sheets of the 5TE and 5TM probes is ±1◦C for temperature, ±10 % of the measured value for electrical conductivity (5TE only), and±15 % of the measured value for the volumetric water content. The MPS-2 probes have an accuracy of±25 % of the reading (as per technical data sheet) within the measuring range of−5 to −100 kPa. To observe possible roof effects on the microcli-mate, air temperature and humidity sensors (HMP45C with HUMICAP®180 sensor, Campbell Scientific Inc.) were in-stalled at one location under the central roof and one at the central control subplot at the same height (2 m) above the ground. The HMP45C temperature and humidity probes have an error in temperature measurement of±0.2 to±0.3◦C and 2–3 % for air humidity. Sap flow in the central trees is mon-itored using the three-needle heat-pulse sensor by EAST 30 Inc. with an accuracy of around 5 % of the reading (Cohen et al., 1981). All data (soil, climate, and sap flow) are logged at 15 min intervals, except the water level in the rain barrels, which are logged at 1 min intervals. In addition, measure-ments of photosynthetic active radiation were carried out pe-riodically.
community and its cover. The baseline survey for all plots took place between June 2011 and July 2011.
At each subplot the specific leaf area index (LAI) was de-termined from randomly selected field-fresh leaves from all species with a coverage of more than 5 % (fresh weight per leaf sample >1 g, which equals 2–12 leaves per species). Measurements were made three times in 2012 (spring – April, early summer – June/July, late summer – Au-gust/September) at all nine plots. Digital photos, which were taken of these leaves in the field, were used to determine the average area of a leaf (LAspecies; defined as the area of an average leaf of a given species) using the image analy-sis software imageJ 1.45s (Abramoff et al., 2004). For un-derstory analysis, we took digital photos of four randomly chosen quadratic areas per control and roof sub-subplots (n=4; Atotal=2.45 m2) and counted the total number of leaves (Nleaves) of each species within the known ground-surface area (Atotal). LAI was calculated by the following equation:
LAI= NspeciesP
i
Nleaves×LAspecies
Atotal , (2)
where Nspecies is the total number of species found on the quadratic area of 2.45 m2. For subplot plant species richness we counted the total species number on the digital photos of the 2.45 m2areas for each treatment.
For further insight into the effect of drought on growth, we planted phytometers (proxy plants used as a measure of plant physical response) of Fagus sylvatica L. on all 90 sub-plots. We used 1-year-old F. sylvatica saplings (Schlegel & Co. Gartenprodukte GmbH, Riedlingen, Germany) in Oc-tober 2011 from three different provenances correspond-ing to the three different experimental sites. The saplcorrespond-ings had an initial height of 30–50 cm (with a mean and sd of 34.74 cm±8.15 cm, respectively) and a tap root length ap-proximately of 10 cm. At the time of planting, roots of all saplings were pruned to 10 cm to avoid crooked roots in shal-low soils, as they occur at the Hainich and Schwäbische Alb site. In October and November 2011, we either planted the beech saplings into the resident plants or once removed the total aboveground biomass of all herbaceous plants in a ra-dius of 20 cm around the phytometer to exclude herb layer competition. In total we planted 1080 beech phytometers (90 subplots×12 individuals). For further information on the ex-perimental design of the phytometer experiment see Baudis et al. (2014).
Growth of all planted beeches was recorded by measur-ing different growth response variables such as leaf number, plant height, leaf length and crown expansion and compared with the phytometer data of the control plots. The phytome-ters were monitored three times in 2012 (spring, early sum-mer, late summer). Relative growth rates (RGR) were calcu-lated from April 2012 to July 2012. Leaf stomatal
conduc-tance (gs) was measured on all monitoring dates with a SC-1 leaf porometer (Decagon Devices Inc.).
In the field, gas-exchange chambers (transparent Perspex, size: 52×77.5×78.5 cm, A=0.61 m2) comparable to the ones described in Yepez et al. (2005) were used for measur-ing understory evapotranspiration (ET) rates. The chambers were open to the soil, sealed with rubber foam gaskets to the ground and were used as closed systems to assess the build up of water vapor from soil evaporation and plant transpira-tion. Measurements were made three times in 2012 (spring, early summer, late summer) at all nine plots. ET rates were determined on the control subplots and on the roof subplots. The increase in water vapor in the closed chambers was measured with a cavity ring-down laser spectrometer (PI-CARRO L1102-I, Picarro Inc.) directly in the field, with four replicates per control subplot and per roof subplot between 10:00 a.m. and 15:00 p.m. (CEST). The chamber air was cir-culated through the isotope water analyzer via a low absorp-tion tube using the Picarro pump (flow rate <0.4 L min−1) and fed back again in the chamber headspace. For each cham-ber, a measurement lasted 10–12 min, and a fan provided mixing of the air in the gas exchange headspace. Temper-ature, air humidity (VP-3 humidity temperature and vapor pressure sensor; Decagon Devices Inc.) and photosynthetic photon fluency rate (PPFR) were continuously logged (Par Photon Flux Sensor, Decagon Devices Inc.). ET rates were calculated from the linear increase in water vapor concen-tration determined by the laser spectrometer in the chamber over time and based on the ground area.
2.5 Statistical analyses
We appliedttests to assess the differences in the LAI and for species richness between the roof and control treatment us-ing R (R-3.0.2, The R Foundation for Statistical Computus-ing 2013).
3 Results
3.1 Precipitation reduction
All roofs were installed during fall/winter 2011 (mid-September in Schorfheide-Chorin, mid-October in Hainich-Dün, early December in Schwäbische Alb). On all plots the rain exclusion started on 1 March 2012 and ended on 30 November 2013. Continuous monitoring of meteorologi-cal and soil hydrologimeteorologi-cal data started in Schwäbische Alb in mid-April 2012 and in Schorfheide-Chorin and Hainich-Dün at the end of August 2012.
With respect to precipitation, the year 2012 was an average year with a total precipitation of 940 mm (100.4 % of long term mean) in the Schwäbische Alb, 508 mm (95.5 %) in Hainich-Dün, and 543 mm (101.5 %) in Schorfheide-Chorin (Fig. 4, blue lines). At all sites in 2012, winter rain and snowfall was greater than average. In contrast, the year 2013 was wetter than the long term mean in Schwäbische Alb (976 mm, 104.3 %) and Hainich-Dün (596.5 mm, 112.1 %), and drier in Schorfheide-Chorin (483.2 mm, 90.4 %). To compensate for the high precipitation input, we had to raise the exclusion (Fig. 4, blue bars) from 30 % (mean value) to 50 %, which resulted in a reduction below the target (699 mm) of 11 %. Generally, the reduced precipitation in-put on all plots satisfyingly reached the target values, both in 2012 and in 2013. The reduced input (dashed red and orange lines in Fig. 4) hovered around the target value (solid red line), depending on the monthly adaption of the roof cover. The maximum applied roof coverage in 2012 and 2013 was 55 %.
In total, 221 mm were excluded in the Schwäbische Alb sites in 2012 which resulted in an incoming precipitation un-der the roofs of 719 mm. In Hainich-Dün and Schorfheide-Chorin, 178 and 176 mm respectively were reduced (input under the roof: 331 and 366 mm). In 2013, incoming pre-cipitation under the roof was 619, 366 and 346 mm for Schwäbische Alb, Hainich-Dün, and Schorfheide-Chorin re-spectively, which hit the target values satisfyingly; in addi-tion, Schwäbische Alb and Schorfheide-Chorin had a reduc-tion below the target (11 % for both sites) (Fig. 4).
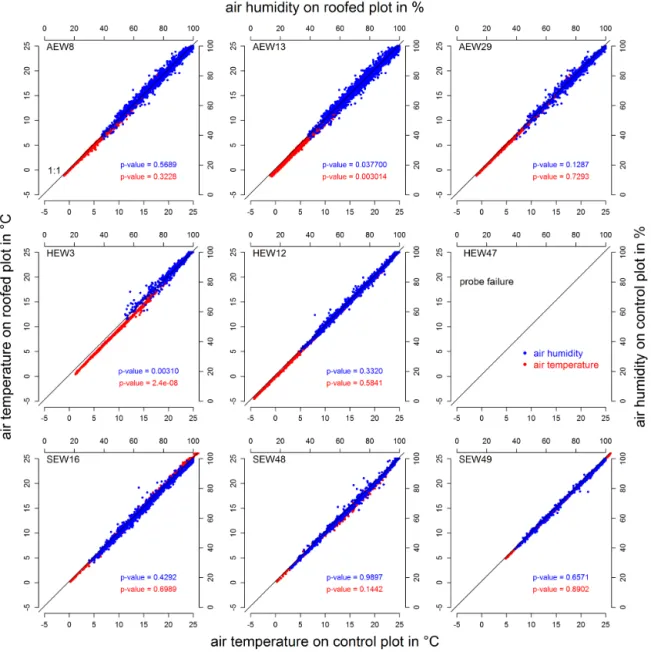
3.2 Roof effect on air temperature, air humidity and soil temperature
In general, roofing on experimental plots can promote changes of air temperature and humidity, due to alterations of radiation and ventilation (greenhouse effect). In fact, some authors actually used roofing setups in order to achieve higher mean temperatures, mainly as an effect of preventing the nocturnal emission of longwave radiation (e.g., Selsted et al., 2012). Because elevation of air temperature and hu-midity has significant effects on growth, germination, tran-spiration and water uptake of plants, on microbial activity and on soil evaporation, we aimed at avoiding any alteration
of air temperature and humidity as well as radiation. Based on the monitored air temperature, air humidity and soil tem-perature at the main roof and the neighboring main control subplot, we tested whether the roofing had a measurable ef-fect on these variables. Air temperature and humidity were not affected by the roofing on any of the experimental sites (Fig. 5). The 15 min readings on the control plot and under the roof are not significantly different (except plot HEW3) according to the Wilcoxon–Mann–Whitney rank sum test.
Similar to air temperature, mean values of soil temper-ature show no difference between main control and main roofed subplot regarding to the measuring accuracy of the 5TM/5TE-probes in all depths (data not shown).
3.3 Roof effect on soil moisture
Figure 5. Air temperature control plots vs. air temperature roofed plots (red dots) and air humidity on control plots vs. air humidity on roofed
plots (blue dots) for all experimental sites in May 2013. No data for HEW47 are shown due to probe failure.
3.4 Plant community and phytometer
There were no significant differences between the total vege-tation coverage of the sites (27.9, 40.3, and 38.9 % – average of the three plots per site of Schorfheide-Chorin, Hainich-Dün, and Schwäbische Alb, respectively). The type of the un-derstory plant community as assessed in the vegetation sur-veys is given in Table 1. A detailed overview of the different functional groups (grass, herb, shrub, and tree recruits) and the mean coverage on the nine plots can be found in Table 3. Most plots are dominated by grasses and herbs; subplots dif-fer in total coverage between 2.26 and 57.1 %. (Table 2).
In late summer 2012, i.e., at the end of the first grow-ing season with the drought treatment, there were significant
Table 3. Results of the vegetation monitoring of the understory vegetation for various functional groups at all three sites shown as mean
coverage per plot in percent; calculated as a mean from ten vegetation recordings of 1×1m per subplot.
Exploratory Plot name Understory Mean cover in functional group (%) vegetation
cover (%)
Grass Herb Shrub Tree recruits Schwäbische Alb AEW8 22.87 0.73 19.90 0.00 2.30 AEW13 57.10 0.65 50.10 3.90 3.20 AEW29 36.77 5.60 20.80 0.00 10.50 Hainich-Dün HEW3 48.95 19.70 26.60 1.15 0.20 HEW12 44.67 0.00 34.0 0.00 10.70 HEW47 27.30 8.00 9.20 0.00 10.40 Schorfheide-Chorin SEW16 33.60 28.60 5.00 0.00 0.00 SEW48 2.26 1.80 0.43 0.00 0.10 SEW49 47.90 0.03 39.40 7.50 1.30
Table 4. LAI (mean±SD,n=4) and species richness (Atotal =2.45 m2) for control and roof subplots in late summer (August/September) 2012 for the different exploratories and management types. “No veg.” means no vegetation on plot; t tests were applied to assess the differences in the LAI and species richness between the roof and control treatment;∗p <0.05,∗∗p <0.01.
LAI Species richness Plot Management Control Roof Roof vs. Control Roof Roof vs.
type control control
AEW13 Spruce 1.74±0.41 1.63±0.50 – 9 8 – AEW8 Beech unmanaged 0.75±0.21 0.44±0.24 – 5 4 – AEW29 Beech managed 0.97±0.05 0.71±0.06 ∗∗ 9 8 – HEW3 Spruce 0.92±0.15 0.53±0.09 ∗∗ 5 5 – HEW12 Beech unmanaged 0.40±0.08 0.24±0.09 – 3 3 – HEW47 Beech managed 0.37±0.04 0.42±0.04 – 6 8 ∗∗ SEW16 Pine 0.62±0.10 0.44±0.13 – 5 3 – SEW48 Beech unmanaged No veg. No veg. – No veg. No veg. – SEW49 Beech managed 0.63±0.18 0.88±0.20 – 8 7 –
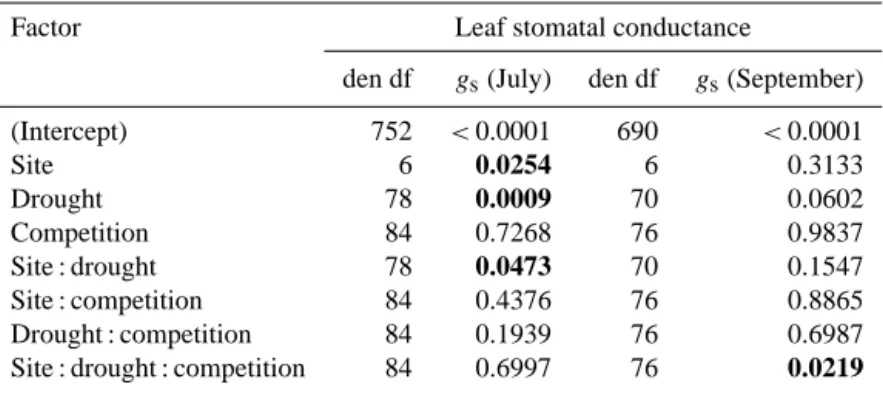
Additionally, there was an interaction of drought and site (Table 4; Fig. 7). While drought had no effect at the wettest site (Schwäbische Alb), stomatal conductance was reduced under the roof at the Schorfheide-Chorin and the Hainich-Dün sites. In contrast togs, growth parameter did not show significant drought effects in this early stage of the experi-ment.
At the beginning of the 2012 growing season, when the drought treatment had started, the understory evapotranspi-ration rates between the roof and control subplots as deter-mined with chambers were not significantly different, indi-cating the initial comparability of the subplots (Fig. 8). In the late summer 2012 we detected no significantly lower ET rates with the chamber measurements as response to reduced precipitation with one exception at SEW16 (pine) (Fig. 8).
4 Discussion
4.1 Precipitation reduction
The aimed reduction of precipitation to a 40-year annual drought equivalent (2.5 % percentile) was met. The annual precipitation of the years 2012 and 2013 were in all regions close to the long term annual mean. Possible problems may occur when using our technique in extraordinarily dry or wet years, although we did not detect such meteorological cir-cumstances in the 1950–2010 records in all our regions when we tested our design in terms of figures.
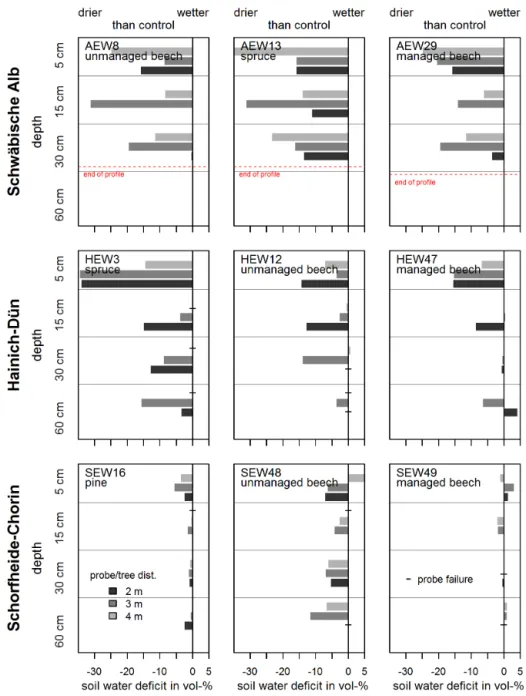
Figure 6. Soil water deficit (soil water content of control minus roofed subplot) of the main subplots. All values originate from May 2013,
except the values from HEW47 (April 2013), due to probe failure. “–” marks missing values.
is flexible enough to realize a wide range of reduction ex-periment designs, e.g., total reduction during distinct grow-ing season periods (manipulation of inter-annual variability), shorter adjustment intervals of roofing panels (daily, weekly) and combination with irrigation equipment (e.g., Glaser et al., 2013; Fay et al., 2000). The roofing design can be en-larged or reduced in size to meet the requirements of a site or experimental design. Experimental drought or rainfall exclu-sion experiments are often extended over 1–2 years (Parra et al., 2012; Dermody et al., 2007), but our construction can be used to study long-term drought effects for several years due to the stability of the timber construction.
4.2 Roof effect on air temperature, air humidity and soil moisture
Table 5. Results of the linear mixed model for the leaf stomatal conductance (gs) as a function of site, drought and competition of the Fagus sylvatica phytometers in July and September 2012 (spring data not shown). Values arepvalues. Significant probabilities (p <0.05) are shown on bold; den df=degrees of freedom.
Factor Leaf stomatal conductance
den df gs(July) den df gs(September)
(Intercept) 752 <0.0001 690 <0.0001
Site 6 0.0254 6 0.3133
Drought 78 0.0009 70 0.0602 Competition 84 0.7268 76 0.9837 Site : drought 78 0.0473 70 0.1547 Site : competition 84 0.4376 76 0.8865 Drought : competition 84 0.1939 76 0.6987 Site : drought : competition 84 0.6997 76 0.0219
Figure 7. Leaf stomatal conductance at the three experimental sites
in July 2012. The boxes show medians and quartiles, the whiskers show 1.5 times the interquartile range of the data. For statistical analyses, see Table 5.
the effect of prolonged drought from effects due to changes in air temperature and air humidity conditions. Our measure-ments show no difference in humidity and air temperature between roofed and control plots, which clearly indicates a comparable coupling of the airspace close to the ground to the atmosphere on both subplots. In addition, the design of the roofs with an incomplete coverage (2 m high, four sides open, maximum roof coverage 55 %, complete roof area only 100 m2)definitely did not represent a closed roof. Given that and the findings that air humidity and temperature remain to-tally unaffected, it is very unlikely, that CO2concentrations increased under the roofs and thus also no CO2fertilization effects are to be expected.
The drought treatment clearly reduced soil moisture con-tent in all depths in all plots (exceptions are the 5 cm depths of SEW48 and SEW49, the 60 cm depths of HEW47 and SEW49). In Hainich-Dün and especially in the
Schorfheide-Chorin plots, soil moisture deficit decreased with depth. This is in line with the findings of English et al. (2005), who found a decrease of soil moisture deficit with depth. The reason for the difference in behavior of the Schwäbische Alb plots in soil moisture drought response is twofold: the reduction is always relative, not absolute, which leads to more pro-nounced deficits in areas with higher precipitation. Secondly, the Schorfheide plots, which showed the lowest deficits, are all sandy soils. This type of soil already has a comparably low soil moisture when untreated.
We acknowledge that the water relations in the soil un-der the roof might have been influenced by adult trees root-ing partially outside and partially inside the sheltered area, mainly due to redistribution of water via the roots. As a con-sequence, the intensity of the reduction of soil water content might not only be affected by rainfall reduction and soil prop-erties but also by the intensity of such redistribution. 4.3 Roof effects on evapotranspiration, leaf stomatal
conductance and growth
in-Figure 8. Mean evapotranspiration rates (±SD) for control and drought treatments (n=4) at different times during the growing season (sp: spring; es: early summer; ls: late summer). Data are shown for the different management intensities (managed/unmanaged beech and pine/spruce) in the three exploratories. The asterisk marks significant differences (pvalue<0.05).
tensity. Changes in ecosystem functioning occur after stress conditions exceed a certain level of climate severity thresh-old, which can not be predicted yet (Bahn et al., 2014; Vicca et al., 2012). The achieved 40-year return interval drought was in our experiment not enough to push the system beyond this physiological and biochemical threshold.
Conversely, the quick response of leaf stomatal conduc-tance (gs)confirms that control of the transpiration is a very sensitive and short-term response of plants to reduced wa-ter supply (cf. Gessler et al., 2004). The finding thatgs was mainly reduced in July and only marginally significantly in September clearly reflects the fact that our rain reduction was not absolute but proportional. As the amount of
ET response to the drought treatment was only observed in the pine plot in the Schorfheide site during this initial phase. This points to the fact that the stomatal response observed at the leaf level in the phytometer plants does not yet scale with the ecosystem water use.
5 Conclusions
We conclude that our innovative roofing construction is a valid, and more realistic, alternative to the common drought simulation practice of total rainfall reduction. Due to the flex-ible construction, it is possflex-ible to preserve the temporal and spatial variability of rainfall pattern, in particular under the forest canopy, while reducing precipitation input and soil moisture and without changing the air temperature and hu-midity on site. During the first two years of treatment, the reduction of precipitation to a 40-year annual drought event did not introduce artificial vegetation responses as an effect of unrealistically high rainfall reduction.
Acknowledgements. Special thanks go to Lukas Neuhaus, Delon Wagner, Emil Blattmann, Johannes Bruckhoff, and Carsten Beinhoff for technical support and help building the roofing constructions. The work has been funded by the DFG Priority Program 1374 “Infrastructure-Biodiversity-Exploratories” (DFG-Ref no. WE4598/3-1, GE1090/11-1, and BR1698/16-1). We thank the managers of the three exploratories, Swen Renner, Sonja Gockel, Andreas Hemp, Martin Gorke and Simone Pfeiffer for their work in maintaining the plot and project infrastructure, and Markus Fischer, the late Elisabeth Kalko, Eduard Linsenmair, Do-minik Hessenmöller, Jens Nieschulze, Daniel Prati, Ingo Schöning, François Buscot, Ernst-Detlef Schulze and Wolfgang W. Weisser for their role in setting up the Biodiversity Exploratories project. Field work permits were issued by the responsible state environ-mental offices of Baden-Württemberg, Thuringia, and Brandenburg (according to §72 BbgNatSchG).
Edited by: Y. Kuzyakov
References
Abramoff M., Magelhaes P. J., and Ram S. J.: Image processing with Image, J. Biophotonics Int. 11, 36–42, 2004.
Albert, K. R., Ro-Poulsen, H., Mikkelsen, T.N., Michelsen, A., Van Der Linden, L., and Beier, C.: Effects of elevated CO2, warm-ing and drought episodes on plant carbon uptake in a temperate heath ecosystem are controlled by soil water status, Plant, Cell Environ., 34, 1207–1222, 2011.
Ampoorter E., Baeten L., Koricheva J., Vanhellemont M., and Ver-heyen K.: Do diverse overstoreys induce diverse understoreys? Lessons learnt from an experimental–observational platform in Finland, Forest Ecol. Manage., 318, 206–215, 2014.
Bahn, M., Reichstein, M., Dukes, J. S., Smith, M. D., and Mc-Dowell, N. G.: Climate-biosphere interactions in a more extreme world, New Phytol., 2002, 356–359, 2014
Baudis, M., Ellerbrock, R. H., Felsmann, K., Gessler, A., Gim-bel, K., Kayler, Z., Puhlmann, H., Ulrich, A., Weiler, M., Welk, E., and Bruelheide, H.: Intraspecific differences in responses to rainshelter-induced drought and competition of Fagus sylvatica L. across Germany, Forest Ecol. Manage., 330, 283–293, 2014 Beier, C., Beierkuhnlein, C., Wohlgemuth, T., Penuelas, J.,
Em-mett, B., Körner, C., de Boeck, H., Christensen, J. H., Leuzinger, S., Janssens, I. A., and Hansen, K.: Precipitation manipulation experiments – challenges and recommendations for the future, Ecol. Lett. 15, 899–911, 2012.
Birkhofer, K., Schoening, I., Alt, F., Herold, N., Klarner, B., Ma-raun, M., Marhan, S., Oelmann, Y., Wubet, T., Yurkov, A., Begerow, D., Berner, D., Buscot, F., Daniel, R., Diekoetter, T., Ehnes, R. B., Erdmann, G., Fischer, C., Foesel, B., Groh, J., Gutknecht, J., Kandeler, E., Lang, C., Lohaus, G., Meyer, A., Nacke, H., Naether, A., Overmann, J., Polle, A., Pollierer, M. M., Scheu, S., Schloter, M., Schulze, E.-D., Schulze, W., Wein-ert, J., Weisser, W. W., Wolters, V., and Schrumpf, M.: General Relationships between Abiotic Soil Properties and Soil Biota across Spatial Scales and Different Land-Use Types, PLoS ONE, 7, e43292, doi:10.1371/journal.pone.0043292, 2012.
Carminati, A., Schneider, C. L., Moradi, A. B., Zarebanadkouki, M., Vetterlein, D., Vogel, H.-J., Hildebrandt, A., Weller, U., Schüler, L., and Oswald, S. E.: How the Rhizosphere May Favor Water Availability to Roots, Vadose Zone J., 10, 988, doi:10.2136/vzj2010.0113, 2011.
Christensen, J. H. and Christensen, O. B.: A summary of the PRU-DENCE model projections of changes in European climate by the end of this century, Clim. Change, 81, 7–30, 2007.
Cohen, Y., Fuchs, M., and Green, G. C.: Improvement of the heat pulse method for determining sap flow in trees, Plant, Cell Envi-ron., 4391–397, 1981
da Costa, A. C. L., Galbraith, D., Almeida, S., Portela, B. T. T., da Costa, M., de Athaydes Silva Jr., J., Phillips, O. L., Metcalfe, D. B., Levy, P., and Meir, P.: Effct of 7 yr of experimental drought on vegetation dynamics and biomass storage of an eastern Ama-zonian rainforest, New Phytol., 187, 579–591, 2010.
Dermody, O., Weltzin, J. F., Engel, E. C., Allen, P., and Norby, R. J: How elevated [CO2], warming, and reduced precipitation
in-teract to affect soil moisture and LAI in an old field ecosystem?, Plant Soil, 301, 255–266, 2007
English, N. B., Weltzin, J. F., Fravolini, A., Thomas, L., and Williams, D. G.,: The influence of soil texture and vegetation on soil moisture under rainout shelters in a semi-desert grassland, J. Arid Environ., 63, 324–343, 2005.
Fay, P. A. Carlisle, J. D., Knapp, A. K., Blair, J. M., and Collins, S. L.: Altering Rainfall Timing and Quantity in a Mesic Grassland Ecosystem: Design and Performance of Rainfall Manipulation Shelters, Ecosystems, 3, 308–319, 2000.
Fischer, M., Kalko, E. K. V., Linsenmair, K. E., Pfeiffer, S., Prati, D., Schulze, E.-D., and Weisser, W. W.: Exploratories for Large-Scale and Term Functional Biodiversity Research, Long-Term Ecological Research: Between Theory and Application, edited by: Muller, F., Baessler, C., Schubert, H., and Klotz, S., Springer, 233 Spring Street, New York, Ny 10013, United States, 429–443, 2010.
Gilliam, F. S.: The ecological significance of the herbaceous layer in temperate forest ecosystems, Bioscience, 57, 845–858, 2007 Glaser, B., Jentsch, A., Kreyling, J., and Beierkuhnlein, C.:
Soil-moisture change caused by experimental extreme summer drought is similar to natural inter-annual variation in a loamy sand in Central Europe, J. Plant Nutrit. Soil Sci., 176, 27–34, 2013.
Gregory, P. J.: Roots, rhizosphere and soil: the route to a better un-derstanding of soil science?, Europ. J. Soil Sci., 57, 2–12, 2006. Hommel, R., Siegwolf, R., Saurer, M., Farquhar, G. D., Kayler, Z., Ferrio, J. P., and Gessler, A.: Drought response of mesophyll con-ductance in forest understory species – Impacts on water-use ef-ficiency and interactions with leaf water movement, Physiologia Plantarum, doi:10.1111/ppl.12160, 2014.
Kopittke, G. R., Tietema, A., van Loon, E. E., and Asscheman, D.: Fourteen annually repeated droughts surpressed autotrophic soil respiration and resulted in an ecosystem change, Ecosystems, 17, 242–257, 2014.
Kreuzwieser, J. and Gessler, A.: Global climate change and tree nu-trition: influence of water availiability, Tree Physiol., 30, 1221– 1234, 2010.
Leuzinger, S., Luo, Y., Beier, C., Dieleman, W., Vicca, S., and Körner, C.: Do global change experiments overestimate impacts on terrestrial ecosystems?, Trends Ecol. Evolut., 26, 236–241. 2011.
Maracchi, G., Sirotenko, O., and Bindi, M.: Impacts of present and future climate variability on agriculture and forestry in the tem-perate regions: Europe, Clim. Change, 70, 117–135, 2005. McDowell, N., Pockman, W. T., Allen, C. D., Breshears, D. D.
Cobb, N., Kolb, T., Plaut, J., Sperry, J., West, A., Williams, D. G., and Yepez, E. A.: Mechanisms of plant survival and mor-tality during drought: why do some plants survive while others succumb to drought?, New Phytol., 178, 719–739, 2008. Ozolincius, R., Stakenas, V., Varnagiryte-Kabasinskiene, I., and
Buozyte, R.: Artificial drought in Scots pine stands: effects on soil, ground vegetation and tree condition, Ann. Botan. Fenn., 46, 299–307, 2009.
Parra, A., Ramirez, D. A., Resco, V., Velasco, A., and Moreno, J. M.: Modifying rainfall patterns in a mediterranean shrubland: system design, plant responses, and experimental burning, Int. J. Biometeorol., 56, 1033–1043, 2012.
Prudhomme, C., Giuntoli, I., Robinson, E. L., Clark, D. B., Arnell, N. W., Dankers, R., Fekete, B. M., Franssen, W., Gerten, D., Gosling, S. N., Hagemann, S., Hannah, D. M., Kim, H., Masaki, Y., Satoh, Y., Stacke, T., Wada, Y., and Wisser, D.: Hydrologi-cal drought in the 21st century, hotspots and uncertainties from a global multimodel experiment, Proc. Natl. Acad. Sci. USA, 111, 32627, doi:10.1073/pnas.1222473110, 2014.
Rodriguez-Calcerra, J., Atkin, O. K., Robson, T. M., Zaragoza-Castells, J., Gil, L., and Aranda, I.: Thermal acclimation of leaf dark respiration of beech seedlings experiencing summer drought in high and low light environments, Tree Physiol., 30, 214–224, 2009.
Schaumann, G. E., Braun, B., Kirchner, D., Rotard, W., Szewzyk, U., and Grohmann, E.: Influence of biofilms on the water repel-lency of urban soil samples, Hydrol. Proc., 21, 2276–2284, 2007. Schraml, C. and Rennenberg, H.: The different reactions of beech tree (Fagus sylvatica L.) ecotypes to drought stress, Forstw. Cbl., 121, 59–72, 2002.
Selsted, M. B., Linden, L., Ibrom, A., Michelsen, A., Larsen, K. S., Pedersen, J. K., Mikkelsen, T. N., Pilegaard, K., Beier, C., and Ambus, P.: Soil respiration is stimulated by elevated CO2 and reduced by summer drought: three years of measurements in a multifactor ecosystem manipulation experiment in a temper-ate heathland (CLIMAITE), Glob. Change Biol., 18, 1216–1230, 2012.
Seneviratne, S. I., Luethi, D., Litschi, M., and Schaer, C.: Land-atmosphere coupling and climate change in Europe, Nature, 443, 205–209, 2006.
Spohn, M. and Rillig, M.C.: Temperature- and moisture-dependent soil water repellency induced by the basidiomycete Agaricus bis-porus, Pedobiologia, 55, 59–61, 2012.
Tang, J., Mo, Y., Zhang, J., and Zhang, R.: Influence of biological aggregating agents associated with microbial population on soil aggregate stability, Appl. Soil Ecol., 47, 153–159, 2011. Tschaplinski, T. J., Gebre, G. M., Shirshac, T. L.: Osmotic
poten-tial of several hardwood species as affected by manipulation of throughfall precipitation in an upland oak forest during a dry year, Tree Physiol. 18, 291–298, 1998.
Tisdall, J. M. and Oades, J. M.: Organic matter and water-stable aggregates in soils, J. Soil Sci., 33, 141-163, 1982.
Vicca, S. Gilgen, A. K., Camino serrano, M., Dreesen, F. E., Dukes, J. S., Estiarte, M., Grey, S. B., Guidolotti, G., Hoeppner, S. S., Leakey, A. D. B., Ogaya, R., Ort, D. R., Ostrogovic, M. Z., Ram-bal, S., Sardans, J., Schmitt, M., Siebers, M., van der Linden, L., van Straatten, O., and Granier, A.: Urgand need for a common metric to make precipitation manipulation experiments comper-able, New Phytol., 195, 518–522, 2012
Wu, Z., Dijkstra, P., Koch, G. W., Peñuelas, J., and Hungate, B. A.: Responses of terrestrial ecosystems to temperature and precipita-tion change: a meta-analysis of experimental manipulaprecipita-tion, Glob. Change Biol., 17, 927–942, 2011.