1127 © Author(s) 2007. This work is licensed
under a Creative Commons License.
Implications of climate change on flow regime affecting Atlantic
salmon
C.L. Walsh and C.G. Kilsby
Water Resource Systems Research Laboratory, School of Civil Engineering and Geosciences, Newcastle University, Newcastle upon Tyne NE1 7RU, UK
Email for corresponding author: [email protected]
Abstract
The UKCIP02 climate change scenarios (20702100) suggest that the UK climate will become warmer (an overall increase of 2.53oC), with
temperature increases being greater in the summer and autumn than in the spring and winter seasons. In terms of precipitation, winters are expected to become wetter and summers drier throughout the UK. The effect of changes in the future climate on flow regimes are investigated for the Atlantic salmon, Salmo salar, in a case study in an upland UK river. Using a hydraulic modelling approach, flows simulated across the catchment are assessed in terms of hydraulic characteristics (discharge per metre width, flow depths, flow velocities and Froude number). These, compared with suitable characteristics published in the literature for various life stages of Atlantic salmon, enable assessment of habitat suitability. Climate change factors have been applied to meteorological observations in the Eden catchment (north-west England) and effects on the flow regime have been investigated using the SHETRAN hydrological modelling system. High flows are predicted to increase by up to 1.5%; yet, a greater impact is predicted from decreasing low flows (e.g. a Q95 at the outlet of the study catchment may decrease to a Q85 flow). Reliability, Resilience and Vulnerability (RRV) analysis provides a statistical indication of the extent and effect of such changes on flows. Results show that future climate will decrease the percentage time the ideal minimum physical habitat requirements will be met. In the case of suitable flow depth for spawning activity at the outlet of the catchment, the percentage time may decrease from 100% under current conditions to 94% in the future. Such changes will have implications for the species under the Habitats Directive and for catchment ecological flow management strategies.
Keywords: Atlantic salmon, flow regimes, climate change, hydraulic characteristics, RRV analysis
Introduction
The Atlantic salmon (Salmo salar) is listed in Annexes II and V of the EU Habitats Directive (1992) as a species of importance to the UK. Distributions and abundance of salmon populations are influenced strongly by their habitat, which includes a range of both abiotic and biotic factors that have complex interactions (Armstrong et al., 2002). Published work suggests ideal habitat conditions for salmon populations at various life stages in the freshwater environment. Variables include: water velocity (Beland et al., 1982; Crisp and Carling, 1989; Heggberget, 1991; Hendry and Cragg-Hine, 1997; Moir et al., 1998); water depth (Beland et al., 1982; Heggberget, 1991; Hendry and Cragg-Hine, 1997; Moir et al., 1998); substrate size (Crisp and Carling, 1989; Heggberget, 1991; Kondolf and Wolman, 1993; Moir et al., 1998); percentage of fine sediment (Moir et al., 1998), water temperature (Crisp, 1993, 1996; Elliot
and Hurley, 1998); depth of egg burial (Bardonnet and Bagliniere, 2000) and channel cover (DeVore and White, 1978; Milner, 1982; Pickering et al., 1987; Heggenes, 1990). Most of the literature focuses on depth, current, substrate and cover, as those habitat features are the most important to the distribution and abundance of salmonids (Heggenes, 1990).
1128
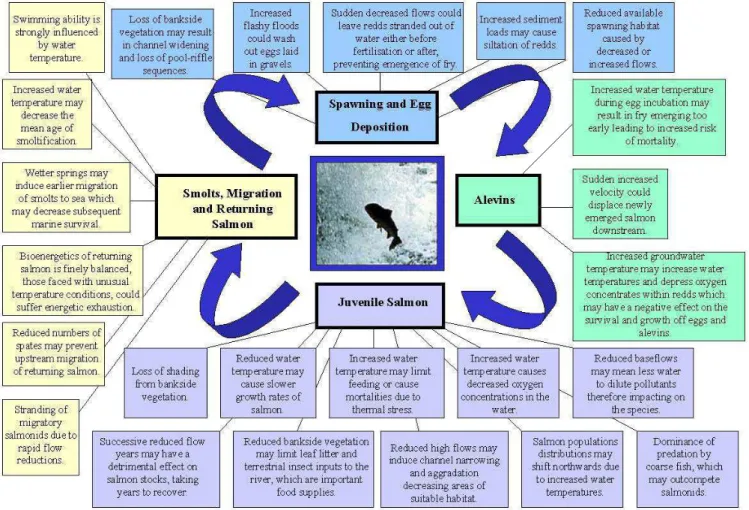
life stages of Atlantic salmon, both in the freshwater and marine environments. Impacts may be due to changes in flow regimes (e.g. Minns et al., 1995; Gilvear et al., 2002), water temperature (e.g. McCarthy and Houlihan, 1996; Jensen, 2003), water quality (Winfield et al., 2004), predation (Gilvear et al., 2002), exploitation and management. A full literature review on the implications of climate change for Atlantic salmon forms part of the SWURVE project and is presented in Winfield et al. (2004). Potential impacts are summarised at the various life stages (Fig. 1). Some of these concepts are discussed in more detail in this paper.
This study focuses on the impact on Atlantic salmon of the current and future hydrological regime of the River Eden, Cumbria, UK, in particular interpreting river discharge in terms of discharge per metre width, flow depth, flow velocity and Froude number, and comparing these quantities with ideal salmon requirements cited in the literature for various life stages.
Catchment description
The Eden valley is sandwiched between the Lake District mountains and the northern Pennine hills, in northern England. The River Eden rises south of Kirkby Stephen on predominantly limestone fells uplands. It then flows northwards through the towns of Kirkby Stephen, Appleby-in-Westmoreland and the city of Carlisle, before discharging into the Irish Sea on the Solway Firth. This study focuses on the catchment draining to Temple Sowerby, with an area of 616 km2
(Fig. 2). Here the catchment has been gauged since 1964 and has a mean annual flow of 14.4 m3
s1
, a Q95
of 1.859 m3
s1
and a Q10 of 33.36 m 3
s1
. Elevation in the catchment ranges from 90790 m. Mean annual precipitation (19611990) was 1146 mm with a range from over 2000 mm in upland areas to around 650 mm at the outlet.
Current land use is predominately pasture, with arable farming in the central lowland and moorland with some unimproved pasture in the upland. Historically, the upper
1129 Eden catchment has remained rural with the only sizeable
communities being the small towns of Temple Sowerby, Appleby, Brough and Kirkby Stephen. Apart from agriculture, there are limited anthropogenic influences within the catchment.
The whole of the River Eden and its tributaries have been designated a Site of Special Scientific Interest (SSSI), in particular for fish fauna including Atlantic salmon. The River Eden is one of seven rivers included in the UK RIVERS LIFE project (part of the UKs response to the European Unions Habitat Directive); this will involve river and catchment users in the development of a conservation strategy to safeguard the features that are of European importance in the river e.g. Atlantic salmon, native crayfish and lamprey.
Within the catchment, four study sites were chosen to represent a wide range of physical channel properties (Table 1), across a range of scales and catchment areas. The locations of the four sites: River Eden at Temple Sowerby, River Eden at Kirkby Stephen, Swindale Beck at Hallgarth and Artlegarth Beck at Artlegarth are shown in Fig. 2. The sites at Temple Sowerby, Kirkby Stephen and Hallgarth all support salmon, whereas Artlegarth is too small to support the species.
Methodology
The hydrological model SHETRAN is set up to represent the catchment for the period 19921999 as the current climatic conditions experienced in the catchment. Future changes in precipitation and temperature as predicted by the latest UKCIP02 climate change scenarios are then applied to the input series of the model which subsequently generates flows to represent the climate in the 2080s. A Reliability, Resilience and Vulnerability (RRV) analysis is then carried out to allow quantification of changes in river flows under climate change. Both current and future flows are interpreted in terms of hydraulic features such as flow depths, flow velocities, Froude number and discharge per metre width. These are then compared with suggested ideal salmon flow characteristics from the literature. Using the Table 1.Channel properties of the four study sites .
Temple Kirkby Hallgarth Artlegarth Sowerby Stephen
Catchment area (km2) 616 69 27 0.95
Bankfull width (m) 50 23 11 5.92 Channel base width (m) 37.5 10 9.1 5.2 Slope(m/m) 0.0015 0.007 0.013 0.046 Mannings n 0.04 0.06 0.05 0.07
current and future flow duration curves, the percentage of time that flows equivalent to the values in the literature is determined.
THE SHETRAN MODEL - SETUP
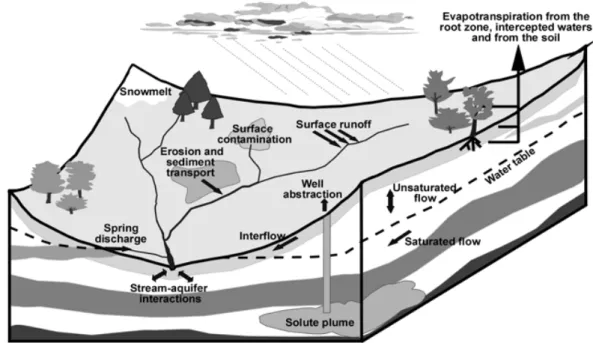
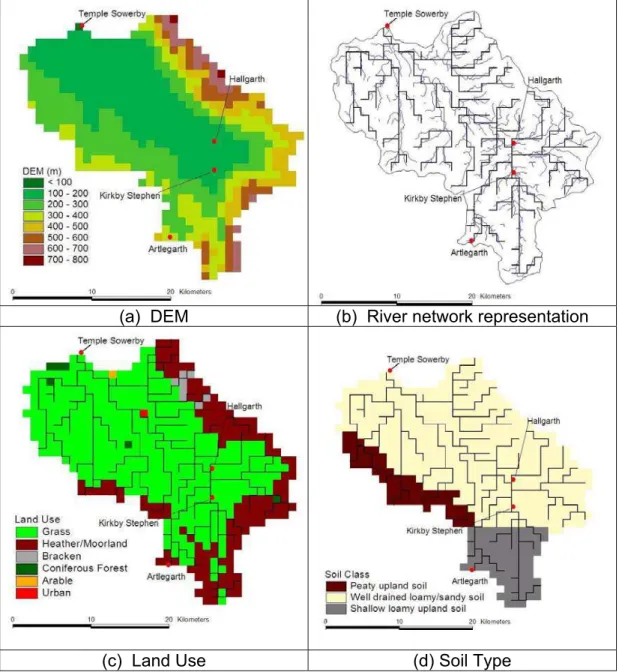
To provide a distributed and physically-based framework for the impact study, the SHETRAN hydrological modelling system was established for the catchment. SHETRAN is a 3D coupled surface/subsurface physically-based, spatially-distributed, finite-difference model for coupled water flow, multi-fraction sediment transport and multiple reactive solute transport in river basins. Figure 3 highlights the main processes simulated in SHETRAN. SHETRAN gives a detailed description in time and space of the flow and transport in a river basin. This makes it a powerful tool for studying the environmental impacts of land erosion (e.g. Wicks and Bathurst, 1996), pollution (Birkinshaw and Ewen, 2000) and the effects of changes in land use and climate (e.g. Ewen and Parkin, 1996; Parkin et al., 1996), and also in studying surface-water and ground-water resources and management (e.g. Adams et al., 1995a; Ewen et al., 2000). In this study, all hydrological components of SHETRAN are represented. The model applied here represents the catchment at a 1-km scale and simulates time series of flows from 01/01/92 to 31/12/99 on an hourly time-step (Fig. 4.) Spatial datasets of each of the physical characteristics, namely elevation, river network, land-use and soil types as well as a time series of the meteorological variables are provided on 1-km grids.
PRECIPITATION AND POTENTIAL EVAPORATION INPUTS FOR SHETRAN
Since the focus of this paper is on climate change, it is important to describe in detail the derivation of the required precipitation and potential evapotranspiration (PET) time series as input for the model.
Precipitation
An hourly time series of precipitation was required that provided a good spatial representation within and around the Eden catchment. For the simulation period, data from three hourly and seventeen daily raingauges were available (Fig. 2). Data from the daily raingauges were disaggregated to an hourly time step, using a relationship between rainfall duration and daily totals of precipitation from the nearest hourly raingauge. Thiessen polygon analysis then determined which raingauge would represent each of the SHETRAN 1-km grid squares.
Potential evaporation
A daily PET series was created for each of the seventeen raingauges by using the Penman-Monteith method (Allen et al., 1994) for one station and then applying the Blaney-Criddle (Blaney and Blaney-Criddle, 1950) equation for the other stations, by regression. One automatic weather station in the catchment at Warcop SAWS (OS ref: NY 749156) records hourly wind direction and hourly wet and dry bulb temperatures. Nearby, at Shap SAWS (OS ref: NY 557120), radiation is recorded hourly. Data for Warcop and Shap SAWS were available from the British Atmospheric Data
Centre (BADC) from 19971999. For this period the
Penman-Monteith equation was used to calculate PET for Warcop SAWS. Values of constants needed for the Penman-Monteith equation were taken from the Met Office Rainfall and Evaporation Calculation System (MORECS, Meteorological Office, 1981).
Mean monthly PET values calculated for Warcop SAWS (19971999) were compared with mean monthly temperatures for that time period; the resulting linear relationship is shown in Fig. 5. The gradient and intercept produced by the relationship are the empirical coefficients
a and b of the Blaney-Criddle potential evapotranspiration equation:
) (DTE
p
PETt t ( 1)
where
PETt= PET estimated by Penman-Monteith formulation pt = mean daily percentage (for month) of total annual
daytime hours
a = empirically derived, 0.456
b = empirically derived, 0.416 T = temperature in °C
For the site at Warcop SAWS, a full daily PET series was created for the 19921999 period from the temperature series, using the Blaney-Criddle equation. The equation was
(a) DEM
(b) River network representation
(c) Land Use
(d) Soil Type
then used to create PET series for each raingauge in the simulation. Within and surrounding the Eden catchment five daily air temperature gauges were in operation throughout the simulation period. A lapse rate of temperature with elevation determined by regression was used to infill missing data by application to the nearest gauge series.
From the complete daily temperature series (19921999) for the five temperature gauges, monthly mean temperatures were calculated. The same lapse rate was then used to create mean monthly temperature values for each of the raingauges using its nearest temperature gauge to be used in generating mean monthly PET series.
Using mean monthly temperature values it was then possible to use the Blaney-Criddle equation, with a and b
coefficients determined from the site at Warcop SAWS, along with the p coefficients to generate a monthly PET value for each raingauge. These monthly values were subsequently disaggregated into daily values using the following equation which again took the complete data record at Warcop SAWS as a reference.
(2)
MODEL CALIBRATION
Calibration and validation was carried out within the framework proposed by Kleme (1986) i.e. a split-sample test. The model was calibrated on a time period (19921994) using measured flows from Temple Sowerby. This was achieved by selecting parameters based on known literature values, and from previous experience of modelling upland catchments (e.g. Adams et al., 1995; Lunn et al., 1996). The model was subsequently validated on the period (1995 1999). The Nash-Sutcliffe efficiency measure was calculated
for each period and values of 0.80 and 0.75 were achieved for the calibration and validation respectively.
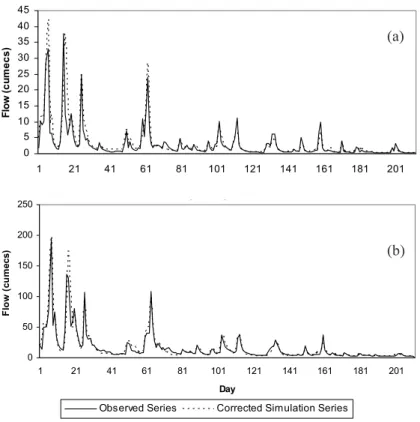
For sites with small catchment areas, the model underestimated flows during the recession part of the hydrograph so quantile correction was applied to simulated flows (Wood et al., 2002). The outputs from the two model river links representing Kirkby Stephen (KS) and Temple Sowerby (TS) were compared with those of the gauging stations at the two sites. Both series were ranked and the ratio at each quantile was then applied to the simulated time series. Flows at all links were then corrected by the factor from the nearest gauge, with a linear interpolation between quantiles. Nash-Sutcliffe efficiency subsequently increased from 0.77 to 0.86 at TS and from 0.67 to 0.73 at KS. This procedure caused minor differences to subsequent analysis (i.e. RRV analysis) as the study is primarily concerned with the nature and direction of changes in the flows. Figure 6 shows a short period of data confirming that the model reproduces the range of flows well at KS and TS.
CLIMATE CHANGE SCENARIOS
The SHETRAN model was run for the catchment using current climate conditions (19921999) as described above. Assuming the same catchment physical parameters, the model was also run to simulate future climatic variations. The study uses the UKCIP02 climate change scenarios for the UK (Hulme et al., 2002), which were produced using the HadRM3H regional climate model, developed at the Hadley Centre, Met Office, UK and based on the HadCM3 global climate model. For each 50 km grid cell, an ensemble of three integrations is available as a reference baseline or control period (19601990). Similarly, an ensemble of three integrations is available for the period 20702100, based on the IPCC A2 SRES (Special Report on Emissions
Mean monthly PET and temperature at Warcop SAWS 1997-1999
y = 0.4562x + 0.4157 R2 = 0.8224
0 1 2 3 4 5 6 7 8 9
0 2 4 6 8 10 12 14 16 18
Mean monthly temperature (oC)
M
ean
m
o
n
th
ly P
E
T
(
m
m
/yr
)
Fig. 5. Relationship between mean monthly potential evapotranspiration values and mean monthly temperature values calculated at Warcop SAWS from 1997 to 1999.
i
i day
Warcop month
Warcop month x day
x
PE
PE
PE
PE
¸
¸
¹
·
¨
Fig. 6. Time series of flows from January to July 1999 at (a)Kirkby Stephen, (b) Temple Sowerby. (Day 1 = January 1st)
0 5 10 15 20 25 30 35 40 45
1 21 41 61 81 101 121 141 161 181 201
Fl
ow
(
c
um
e
c
s
)
y y
0 50 100 150 200 250
1 21 41 61 81 101 121 141 161 181 201
Day
F
lo
w
(
c
u
m
ecs)
Observed Series Corrected Simulation Series
Scenarios) storyline (IPCC, 2000), known in UKCIP02 as the Medium-High Emissions scenario.
The UKCIP02 climate change scenarios (20702100) predict that the UK climate will become warmer (~2.5 3o
C), with temperature increases being greater in the summer and autumn and less in spring and winter seasons. In terms of precipitation, winters will become wetter and summers drier throughout the UK. In the north-west, summer precipitation is expected to decrease by 1530 % by the 2080s under the Low Emissions scenario, while under the High Emissions scenario most of the region will suffer a 3045 % decrease (Hulme et al., 2002).
The grid cell covering the Upper Eden catchment was identified and the values of the ratio of future to control precipitation in that grid square, calculated for each month, were then applied to the precipitation series used in the SHETRAN simulation. Similarly, the values of ratio of change in the mean monthly values of control and future PET, (Ekström et al., 2007) were applied to the PET series. Two future scenarios are presented in this study: scenario 1 applies monthly change factors to both precipitation and PET series and scenario 2 applies factors only to the precipitation series. This distinction is made to identify the relative effects of changes in PET and rainfall.
RELIABILITY, RESILIENCE AND VULNERABILITY (RRV) ANALYSIS
The RRV methodology developed by Hashimoto (1982) provides system performance criteria that capture aspects of performance which are especially important during periods of extreme weather, such as drought or peak demands. RRV criteria have been used in a range of applications such as: evaluating performance of water resource systems (e.g. Fowler et al., 2003; Lettenmaier et al., 1999) and in evaluating ecological systems (ASCE Task Committee on Sustainability Criteria, 1998). Reliability is the probability that a particular value will be within the range of values considered to be satisfactory. Resilience is an indicator of the speed of recovery from an unsatisfactory condition, i.e. the probability that a satisfactory value will follow an unsatisfactory value. Vulnerability is a statistical measure of the extent or duration of failure, should a failure (i.e. unsatisfactory value) occur.
RRV analysis was used in this study to determine how extreme flows (Q5 and Q95) and the mean flow (Q50) would
be affected under the two future scenarios. The components were determined as follows:
Reliability: ((total no. of days number of days that do not achieve the prescribed flow) / total no. of days) * 100
(a)
Resilience: (number of times a satisfactory value of prescribed flow follows an unsatisfactory value / number of unsatisfactory values) * 100
Vulnerability: maximum number of consecutive failure days / maximum number of consecutive failure days for the 3 scenarios
HYDRAULIC MODEL
Four sites within the catchment were chosen to be analysed using a hydraulic modelling approach. With SHETRAN providing a series of simulated flows, it is possible to relate hydraulic parameters to flow conditions using Mannings equation:
2 1
0 3 2
S R n A
Q ¸
¹ · ¨ © §
(3)
where: n is Mannings coefficient, S0 is slope of the channel bed, R is hydraulic radius, Q is discharge and A the cross-sectional area of flow.
Channel property data for the four study sites were determined by field measurement of average bankful width, channel slope and Mannings n coefficient estimation over a 50 m reach. To apply the hydraulic equations to the study, sites were standardised and assumed to be of trapezoidal shape and having banks with a 1 in 2 gradient. In reality, streams do not have flat bottoms or uniform banks due to natural processes of river transport and erosion, which also create complex geomorphological features, of which the poolriffle sequence may be the most important in terms of salmonid habitat. However, by choosing four very different sites in terms of size, gradient and flow yet keeping a standard shape, flow behaviour can be analysed without integrating channel morphology. For example, depth and velocity measurements would vary depending on where they are measured in the channel, i.e. in a pool or a riffle. A separate sensitivity modelling study was carried out in relation to this work; this analysed to what extent hydraulic parameters varied with channel properties. Such analysis is beyond the scope of the present work; however, it was found that both depth and velocity were the most sensitive to physical channel properties (Walsh, 2004).
IDEAL ATLANTIC SALMON FLOW PARAMETERS
Many studies have proposed ideal habitat conditions for salmon populations at various life stages in the freshwater environment. This study has taken the following criteria that consider the spawning, juvenile and migration life stages of salmon, and determined when the ideal parameters are achieved at the four study sites:
1. Data on fish movement and flow data from over 14 000 fish on rivers in north-west England led Stewart (1969) to hypothesise an empirical method for setting flow targets for salmon migration and angling, based on the discharge per unit width (q).
The targets are as follows and apply to adult fish:
l Survival flow 0.03 m3
s1
per metre width l Start of migration 0.08 m3
s11
per metre width l Peak intensity of 0.20 m3
s1
per metre width migration
l Angling 0.29 m3
s1
per metre width
2. Moir et al. (2002) proposed Froude number (Fr) as a single descriptor of hydraulic habitat, as it is more versatile than the use of depth and velocity independently. Since it is dimensionless, it is more applicable to a range of river and fish species sizes, therefore integrating depth and velocity in a manner which provides a scale independent explanation of the relationship between these variables in spawning habitat utilisation. In addition, they argue that Froude number is widely used in open-channel hydraulics as a powerful descriptor of the flow state and regime in streams. Their study was carried out on the River Dee, an important salmon river in north-east Scotland, on both the mainstem of the river and its tributaries. They found optimal hydraulic conditions for spawning Atlantic salmon to be: minimum depth of 0.15 m and optimal range of Fr of 0.300.44, with a mean of 0.38.
3. Ideal flow depths and velocities for spawning and juvenile salmon by Hendry and Cragg-Hine (1997), which were based on a review of studies, (Table 2 cites these values).
Management of flow regimes is increasingly tending towards retaining intra/inter-annual flow variability, as a range of flows is required to protect and sustain a range of life cycle stages and organisms (e.g. Poff, 1996; Stanford et al., 1996; Richter et al., 1996, 1997; Olden and Poff, 2003). However, this study uses easily applicable hydraulic variables which are compared with habitat suitability parameters and thresholds.
constructed for typical spawning months for the catchment (October to December), likewise with migration targets (June to September)), the percentage time that discharge equated to the ideal requirements was determined. For depth and velocity suggestions for juvenile salmon, annual flow duration curves were used.
Results and discussion
FUTURE CHANGES IN PRECIPITATION AND
POTENTIAL EVAPORATION
Increases in temperature cause increases in PET rates. Figure 7a shows how the predicted factors of change between future PET (20702100) and those of the control (19611990) period affect mean monthly values of PET for the simulation period of the SHETRAN model. Each month shows an increase. However the increase is greater from May to October, reflecting greater increases in temperature during summer and autumn months. Figure 7b shows monthly precipitation for the current and future scenarios with precipitation increasing during the months of October to April, and decreasing during May to September.
FUTURE CHANGES IN AVERAGE ANNUAL AND MONTHLY RUNOFF
Temporal hydrological variability in a catchment is influenced at a range of time scales, with precipitation being the main driver. For example, flood frequency is affected by changes in year-to-year precipitation variability and by changes in short-term rainfall properties. In contrast, the frequency of low flows and droughts is affected primarily by changes in the seasonal distribution of precipitation, year-to-year variability and the occurrence of prolonged droughts (Arnell and Liu, 2001). With increases in precipitation in winter months and decreases in summer months, coupled with increases in PET throughout the year, increases in high flows and decreases in low flows would be expected. Figure 8a shows an annual flow duration curve from the SHETRAN river link representing the outlet of the study catchment at
Temple Sowerby for the three scenarios simulated, i.e. current climate conditions, future scenario 1 (ratios of change between future and control period precipitation and PET applied to both input series) and future scenario 2 (ratios of change applied only to the precipitation series).
Both future scenario simulations predict an increase in high flows, with future scenario 2 causing a greater increase, as the impact is not offset by an increase in PET as with scenario 1. Decreases in precipitation and increases in PET during periods of low flow result in future scenario 1 having a greater reducing impact on low flows. This is also reflected in Fig. 8b which shows the mean monthly runoff totals at Temple Sowerby for the three scenarios, with scenario 2 showing greater increases in the winter months. A similar trend has been observed by Fowler and Kilsby (2007), who found upland catchments in north-west England demonstrated reductions in mean monthly runoff from May to September, yet increases from November to April.
RELIABILITY, RESILIENCE AND VULNERABILITY (RRV) ANALYSIS
RRV analysis was performed on time series of flows extracted from the SHETRAN river links representing each of the four study sites. Results are presented in Table 3. At all four sites reliability analysis shows that the flow that represents the Q95 flow under current conditions will be
achieved for a shorter period of time, i.e. reliability will decrease. For example at the Temple Sowerby site, Q95 is
predicted to become a Q85 flow under scenario 1 and a Q90
flow under scenario 2. The reduction in the Q95 flow is
greater at smaller sites, i.e. at Artlegarth, a first order stream draining a catchment area of 1 km2
. Reductions in the Q95
flow would have implications for management of flows, in that compensation flows would need to be addressed. In terms of the Q50 flow, the greatest reduction is predicted at
Temple Sowerby, the largest study site in terms of catchment area and width, with a lesser impact predicted to occur at Artlegarth. A small increase in high flows (Q5) is expected
at all four sites; this was also reflected in the increases shown at higher flows of the flow duration curve for Temple Table 2. Ideal minimum flow depths and velocities for juvenile Atlantic salmon
(Source: Hendry and Cragg-Hine, 1997).
Life stage Ideal minimum velocity Ideal minimum depth
(m s1) (m)
Spawning 0.25 0.17
Mean Monthly Potential Evaporation Totals
0 20 40 60 80 100 120
J F M A M J J A S O N D
M
ont
hly
P
E
(
m
m
)
Mean Monthly Precipitation Totals
0 50 100 150 200 250
J F M A M J J A S O N D
Month
P
re
c
ipit
a
tion (
m
m
)
Current Future
Fig. 7. (a) Mean monthly PET totals for the current and future input series, (b) Mean monthly precipitation totals for the current and future input series. (Current conditions refers to simulation period 19921999).
Temple Sowerby
1 5 10 20 30 40 50 60 70 80 90 95
0.1 1 10 100 1000
Percentage of tim e flow exceeded
Fl
ow
(
c
ume
c
s
)
Monthly Runoff at Temple Sowerby
0 20 40 60 80 100 120 140 160 180
J F M A M J J A S O N D
Month
R
u
nof
f (
m
m
)
Future Scenario 2 Future Scenario 1 Current Conidtions
Fig. 8. (a) Annual flow duration curve at Temple Sowerby for the three scenarios (current conditions, future scenario 1 and future scenario 2). (b) Mean monthly runoff totals at Temple Sowerby for the three scenarios (current conditions, future scenario 1 and future scenario 2). (Current conditions refers to simulation period 19921999).
(a)
(b)
(a)
Sowerby (Fig. 8a).
Resilience analysis is intended to measure the impact of flow variability on fisheries. For example, a fish may be able to survive for one or two days if flow conditions do not meet their ideal requirements. However, if the number of failure days is longer then the effect may be more detrimental. During the summer of 2003, numerous dead Atlantic salmon were found in the Tyne estuary, NE England. This was thought to be a consequence of a series of low flow days, resulting in higher water temperatures and hence low oxygen concentrations. In this case, the Environment Agency managed the problem by ordering a release from the nearby Kielder Reservoir to allow the salmon to migrate upstream (Norton, 2003). The resilience of the Eden system under current conditions is relatively poor. For example, for the Q95 flow at Temple Sowerby, resilience was calculated
to be 14.9%. Under both future scenarios resilience is predicted to decrease, with scenario 1 again showing a greater decrease. Figure 9 shows the frequency distribution of the duration of days that fail to maintain the current Q95
flow. The distribution clearly shows that under the future scenarios the duration of failure days will increase.
Vulnerability analysis can be used to determine the duration or extent of failure of a system. In this case duration is presented. Vulnerability analysis suggests future scenario 1 has the greatest impact on flows in the catchment. Understandably, under scenario 2, vulnerability appears to be scaled by catchment area. i.e. the site at Artlegarth is predicted to be more vulnerable than that at Temple Sowerby. This is because sites with small catchment areas such as Artlegarth (~ 1 km2
) located in upper reaches of catchments exhibit a more flashy response to flow, given their lower levels of base flow as they are first order streams. Flow duration curves at such sites show a steep gradient. Sites located further down the catchment system are less vulnerable during periods of low flow as they have larger base flows from a greater number of contributing tributaries.
CLIMATE SCENARIO COMPARISON
Using the latest UKCIP02 climate change scenarios (2070 2100), future flows for the Eden catchment are projected to change. High winter flows will increase and low summer flows will decrease. However, uncertainty in climate change projections may result from many different factors such as future emissions, model parameterisation and natural climate variability (Fowler and Kilsby, 2004). Also, results are based only on one climate scenario (medium-high emissions from HADRM3H). A simple methodology was developed to investigate how monthly catchment runoff may be influenced by different scenarios and time slices. This uses Table 3. RRV analysis of Q95 Q50 and Q5 flows at the four sites
(Temple Sowerby, Kirkby Stephen, Hallgarth and Artlegarth) for the three scenarios (current conditions, future scenario 1 and future scenario 2). (Current conditions refers to simulation period 1992 1999).
Flow Conditions Reliability Resilience Vulnerability
(%) (%) (01)
TEMPLE SOWERBY
Q95 Current 95 14.86 0.41
F1 85.38 5.15 1 F2 90.41 11.07 0.57
Q50 Current 50 9.16
-F1 36.22 5.26 -F2 42.73 6.40
-Q5 Current 5 2.56
-F1 5.24 2.46 -F2 6.54 2.82
-KIRKBY STEPHEN
Q95 Current 95 13.01 0.38 F1 82.40 3.50 1 F2 86.58 5.36 0.86
Q50 Current 50 9.62 -F1 44.64 5.50 -F2 47.38 6.83
-Q5 Current 5 2.88 -F1 5.85 3.02 -F2 6.33 3.33
-HALLGARTH
Q95 Current 95 14.18 0.75
F1 80.79 11.59 1 F2 89.18 22.15 0.94
Q50 Current 50 5.60
-F1 37.83 3.19 -F2 43.31 3.99
-Q5 Current 5 2.63
-F1 5.14 2.56 -F2 6.16 2.77
-ARTLEGARTH
Q95 Current 95 7.84 0.45 F1 82.99 2.21 1 F2 85.45 2.59 0.96
Q50 Current 50 3.12 -F1 43.24 1.63 -F2 45.40 1.76
scaling factors (Table 4) developed by UKCIP02 representing four different SRES emissions scenarios (Low, Medium-Low, Medium-High and High) and three time-slices for 2020s, 2050s and 2080s. These factors were applied to monthly precipitation and PET amounts. Monthly runoff totals were generated from a multiple regression equation based on monthly precipitation, PET and runoff totals from each simulated month for current and future conditions. Figure 10a shows monthly runoff totals for the 2080s under the four emissions scenarios. The predicted differences in totals between the High and the Low scenarios are greater for extreme periods, i.e. percentage differences are greater in low flow summer months and high flow winter months. In terms of differences in time periods (Fig. 10b), a similar trend is observed with summer months for the 2080s showing up to an 80% reduction when compared with the 2020s. It is therefore important to exercise caution when interpreting results from climate studies.
PERCENTAGE TIME MINIMUM IDEAL SALMON PARAMETERS ARE ACHIEVED
Survival and upstream migration flows for adult salmonids Table 5a presents the percentage time the discharge
equivalent to the minimum ideal discharge per metre width parameter suggested by Stewart (1969) is achieved. Under current conditions, Temple Sowerby offers the required discharge for a survival flow 100% of the time, and shows very little predicted change under both future scenarios. A great reduction in achieving the survival flow is witnessed under current conditions at the other sites, with the percentage of time decreasing as the sites decrease in terms of catchment area and bankfull width. Flows required to initiate upstream migration are achieved substantially less. At Temple Sowerby under current conditions, flows are only achieved 43% of the time. Under scenario 1 this would be expected to decrease to 14% and, even under scenario 2, a near 50% reduction is predicted. Such a reduction is due to predicted decreases in high flows during the dominant upstream migration months. Figure 11 shows the flow duration curves for Temple Sowerby during the migration months (June to September). Under current conditions Q5
would represent a discharge of 11.6 m3
s1
. However, under future scenarios 1 and 2 this would reduce to 4.3 m3
s1
and 5.5 m3
s1
respectively.
Such reductions in high flows (or spates) are detrimental to salmon aiming to reach spawning grounds upstream; spates are of critical importance to migration of salmon in
Table 4. Multiplying factors for conversion from 2080s Medium-High scenario to other scenarios and time-slices. (Source: Hulme et al., 2002).
Time-Slice Low Medium-low Medium-high High emissions emissions emissions emissions
2020s 0.24 0.27 0.27 0.29 2050s 0.43 0.50 0.57 0.68 2080s 0.61 0.71 1.00 1.18
Temple Sowerby
0 2 4 6 8 10 12
1 2 to 5 5 to10 10 to 20 20 to 50 50 to 100 100 to 125 Duration (days)
Fr
e
que
nc
y
of
Oc
c
u
rr
e
nc
e
Current Conditions Future Scenario 1 Future Scenario 2
1139 Fig. 10. (a) Monthly runoff predicted for 2080s under the four emissions scenarios (Medium-High, High, Medium-Low, Low) at Temple Sowerby. (b) Monthly runoff predicted for the Medium-High emissions scenario for the three time-slices (2080s, 2050s, 2020s).
(a)
(b)
summer (Solomon et al., 1999); they tracked radio-tagged salmon in six rivers in south-west England. Particularly in dry years, spates represented the only occasions during a period of several months that flow exceeded the threshold level for migration. Fish that delayed entering the river due to lower flows died. In a drought year, half or more of the years run of fish were lost this way. Healey (2001) stated that the bioenergetics of returning salmon adults is finely balanced so that, when faced with unusual flow conditions, they can suffer energetic exhaustion.
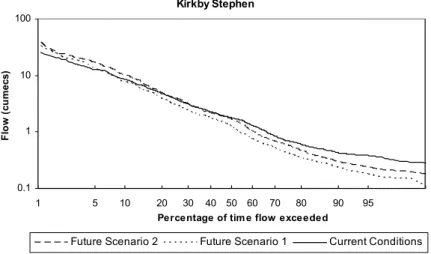
Spawning activity (flow depth and Froude number analysis) Combined minimum depth and Froude number analysis, as suggested by Moir et al. (2002), provides a realistic indication of the ranked suitability of the four study sites for spawning. Spawning activity does not occur at the Artlegarth site, given the steep channel slopes and obstacles to migration further downstream. At Temple Sowerby, the percentage time that discharge is equivalent to both minimum depth and Froude number is relatively low, only
14% under current conditions. Kirkby Stephen is the most suitable site for spawning, followed by Hallgarth; however, both sites will be less suitable under future climatic conditions. Figure 12 shows flow duration curves for Kirkby Stephen during spawning months (October to December). Future conditions are projected to increase high flows and decrease low flows. Whereas floods have been observed to be advantageous in de-silting spawning gravels, they have also been found to be detrimental in flushing out such gravels. A large flash flood occurring in the River Ettrick, a tributary of the River Tweed, Scotland, washed out the majority of salmon eggs laid in the gravels (Gilvear et al., 2002). Five years (average life span of salmon on the River Ettrick from egg to spawning) after the event, the recorded spring salmon catch of the river has been depleted. Reduced numbers of juvenile salmon were also observed on the River Broom, north-west Scotland, in the years following a major wash-out of redds (Gilvear et al., 2002).
In contrast, once redds have been constructed, any sudden decrease in flows could potentially leave redds stranded out
2080s Monthly Runoff
0 20 40 60 80 100 120 140 160
Jan Feb Mar Apr May Jun Jul Aug Sep Oct Nov Dec
Month
T
o
ta
l Mo
n
th
ly
R
u
n
o
ff
(m
m
)
Medium High Emissions Monthly Runoff
0 20 40 60 80 100 120 140 160
Jan Feb Mar Apr May Jun Jul Aug Sep Oct Nov Dec
Month
T
o
ta
l Mo
n
th
ly
R
u
n
o
ff
(m
m
)
Table 5. (a) Percentage time the discharge equivalent to the minimum ideal discharge per metre is exceeded. (b) Percentage time the discharge equivalent to the minimum flow depth and Froude number are exceeded. (c) Percentage time the discharge equivalent to the minimum flow depths and velocities are exceeded under current climatic conditions (C), future scenario 1 (F1) and future scenario 2 (F2). (Current conditions refers to simulation period 19921999).
(a) PERCENTAGETIMETHEDISCHARGEEQUIVALENTTOTHEMINIMUMIDEALQISEXCEEDED
Movement Temple Sowerby Kirkby Stephen Hallgarth Artlegarth
Scenario C F1 F2 C F1 F2 C F1 F2 C F1 F2
Survival flow100 94 98 82 69 73 42 31 37 10 10 11 Start of migration 43 14 22 17 3 15 5 0 0 0 0 0 Peak migration 11 0 1 5 0 0 0 0 0 0 0 0
(b) PERCENTAGETIMETHEDISCHARGEEQUIVALENTTOTHEMINIMUMIDEALDEPTHAND FROUDE NUMBERAREEXCEEDED
Spawning activity Temple Sowerby Kirkby Stephen Hallgarth Artlegarth
Scenario C F1 F2 C F1 F2 C F1 F2 C F1 F2
Minimum depth 100 96 99 80 66 74 49 26 39 1 2 2 Minimum Froude Number 14 9 15 99 85 90 100 100 100 0 0 0 Combined minimum depth
and Froude Number 14 9 15 80 66 74 49 26 39 0 0 0
(c) PERCENTAGETIMETHEDISCHARGEEQUIVALENTTOTHEMINIMUMIDEALDEPTHISEXCEEDED
Life stage Temple Sowerby Kirkby Stephen Hallgarth Artlegarth
Scenario C F1 F2 C F1 F2 C F1 F2 C F1 F2
Spawning activity 100 94 96 74 60 68 44 23 37 0 0 0 Fry and yearling parr 84 71 78 50 45 48 25 20 24 0 0 0 Yearling and older parr 84 71 78 50 45 48 25 20 24 0 0 0
PERCENTAGETIMETHEDISCHARGEEQUIVALENTTOTHEMINIMUMIDEALVELOCITYISEXCEEDED
Life Stage Temple Sowerby Kirkby Stephen Hallgarth Artlegarth
Scenario C F1 F2 C F1 F2 C F1 F2 C F1 F2
Spawning activity 100 99 100 100 93 98 81 47 64 66 52 58 Fry and yearling parr 44 33 38 45 41 43 38 28 33 9 10 10 Yearling and older parr 31 25 29 32 29 31 33 25 30 5 6 6
Temple Sowerby
1 5 10 20 30 40 50 60 70 80 90 95
0.1 1 10 100
Percentage of tim e flow exceeded
F
low
(
c
ume
c
s
)
Future Scenario 2 Future Scenario 1 Current Conditions
of water either before fertilisation or after, preventing
emergence of fry. Also redds may become dried out as flows reduce. On the River Avon, south-west England, Solomon et al. (1999) found that in the dry autumns of 1989 and 1990, the geographical distribution of spawning activity was truncated due to the resultant low flows.
Ideal flow depths and velocities for juvenile salmonids Table 5c presents the results based on ideal minimum flow depths and velocities for juvenile Atlantic salmon, as described by Hendry and Cragg-Hine (1997). In terms of flow depth, when the parameters are considered jointly, the Artlegarth is clearly unsuitable as a salmon habitat. The three remaining sites indicate that ideal depths are achievable more readily than ideal velocities. The percentage of time that depths and velocities reach minimum tolerable values is predicted to decrease under both future scenarios; again the impact is predicted to be greater under scenario 1. For example, at Hallgarth, suitable velocity for fry and yearling parr will decrease from 38% to 28% under scenario 1 and to 33% under scenario 2. Depths at the same site are predicted to decrease from 25% to 20% under scenario 1 and 24% under scenario 2.
Juvenile salmonids rely on areas of relatively shallow, fast-flowing water and are, therefore, likely to be strongly influenced by changes in water discharge (Souchon et al., 1989, in Huntington et al., 1999). Winfield et al. (2004) cite a study by McDermott (2001) who found that wetter springs and the associated higher river flows of the 1990s compared with those of the 1970s and 1980s in the River Bush of Northern Ireland were associated with a decreased survival of Atlantic salmon to smoltification.
A good indication of the effects of reduced flows can be estimated from conditions following dam construction.
Reduced flood magnitudes below the Spey Dam on the River Spey, Scotland, have induced channel narrowing and aggradation over the last 60 years; this is thought to have decreased areas of suitable habitat (Gilvear, 2000, in Gilvear et al., 2002). Similarly, Gibbins and Acornely (2000) suggest that the prescribed compensation flow for the river provides between 50% and 90% of the maximum possible weighted usable area for juvenile salmonids. However, during hydroelectric power releases, weighted usable area decreases to between 20% and 40% of site maxima.
Conclusions
The reliability component of the RRV analysis has proved to be a good quantitative indicator of how climate change will affect river flows. Such an approach would be useful if prescribed flows are based on achieving certain flow quantiles. Resilience results for each of the study sites indicate that the system is not very resilient to periods of determined unacceptable flows. During periods of sustained low flows such an analysis should alert managers to the potential impact on salmonids and other species. Vulnerability analysis is limited in this study, in that only three conditions were compared. The approach could be improved by comparing additional climate scenarios or other factors that affect salmonid habitat.
The method presented represents a simple hydraulic approximation of the four study sites; in reality rivers are much more variable. Future work will aim to develop a more sophisticated 2-D river network model to incorporate velocity and depth profiles and geomorphological features such as poolriffle sequences. Habitat requirements of Atlantic salmon include a range of both abiotic and biotic factors that have complex interactions (Armstrong et al.,
Kirkby Stephen
1 5 10 20 30 40 50 60 70 80 90 95
0.1 1 10 100
Percentage of tim e flow exceeded
Fl
ow
(
c
u
m
e
c
s
)
Future Scenario 2 Future Scenario 1 Current Conditions
2002). This study has focused on how the predicted changes in the flow regime may affect Atlantic salmon in the Eden catchment; yet a more realistic approach would consider the range of biotic and abiotic factors. For example, water temperature is obviously affected by climate change. However, inferences from flow regimes are perhaps more easily managed by amending minimum flows of rivers. Interpreting the flow regime in terms of hydraulic charactristics that are important to salmon at a range of sites across the catchment has shown that under climate change the percentage time that the discharge required to equitable flows will decrease. For future management of this and similar catchments and the protection of species, such changes must be considered in setting both minimum ecological flows and the management of reservoir releases.
Acknowledgements
This work was undertaken as part of a PhD thesis funded by the Natural Environment Research Council and was also part of the SWURVE (Sustainable Water: Uncertainty, Risk and Vulnerability Estimation in Europe) project, funded under the EU Environment and Sustainable Development programme, grant number EVK1-2000-00075. Rainfall and temperature data were obtained from the British Atmospheric Data Centre. The HadRM3H data were supplied by the Climate Impacts LINK project (DEFRA Contract EPG 1/1/154) on behalf of the Hadley Centre. The authors thank Jane Atkins (Environment Agency, Penrith) for introducing Stewarts equations and Ian Winfield (CEH, Lancaster) for his review of the potential impacts of climate change on Atlantic salmon. At the School of Civil Engineering and Geosciences, University of Newcastle upon Tyne, Michael Murrays development of Hydraulic Assistant enabled fast calculations of hydraulic variables and Hayley Fowler assisted with climate change scenarios.
References
Adams, R., Dunn, S.M., Lunn, R., Mackay, R. and OCallaghan, J.R., 1995. Assessing the performance of the NELUP hydrological models for river basin planning. J. Environ. Econ. Manage., 38, 5376.
Allen, R.G., Smith, M., Pereira, L.S. and Perreir, A., 1994. An update for the calculation of reference potential evapotranspiration. ICID Bull.,43, 3592.
Armstrong, J.D., Kemp, P.S., Kennedy, G.J.A., Ladle, M. and Milner, N.J., 2002. Habitat requirements of Atlantic salmon and brown trout in rivers and streams. Fish. Res., 1428, 128. Arnell, N. and Liu, C., 2001. Hydrology and water resources. In:
Climate change 2001: impacts, adaptation and vulnerability. Contribution of Working Group I to the Third Assessment Report of the Intergovernmental Panel on Climate Change, J.T. Houghton, Y. Ding, D.J. Griggs, M. Noguer, P. van der Linden,
X. Dai, K. Maskell and C.I. Johnson, (Eds.), Cambridge University Press, Cambridge, UK. 193233.
ASCE Task Committee on Sustainability Criteria, 1998.
SustainabilityCriteria for Water Resource Systems. American Society of Civil Engineers, Virginia.
Bardonnet, A. and Bagliniere, J.L., 2000. Freshwater habitat of Atlantic salmon (Salmo salar). Can. J. Fish.,57, 497506. Beland, K.F., Jordan, R.M. and Meister, A.L., 1982. Water depth
and velocity preferences of spawning Atlantic salmon in Maine rivers. N. Amer. J. Fish. Manage., 2, 1113.
Birkinshaw, S.J. and Ewen, J., 2000. Modelling nitrate transport in the Slapton Wood catchment using SHETRAN. J. Hydrol.,
230, 1833.
Blaney, H.F. and Criddle, W.D., 1950. Determining water requirements in irrigated areas from climatological and irrigation data. USDA, Soil Conservation Service, TP-96. Crisp, D.T., 1993. The environmental requirements of salmon and
trout in freshwater. Freshwater Forum, 3, 176202.
Crisp, D.T., 1996. Environmental requirements of common riverine European salmonid fish species in fresh water with particular reference to physical and chemical aspects. Hydrobiol.,323, 201221.
Crisp, D.T. and Carling, P., 1989. Observations on siting, dimensions and structure of salmonid redds. J. Fish Biol., 34, 119134.
DeVore, P.W. and White, R.J. 1978. Daytime responses of brown trout (Salmo trutta) to cover stimuli in stream channels. Trans. Amer. Fish. Soc. 115, 671681.
Ekström, M., Jones, P.D., Fowler, H.J., Lenderink, G., Buishand, A. and Conway, D., 2007. Regional climate model data used within the SWURVE project. 1: Projected changes in seasonal patterns and estimation of PET. Hydrol. Earth Syst. Sci.,11, 10691083.
Elliot, J.M. and Hurley, M.A., 1998. Predicting fluctuations in the size of newly emerged sea-trout fry in a Lake District stream.
J. Fish Biol.,53, 11201133.
European Communities 1992. Council Directive 92/43/EEC of 21 May 1992 on the conservation of natural habitats and of wild fauna and flora. Official Journal of the European Communities. Ewen, J. and Parkin, G., 1996. Validation of catchment models for predicting land-use and climate change impacts. 1: Method.
J. Hydrol.,175, 583594.
Ewen, J., Parkin, G. and OConnell, P.E., 2000. SHETRAN: distributed river basin flow and transport modelling system. J. Hydro. Eng.,5, 250258.
Fowler, H.J. and Kilsby, C.G., 2007. Using regional climate model data to simulate historical and future river flows in Northwest England. Climatic Change, 80, 337367.
Fowler, H.J., Kilsby, C.G. and OConnell, P.E., 2003. Modelling the impacts of climatic change and variability on the reliability, resilience and vulnerability of a water resource system. Water Resour. Res.,39, doi.1029/2002WR001778.
Gibbins, C.N. and Acornely, R.M., 2000. Salmonid habitat modelling studies and their contribution to the development of an ecologically acceptable release policy for Kielder reservoir, north-east England. Regul. River.,16, 203224.
Gilvear, D.J., Heal, K.V. and Stephen, A., 2002. Hydrology and ecological quality of Scottish river ecosystems. Sci. Total Envir.,
294, 131159.
Hashimoto, T., Loucks, D.P. and Stedinger, J.R., 1982. Robustness of water resources systems. Water Resour. Res.,18, 2126. Healey, M., 2001. Bioenergetics, reproduction and fitness of
Pacific salmon in a changing global environment. Abstracts of the 44th
Conference on Great Lake Research, 5051.
Heggenes, J., 1990. Habitat utilisation and preferences in juvenile Atlantic salmon (Salmo salar) in streams. Regul. River.,5, 341 354.
Hendry, K. and Cragg-Hine, D., 1997. Restoration of riverine salmon habitats. Fisheries Technical Manual 4, Environment Agency, Bristol, UK.
Hendry, K and Cragg-Hine, D., 2003. Ecology of the Atlantic Salmon. Conserving Nature 2000 Rivers Ecology Series No. 7. English Nature, Peterborough, UK.
Hulme, M., Jenkins, G. J., Lu, X., Turnpenny, J. R., Mitchell, T.D., Jones, R.G., Lowe, J., Murphy, J.M., Hassell, D., Boorman, P., McDonald, R. and Hill, S., 2002. Climate Change Scenarios for the United Kingdom: The UKCIP02 Scientific Report. Tyndall Centre for Climate Change Research, School of Environmental Sciences, University of East Anglia, Norwich, UK.
Huntington, F.A., Aird, D., Joiner, P. and Thorpe, K.E., 1999. How juvenile Atlantic salmon, Salmo salar L., respond to falling water levels: experiments in an artificial stream. Fisheries Manage. Ecol.,6, 357364.
IPCC. 2000. Technical Summary. In: Special Report on Emissions Scenarios. N. Nakicenovic and B. Swart, (Eds.) Cambridge University Press, Cambridge.
Jensen, A.J., 2003. Atlantic salmon (Salmo salar) in the regulated River Alta: effects of altered water temperature on parr growth.
Riv. Res. Appl., 19, 733-747.?????
Kleme, V., 1986. Operational testing of hydrological simulation models. Hydrolog. Sci. J.,31, 1324.
Kondolf, G.M. and Wolman, M.G., 1993. The sizes of salmonid spawning gravels. Water Resour. Res.,29, 22752285. Lettenmaier, D.P., Wood, A.W., Plamer, R.N., Wood, E.F. and
Stakhiv, E.Z. (1999). Water resources implications of global warming: a US regional perspective. Climatic Change,43, 537579. Lunn, R.J., Adams, R., Mackay, R. and Dunn, S.M., 1996.
Development and application of a nitrogen modelling system for large catchments. J. Hydrol.,174, 285304.
McCarthy, A.D. and Houlihan, D.F., 1996. The effect of temperature on protein metabolism in fish: the possible consequences for wild Atlantic salmon (Salmo salar L.) stocks in Europe as a result of global warming. In: Global Warming: Implications for Freshwater and Marine Fish. C.M. Wood and D.G. McDonald, (Eds.) Society for Experimental Biology Seminar Series 61. Cambridge University Press, Cambridge, UK. 225253.
Meteorological Office 1981. The Meteorological Office Rainfall and Evaporation Calculation System. MORECS, Hydrological Moemorandum No. 45.
Milner, N.J., 1982. Habitat evaluation in salmonid streams. In:
Proc. 13th Annual Study Course. Institute of Fisheries Management, 4765.
Minns, C.K., Randall, R.G., Chadwick, E.M.P., Moore, J.E. and Green, R., 1995. Potential impacts of climate change on the habitat and population dynamics of juvenile Atlantic salmon (Salmo salar) in eastern Canada. Can. J. Fish. Aquat. Sci., 121, 699708.
Moir, H., Soulsby, C. and Youngson, A. 1998. Hydraulic and sedimentary characteristics of habitat utilised by Atlantic salmon for spawning in the Girnock Burn, Scotland. Fisheries Manage. Ecol.,5, 241254.
Moir, H., Soulsby, C. and Youngson, A. 2002. The hydraulic and sedimentary controls on the availability of Atlantic salmon spawning habitat in the river system NE Scotland.
Geomorphology,45, 291308.
Norton, S., 2003. Further attempts to aid Tyne salmon [online]. Accessed from: www.environmentagency.gov.uk/news/ 529238?lang=_e&theme=®ion=&subject=&searchfor=salmon+tyne. [Accessed 17th
December 2003].
Olden, J.D. and Poff, N.L., 2003. Redundancy and the choice of hydrologic indices for characterizing streamflow regimes. River Res. Appl., 19, 101121.
Parkin, G., ODonnell, G.M., Ewen, J., Bathurst, J.C., OConnell, P.E. and Lavabre, J., 1996. Validation of catchment models for predicting land-use and climate change impacts. 2: Case study for a Mediterranean catchment. J. Hydrol., 175, 595613. Pickering, A.D., Griffiths, R. and Pottinger, T.G., 1987. A
comparison of the effects of overhead cover on the growth, survival and haematology of juvenile Atlantic salmon, Salmo salar L., Brown trout, Salmo trutta L., and Rainbow trout, Salmo gairdneri. Aquaculrure,66, 109124.
Poff, N.L., 1996. A hydrogeography of unregulated streams in the United States and an examination of scale-dependence in some hydrological descriptors. Freshwater Biol., 36, 7191. Richter, B.D., Baumgartner, J.V., Wigington, R. and Braun, D.P.,
1996. A method for assessing hydrologic alteration within ecosystems. Conserv. Biol., 10, 11631174.
Richter, B.D., Baumgartner, J.V., Wigington, R. and Braun, D.P., 1997. How much water does a river need? Freshwater Biol.
37, 231249.
Solomon, D.J., Sambrook, H.T. and Broad, K.J., 1999. Salmon Migration and River Flow. Results of tracking radio tagged salmon in six rivers in South West England. Environment Agency R&D Publication 4, Bristol, UK.
Stanford, J.A., Ward, J.V., Liss, W.J., Frissell, C.A., Williams, R.N., Lichatowich, J.A. and Coutant, C.C., 1996. A general protocol for restoration of regulated rivers. Regul. River., 12, 391413.
Stewart, L., 1969. Criteria for safeguarding fisheries, fish migration and angling. In: Rivers Association of River Authorities Year Book 1970. Institution of Water Engineers at Loughborough University, 10th
and 11th
September 1969.
Walsh, C.L., 2004. Simulation and analysis of River flow regimes: implications for sustainable management of Atlantic salmon (Salmo salar ) under climate change. Unpublished PhD Thesis. School of Civil Engineering and Geosciences, University of Newcastle upon Tyne, UK.
Wicks, J.M. and Bathurst, J.C., 1996. SHESED: a physically based, distributed erosion and sediment yield component for the SHE hydrological modelling system. J. Hydrol.,175, 213238. Winfield, I.J., James, B.J. and Fletcher, J.M., 2004. A Review of
the Implications of Climate Change for Atlantic Salmon. Unpublished Report for University of Newcastle upon Tyne. Centre for Ecology and Hydrology, Windermere, Ambleside, UK.