HESSD
7, 1913–1944, 2010Projected impacts of climate change
D. G. Kingston and R. G. Taylor
Title Page
Abstract Introduction
Conclusions References
Tables Figures
◭ ◮
◭ ◮
Back Close
Full Screen / Esc
Printer-friendly Version
Interactive Discussion
Hydrol. Earth Syst. Sci. Discuss., 7, 1913–1944, 2010 www.hydrol-earth-syst-sci-discuss.net/7/1913/2010/ © Author(s) 2010. This work is distributed under the Creative Commons Attribution 3.0 License.
Hydrology and Earth System Sciences Discussions
This discussion paper is/has been under review for the journal Hydrology and Earth System Sciences (HESS). Please refer to the corresponding final paper in HESS if available.
Projected impacts of climate change on
groundwater and stormflow in a humid,
tropical catchment in the Ugandan Upper
Nile Basin
D. G. Kingston and R. G. Taylor
Department of Geography, University College London, Gower Street, London, WC1E 6BT, UK
Received: 28 February 2010 – Accepted: 10 March 2010 – Published: 17 March 2010 Correspondence to: D. G. Kingston ([email protected])
HESSD
7, 1913–1944, 2010Projected impacts of climate change
D. G. Kingston and R. G. Taylor
Title Page
Abstract Introduction
Conclusions References
Tables Figures
◭ ◮
◭ ◮
Back Close
Full Screen / Esc
Printer-friendly Version
Interactive Discussion
Abstract
The changing availability of freshwater resources is likely to be one of the most impor-tant consequences of projected 21st century climate change for both human and nat-ural systems. However, substantial uncertainty remains regarding the precise impacts of climate change on water resources, due in part to uncertainty in GCM projections
5
of climate change. Here we explore the potential impacts of climate change on water resources in a humid, tropical catchment (the River Mitano) in the Upper Nile Basin of Uganda. Uncertainty associated with GCM structure and climate sensitivity is explored, as well as from parameter specification within hydrological models. This is achieved by running pattern-scaled GCM output through a semi-distributed hydrological model
10
(developed using SWAT) of the catchment. Importantly, use of pattern-scaled GCM output allows investigation of specific thresholds of global climate change including the purported 2◦C threshold of “dangerous” climate change. In-depth analysis of results based on HadCM3 climate scenarios shows that annual river discharge first increases, then declines with rising global mean air temperature. A coincidental shift from a
bi-15
modal to unimodal discharge regime also results from a projected reduction in base-flow (groundwater discharge). Both of these changes occur after a 4◦C rise in global mean air temperature. These results are, however, highly GCM dependent in both the magnitude and direction of change. This dependence stems primarily from projected differences in GCM scenario precipitation rather than temperature. GCM-related
uncer-20
tainty is far greater than that associated with climate sensitivity or hydrological model parameterisation.
1 Introduction
Changing availability of freshwater resources is likely to be one of the most important consequences of projected 21st century climate change, critically affecting the
poten-25
HESSD
7, 1913–1944, 2010Projected impacts of climate change
D. G. Kingston and R. G. Taylor
Title Page
Abstract Introduction
Conclusions References
Tables Figures
◭ ◮
◭ ◮
Back Close
Full Screen / Esc
Printer-friendly Version
Interactive Discussion
et al., 2010). Historical (20th century) periods of wetter and drier conditions in the Up-per Nile region have demonstrated the vulnerability of human and natural systems to changes in the availability of freshwater resources (Tate et al., 2004; Conway, 2005). Projections of 21st century climate suggest an overall intensification of the global hy-drological cycle, with substantial changes expected to result in the hydrology of the
5
Upper Nile region (Sene et al., 2001; Arnell, 2003; Tate et al., 2004).
Throughout the Upper Nile Basin, river discharge sustains surface water levels upon which there is substantial dependence for fisheries (e.g. Nile Perch and Tilapia) and hydro-electric power generation (Bugenyi, 2001; Mwanja, 2004). Domestic water sup-plies depend primarily upon dispersed groundwater abstraction and spring discharges.
10
Piped water supplies drawing from Lake Victoria, the world’s second largest lake in area, are restricted to cities such as Kampala, Kisumu and Jinja. Similar to most of sub-Saharan Africa, almost all arable land is presently rainfall-fed (Giordano, 2006; Fischer et al., 2007); irrigation is restricted to commercial agriculture (e.g. fresh-cut flowers) primarily for export. Substantial increases in demand for freshwater are projected as
15
a result of population growth not only for domestic purposes but also to increase food production through expansion of irrigation (Taylor et al., 2004, 2009; Carter and Parker, 2009).
Given the magnitude of projected climate changes and the role of water in the socio-economic development of the Upper Nile Basin, there is a clear need for improved
20
understanding of the potential impacts of these changes on the availability of fresh-water resources. However, many existing assessments of fresh-water resources (past and projected) do not directly consider soil water (i.e. water transpired by plants) or ground-water, focusing instead on mean annual river flow (e.g. Kamga 2001; Legesse et al., 2003; Messager et al., 2006; Wit and Stankiewicz, 2006; Elshamy et al., 2009). This
fo-25
HESSD
7, 1913–1944, 2010Projected impacts of climate change
D. G. Kingston and R. G. Taylor
Title Page
Abstract Introduction
Conclusions References
Tables Figures
◭ ◮
◭ ◮
Back Close
Full Screen / Esc
Printer-friendly Version
Interactive Discussion
available ephemerally in channels as stormflow (i.e. runoff) and that which is more evenly distributed in time and space as groundwater. As such, a quantitative under-standing of the impacts of climate change on both catchment stores (i.e. soil water, groundwater) and flows (i.e. river discharge) is of critical importance to the development of effective strategies for management and adaptation to climate change (Mileham et
5
al., 2009; Nyenje and Batelaan, 2009; Taylor, 2009).
This paper addresses an urgent need for improved understanding of projected cli-mate change impacts on water resources in the Upper Nile Basin, and the uncertainty associated with such projections of hydrological change. This analysis is achieved through hydrological modelling of the River Mitano, a catchment in southwestern
10
Uganda that drains into Lake Edward. The catchment features one of the longest con-tinuous records of river discharge in Uganda. We resolve both surface and sub-surface contributions to river discharge. Following calibration, the hydrological model is forced with a range of climate change scenarios, designed to allow investigation of uncertainty between different GCMs and climate sensitivities. This represents an advancement of
15
previous research into climate change impacts on surface and sub-surface hydrology in the Mitano River Basin (Mileham et al., 2009), which did not consider uncertainty between different GCMs or climate sensitivities. Furthermore, the scenarios explored herein permit direct investigation of the impacts of specific (and policy relevant) thresh-olds of climate change on water resources including the hypothesised 2◦C threshold
20
for “dangerous” climate change.
2 Study catchment
The River Mitano catchment is located just south of the equator in southwestern Uganda (Fig. 1), and is the primary contributor to the larger Ntungwe Basin. The main river channel is well incised along the catchment’s western border and flows from an
25
HESSD
7, 1913–1944, 2010Projected impacts of climate change
D. G. Kingston and R. G. Taylor
Title Page
Abstract Introduction
Conclusions References
Tables Figures
◭ ◮
◭ ◮
Back Close
Full Screen / Esc
Printer-friendly Version
Interactive Discussion
Lake Edward (and run by the Ugandan Directorate of Water Resources Management), represents a catchment area of 2098 km2. The water balance of Lake Edward is un-certain, but the Mitano is thought to account for approximately 10% of river flow input to the lake using values from Hurst (1927), Viner and Smith (1973) and Lehman (2002), as cited in Russell and Johnson (2006). Westward flowing tributaries in eastern and
5
northeastern parts of the catchment drain areas of considerably lower relief that rep-resent the eastern boundary of drainage induced by the downfaulting of the western arm of the East African Rift System during the Mid-Pleistocene (Taylor and Howard, 1998). Incised valleys characterise a runoff dominated regime whereas areas of low relief promote infiltration and give rise to substantial baseflow (Taylor and Howard,
10
1999). Mean annual precipitation for the period 1965–1979 ranges from 963 mm at Rwaishmaire (30.13◦E, 0.83◦S) in the east of the Mitano Basin to 1699 mm at Sabiano (29.63◦E, 1.38◦S) in the south. Similar to the rest of the Upper Nile Basin, monthly precipitation follows a bimodal regime with dominant modes occurring from March to May and September to November; these are known as “short rains” and “long rains”,
15
respectively (Basalirwa, 1995).
Land use in the River Mitano catchment is primarily agrarian (79%). Agriculture takes place principally on small land holdings, with the most common crops compris-ing banana (matoke), tea, millet, cassava, sugarcane, and groundnuts. As rain falls during every month of the year within the inner tropics, crops are entirely rainfall-fed.
20
Grasslands dominate the remainder of the catchment (17%), with small areas of forest plantations and wetlands also present. Domestic water supplies in rural areas derive invariably from groundwater via handpumped wells and protected springs. Discrete aquifers occur within deeply weathered Precambrian crystalline rocks including gneiss, schist and phyllites of the Bugando-Toro Formation. The town of Rukungiri (population
25
HESSD
7, 1913–1944, 2010Projected impacts of climate change
D. G. Kingston and R. G. Taylor
Title Page
Abstract Introduction
Conclusions References
Tables Figures
◭ ◮
◭ ◮
Back Close
Full Screen / Esc
Printer-friendly Version
Interactive Discussion
3 Data and methods
Baseline meteorological data for the hydrological model of the Mitano River Basin com-prise monthly minimum and maximum temperature, precipitation totals and wet days obtained from the CRU TS 3.0 data set (Mitchell and Jones, 2005). With a gauged catchment area of 2098 km2, the Mitano occupies part of four 0.5◦grid cells from this
5
global climate data set. Monthly data for these grid cells were disaggregated to daily resolution, following procedures outlined in Todd et al. (2010). Station-based daily pre-cipitation data that provide the basis for the coefficient of variation used to generate daily data were obtained from five gauging stations within the River Mitano catchment (operated by the Ugandan Meteorology Department). Station-based daily temperature
10
data (for setting the standard deviation of the generated daily data) were obtained from a weather station in the town of Mbarara approximately 50 km east of the catchment. The Hargreaves method of estimating potential evapotranspiration was applied instead of more data intensive methods such as Penman Monteith and Priestley-Taylor.
Future climate scenarios for temperature and precipitation were generated using the
15
ClimGen pattern-scaling technique described in Todd et al. (2010). Scenarios were generated for a prescribed warming of global mean temperature of 0.5, 1, 1.5, 2, 2.5, 3, 4, 5, and 6◦C using the UKMO HadCM3 GCM, and for 2◦C warming with six additional GCMs: CCCMA CGCM31, CSIRO Mk30, IPSL CM4, MPI ECHAM5, NCAR CCSM30, and UKMO HadGEM1.
20
The hydrological model used to investigate climate change impacts in the River Mi-tano catchment was developed using the Soil and Water Assessment Tool (SWAT, Arnold et al., 1998). This is a physically based, semi-distributed hydrological model that operates on a daily time step. Different versions of SWAT have been widely used throughout the world for agricultural and water resources applications (Gassman et al.,
25
HESSD
7, 1913–1944, 2010Projected impacts of climate change
D. G. Kingston and R. G. Taylor
Title Page
Abstract Introduction
Conclusions References
Tables Figures
◭ ◮
◭ ◮
Back Close
Full Screen / Esc
Printer-friendly Version
Interactive Discussion
catchment. A further 15 years of data (1991–2005) were used to validate the model. Catchment topography was determined from the Shuttle Radar Topography Mission (SRTM) 3 arc second dataset (Farr et al., 2007). Land-cover data were derived from the Africover dataset generated by the Food and Agriculture Organisation of the United Na-tions (FAO) (available online at http://www.africover.org/index.htm, accessed 29
Jan-5
uary 2010). Land-use classifications from this dataset were matched with appropriate land cover groupings within the SWAT internal database. The FAO soil map of the world (FAO, 1990) was used as the basis for soil parameters within the hydrological model.
4 Hydrological model calibration and validation
10
The SWAT hydrological model was run at a daily time step, but model calibration (and subsequent analyses) were undertaken on a monthly basis as daily data derive from a weather generator (discussed in Todd et al., 2010). Initial model runs, following basic adjustment of model parameters, resulted in reasonable agreement between monthly observed and simulated discharge. However, the resultant Nash-Sutcliffe efficiency
15
was−0.09 indicating that the model was slightly less useful than the observed long-term monthly mean discharge as a basis for prediction. This reflects the occasionally very poor month-to-month performance of the model, with substantial monthly flow events either missing or erroneously introduced in the modelled time series. Even in the context of possible errors in the observed discharge data of ±15% (Mileham et
20
al., 2008), errors are large and contrast strongly with the good agreement between observed and simulated monthly means and flow duration curves.
Autocalibration routines were employed with the aim of improving the agreement between the model and observations. AVSWAT-X 2005 includes the ParaSol autocali-bration routine (van Griensven and Meixner, 2007) or, alternatively, can be coupled to
25
HESSD
7, 1913–1944, 2010Projected impacts of climate change
D. G. Kingston and R. G. Taylor
Title Page
Abstract Introduction
Conclusions References
Tables Figures
◭ ◮
◭ ◮
Back Close
Full Screen / Esc
Printer-friendly Version
Interactive Discussion
using either the SUFI-2, ParaSol or GLUE routines (Abbaspour et al., 2007). None of these routines resulted in satisfactory improvement of the hydrological model. It is thought that this is because there are some model-observation divergences within the 1961–1990 calibration period that are simply too large to be resolved by an autocali-bration routine.
5
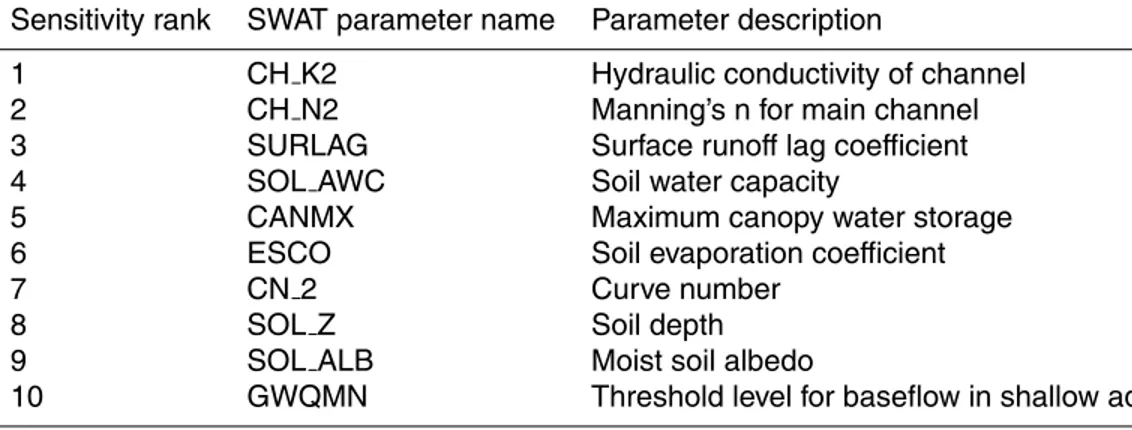
Following the unsuccessful application of autocalibration routines, a more exten-sive manual calibration was undertaken. This calibration was undertaken by man-ually varying the ten most sensitive parameters in the hydrological model (Table 1). These parameters were identified using the automated sensitivity analysis procedure within SWAT (which is based on a combination of a Latin Hypercube and
one-factor-10
at-a-time sampling strategy: van Griensven et al., 2006). This resulted in improved agreement between observed and simulated monthly river flow (Fig. 2a and b). Fur-thermore, comparison of results from a simple baseflow separation procedure (Arnold et al., 1995) of modelled and observed discharge reveals an approximately similar ra-tio between baseflow and quickflow in both series (with a modelled baseflow fracra-tion
15
of 58% and observed of 65%). Although the absolute numbers are different, these derived baseflow fractions are similar to previously defined graphical baseflow sepa-ration of observed and modelled Mitano discharge (modelled baseflow fraction: 43%, observed: 50%; Mileham et al., 2008). Despite these improvements, occasional poor month-to-month sequencing remains (Fig. 2c), as reflected in the low (albeit slightly
20
higher) Nash-Sutcliffe coefficient of 0.06 for the period 1961–1990. For similar reasons to those discussed above, renewed application of autocalibration routines was again unsuccessful.
Further investigation was undertaken to determine the cause of the variable model performance, specifically with respect to the input data used. Observed (station-based)
25
HESSD
7, 1913–1944, 2010Projected impacts of climate change
D. G. Kingston and R. G. Taylor
Title Page
Abstract Introduction
Conclusions References
Tables Figures
◭ ◮
◭ ◮
Back Close
Full Screen / Esc
Printer-friendly Version
Interactive Discussion
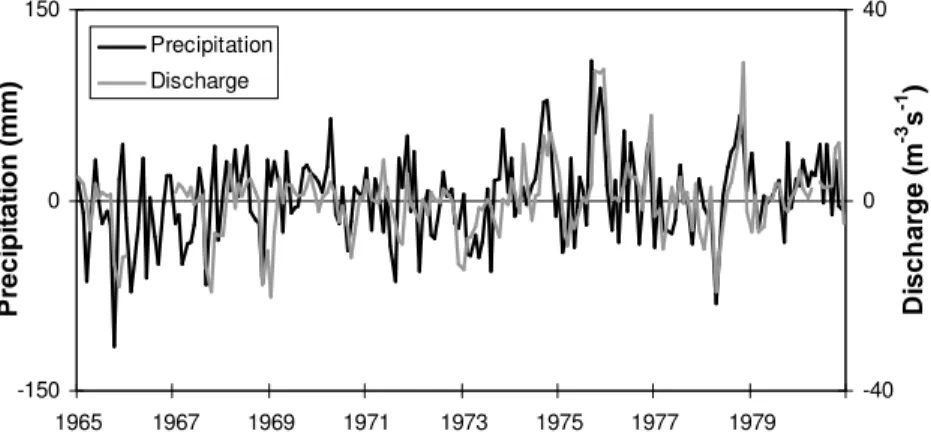
compared to the CRU TS 3.0 data used to drive the hydrological model. Differences between the mean station-based rainfall and the mean CRU TS 3.0 rainfall across the four Mitano grid cells correspond well with the differences between observed and mod-elled river flow (correlation coefficient 0.47; Fig. 3), particularly given consideration of the approximate 2 week lag time between precipitation occurrence and river discharge
5
(Mileham et al., 2008). This correspondence provides an explanation for the strong agreement between mean monthly observed and modelled river discharge but occa-sional poor month-to-month sequencing. This is because it could be expected that rainfall at a location 35 km away would have a similar overall climatology to the Mitano River Basin, but that there would be some difference in month-to-month rainfall totals,
10
due to the high spatio-temporal variation in the occurrence of precipitation events. The role of the disaggregation of monthly data to a daily time-step was also in-vestigated by running the disaggregation procedure multiple times to determine the sensitivity of the hydrological model to the random sequencing of rainfall events within each month. Results suggested that the model is not sensitive to this sequencing, with
15
similar performance of model month-to-month and 30-year monthly mean river flow. The correspondence between observed and simulated discharge over the 1991– 2005 validation period is similar to that of the 1961–1990 calibration period (Fig. 2c). The fifteen-year mean monthly modelled runoff agrees relatively well with observed values though performance is slightly poorer than that of the calibration period with
20
an underestimation of river discharge during the September–November second rainy season. This may be due to the closest rainfall station to the Mitano River Basin in the CRU TS 3.0 data set becoming unavailable from 1996 onwards, with the new nearest available rainfall station approximately 115 km from the basin. Similar issues of poor month-to-month sequencing again occur in the validation period, although the
Nash-25
Sutcliffe value of 0.13 is slightly higher than that of the calibration period.
HESSD
7, 1913–1944, 2010Projected impacts of climate change
D. G. Kingston and R. G. Taylor
Title Page
Abstract Introduction
Conclusions References
Tables Figures
◭ ◮
◭ ◮
Back Close
Full Screen / Esc
Printer-friendly Version
Interactive Discussion
being run with gridded rainfall data of questionable accuracy over the Mitano Basin. The climate change scenario runs will be evaluated within this context.
5 Simulation of climate change scenarios
5.1 Prescribed warming on HadCM3
Prescribed change climate scenarios for the River Mitano catchment show that
temper-5
ature increases at a near-linear rate between scenarios, with a 6◦C rise in global mean temperature resulting in increases of between 7 and 9.6◦C in monthly temperature over the catchment. The largest increases occur from May to July (8.6 to 9.6◦C increase for the 6◦C scenario), whereas the smallest take place from September to December (7.2◦C increase for the 6◦C scenario). Precipitation also changes at a near-linear rate,
10
with annual increases of 2.1 and 6.7% from the baseline for the 2 to 6◦C scenarios. At a monthly resolution, however, both increasing and decreasing linear trends occur, most of which are within±9% of the baseline for the 6◦C scenario: greater changes occur in March (+13%), May (−46%), June (+19%), July (+54%) and August (+25%). These trends in monthly precipitation totals are mirrored by those in the number of wet
15
days per month.
The impacts of prescribed increases in global mean temperature on the hydrolog-ical regime of the River Mitano comprise increases in mean annual river discharge up to the 3◦C scenario, followed by decreases (to a level lower than the baseline) for rises in global mean air temperature of 4 to 6◦C. Substantial changes in
intra-20
annual river discharge are associated with the non-linear response in annual river dis-charge to increasing global mean air temperature (Fig. 4). For the 0.5–3◦C scenarios, small decreases in river discharge are projected during the first wet season (March– May) whereas large increases in discharge are projected during the second wet sea-son (October–December). From 0.5–2◦C, these seasonal changes in discharge have
25
HESSD
7, 1913–1944, 2010Projected impacts of climate change
D. G. Kingston and R. G. Taylor
Title Page
Abstract Introduction
Conclusions References
Tables Figures
◭ ◮
◭ ◮
Back Close
Full Screen / Esc
Printer-friendly Version
Interactive Discussion
but for the 2.5 and 3◦C scenarios, increases in annual river discharge are >8% from baseline. For the 4–6◦C scenarios, projected decreases in March–May river discharge are more substantial, eliminating the March–May seasonal peak so that the River Mi-tano flow regime shifts from bimodal to unimodal. This shift is associated with projected decreases in annual river discharge of>12% from baseline for the 6◦C scenario.
5
The SWAT model divides contributions to river flow into three categories: surface (i.e. overland) flow, lateral flow (i.e. quickflow within the upper soil profile), and ground-water flow (i.e. return flow from shallow aquifers). For the Mitano, surface flow is rel-atively unimportant, contributing approximately 1% of total annual river flow for the baseline period, compared to 38% and 61% for lateral and groundwater flows,
respec-10
tively. Although surface flow remains unimportant on a monthly basis (i.e.<5% of the total), the relative importance of lateral and groundwater flow varies, with a 55:45 ratio during the first wet season, a 20:80 ratio during the June–July dry season, and a 45:55 ratio during the second wet season (Fig. 5). Whilst annual contributions vary by only small amounts with increasing global mean temperature (for the 6◦C scenario lateral
15
flow increases to 41% whilst groundwater flow decreases to 54%), changes in monthly contributions are more marked (Fig. 5). Changes in monthly contributions occur pri-marily in the first half of the year (February–July), with the groundwater component of river flow progressively decreasing with increasing global mean temperature. Although the absolute magnitude of lateral flows at this time of year remain similar, reductions in
20
the groundwater component increase the importance of lateral flow to the extent that it comprises between 70–85% of total runoffin March–May under the 6◦C scenario. As such, these results suggest that decreasing groundwater flow is the primary cause of reduced early season river flow in the 4–6◦C scenarios.
Analysis of the relative importance of changing precipitation versus temperature (and
25
HESSD
7, 1913–1944, 2010Projected impacts of climate change
D. G. Kingston and R. G. Taylor
Title Page
Abstract Introduction
Conclusions References
Tables Figures
◭ ◮
◭ ◮
Back Close
Full Screen / Esc
Printer-friendly Version
Interactive Discussion
evapotranspiration. This finding is in contrast to the increases in late-season river flow, which are primarily linked to rising precipitation. Combined with the changing lateral flow and groundwater contributions to river flow, these results suggest that increasing evapotranspiration (rather than reduced precipitation) limits the amount of water pen-etrating the soil profile and replenishing the shallow groundwater store during the first
5
wet season. This change leads to the reduced contribution of groundwater to river flow and the overall decrease in discharge.
5.2 2◦C warming across 7 GCMs
The 2◦C prescribed warming scenarios from seven different GCMs project contrasting changes in climate over the River Mitano catchment. Although all GCMs show a rise
10
in temperature of close to 2◦C in all months, the rise in air temperature on an annual basis ranges from approximately 1.8◦C for the NCAR GCM to 2.7◦C for the MPI GCM (Fig. 7a). This apparent contradiction can be explained by the fact that each GCM has a different pattern of global temperature change, meaning that while the global average temperature change is the same between GCMs, regional patterns are not. Differences
15
between GCMs are even more apparent for precipitation. Projected change in mean annual precipitation varies from a 23% increase (NCAR) to a 23% decrease (CSIRO). On a monthly basis, some GCMs project lower or greater precipitation in all months whereas others project a mixture of increasing and decreasing precipitation over the course of the year (Fig. 7b).
20
The results from the 2◦C scenarios show substantial disparities between GCMs, with little consistency in either magnitude or direction of change, for either seasonal or an-nual discharge (Fig. 8). For example, the CSIRO GCM projections result in reductions in river discharge at 2◦C that are greater than those from the HadCM3 GCM at 6◦C. In contrast, the NCAR GCM projections result in increased river discharge in all months
25
HESSD
7, 1913–1944, 2010Projected impacts of climate change
D. G. Kingston and R. G. Taylor
Title Page
Abstract Introduction
Conclusions References
Tables Figures
◭ ◮
◭ ◮
Back Close
Full Screen / Esc
Printer-friendly Version
Interactive Discussion
the greatest increase and decrease, respectively, in river discharge (although it is not possible to label these two GCMs as outliers, because the seven GCMs used here are drawn from a larger population of 23 CMIP-3 GCMs).
Resolution of the climate change signal for each of the GCMs derived from changing temperature and precipitation independently reveals consistency in the 2◦C
tempera-5
ture signal between GCMs (Fig. 9a). This signal results in a slight decrease in March– May river discharge. It is clear from the precipitation-only climate change signal that changes in precipitation are the dominant driver of changing river flow for the 2◦C sce-nario (Fig. 9b). It is also clear that differences in the precipitation climate change signal between GCMs are far greater than those in the temperature climate change signal,
10
with different GCMs giving rise to both positive and negative changes in discharge in all months.
5.3 Parameterisation uncertainty
In the absence of quantitative estimates of uncertainty in model parameterisation from an autocalibration routine, a manual assessment was undertaken to provide an
indica-15
tion of model parameterisation uncertainty. This analysis was undertaken by manually varying the ten most sensitive parameters in the hydrological model (Table 1). Each parameter was varied by a small amount (±10%) and the model re-run with baseline climate data. The model was then run using the same perturbed parameter set with scenario climate data: the HadCM3 2◦C prescribed warming was used as an
exem-20
plar scenario. The difference between the reference and perturbed runs was then compared between baseline and scenario situations. If the difference between the ref-erence and perturbed runs was greater for the scenario than the baseline, the model parameterisation was considered as a possible cause for additional uncertainty in cli-mate change projections (and vice versa).
25
HESSD
7, 1913–1944, 2010Projected impacts of climate change
D. G. Kingston and R. G. Taylor
Title Page
Abstract Introduction
Conclusions References
Tables Figures
◭ ◮
◭ ◮
Back Close
Full Screen / Esc
Printer-friendly Version
Interactive Discussion
reference-perturbed percent anomaly between baseline and scenario runs are below 5%, with the most sensitive parameters relating to evapotranspiration and soil water capacity.
6 Discussion
In this paper we assess the projected impacts of climate change on river discharge and
5
contributions to flow (runoff, baseflow) in a humid tropical catchment in the Upper Nile Basin. Importantly, this assessment includes evaluation of the range of uncertainty in this assessment due to climate sensitivity, choice of GCM, and hydrological model pa-rameterisation. The primary outcome of these results is the overwhelming dependence upon the GCM used for climate change projections, in agreement with the findings of
10
previous studies (e.g. Chiew et al., 2009; Prudhomme and Davies, 2009). Further-more, we show that single-GCM evaluations of climate change impacts are likely to be wholly inadequate and potentially misleading as a basis for the analysis of climate change impacts on freshwater resources.
Despite the substantial uncertainty associated with choice of GCM, a number of
addi-15
tional important issues are highlighted by our results from the River Mitano catchment. For example, river discharge, at least on an annual basis, may not respond linearly to increases in global mean air temperature (i.e. a combination of linear changes in monthly river flow can give rise to a non-linear annual response). This finding empha-sises two key issues: firstly, the potential for thresholds of climate change associated
20
with impacts on water resources (i.e. 3◦C here), and secondly, the importance of in-vestigating changing water resources on an intra-annual basis.
A further important finding is that whilst there is great uncertainty in the precipitation climate change signal between GCMs, the temperature signal is very consistent. As such, high confidence can be placed in the projections of increased evapotranspiration
25
HESSD
7, 1913–1944, 2010Projected impacts of climate change
D. G. Kingston and R. G. Taylor
Title Page
Abstract Introduction
Conclusions References
Tables Figures
◭ ◮
◭ ◮
Back Close
Full Screen / Esc
Printer-friendly Version
Interactive Discussion
simulating different warming scenarios using HadCM3 demonstrate the implications that increased evapotranspiration can have for the groundwater contribution to river discharge. Confidence can therefore be placed in the assertion that irrespective of the magnitude or direction of future changes in precipitation, the proportion of precipitation that contributes to Mitano river discharge via groundwater flow will decrease as a result
5
of increasing temperature. Furthermore, such a change would likely result in an altered seasonal distribution of river flow, affecting local and regional groundwater resources, and consequently agricultural and domestic water availability.
The projected changes in groundwater contributions to river flow and subsequent shift in annual regime (under HadCM3 scenarios) demonstrate the importance of
un-10
derstanding the interaction between changing temperature (and thus evapotranspira-tion) and precipitation for river flow in areas where there is a seasonal switch between P-PET deficit and surplus. Our ability to understand this balance is, however, con-strained by the substantial uncertainty regarding estimation of both baseline and sce-nario PET. Although the relative advantages and disadvantages of many different
meth-15
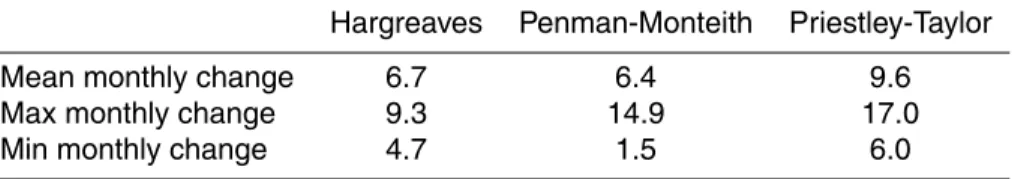
ods of estimating historical PET from meteorological data have been widely considered (e.g. Vorosmarty et al., 1998; Lu et al., 2005), relatively little attention has been given to how representative different PET methods remain when transferred from baseline to scenario climatology. Indeed, recent work (Kingston et al., 2009) shows that diff er-ent methods of estimating PET can produce markedly different climate change signals.
20
This tendency can be demonstrated for the Mitano Basin by a brief comparison of baseline: scenario PET ratios for the commonly used Hargreaves, Penman-Monteith and Priestley-Taylor methods of calculating PET (Table 2). Substantial differences are found in the PET climate change signal between the three methods, with this difference (for the HadCM3 2◦C scenario) most apparent during May, where the increase in PET
25
ranges from 9–17% between methods.
HESSD
7, 1913–1944, 2010Projected impacts of climate change
D. G. Kingston and R. G. Taylor
Title Page
Abstract Introduction
Conclusions References
Tables Figures
◭ ◮
◭ ◮
Back Close
Full Screen / Esc
Printer-friendly Version
Interactive Discussion
with choice of GCM, climate sensitivity, and PET algorithm. Despite this, it should be noted that only a limited and subjective assessment of model parameter uncertainty has been conducted, so these findings should be taken as indicative rather than defini-tive. Future work will aim to treat model uncertainty in a more objective and probabilistic manner by using, for example, autocalibration routines.
5
7 Conclusions
Investigation of uncertainty in future river discharge of the River Mitano Basin based on results from different GCMs, climate sensitivities and hydrological model parameter specification reveals the overwhelming dependency of hydrological projections on the GCM used. This dependence stems primarily from projected differences in GCM
sce-10
nario precipitation rather than temperature. Within this overriding constraint, however, a number of interesting results have emerged. These include non-linear responses in annual discharge to increasing global temperature, the importance of the precipitation– evaporation balance for determining the direction of changes in river discharge, and subsequent impacts on groundwater contributions to river discharge.
15
The above findings represent an important basis for interpretation of previous cli-mate change-hydrology studies and for designing future studies of possible clicli-mate change impacts on river flow. However, the utility of the results with respect to fu-ture changes in Mitano river discharge remain limited by the large uncertainty between GCMs. This is a key research gap, given the likely changes to the groundwater regime
20
of the Mitano (and wider region), and the importance of groundwater as a hydrological resource. As such, there is an urgent requirement for research to develop from the cur-rent approach of equal probability ratings assigned within an ensemble of opportunity of GCMs. Alternative approaches include development of reliability ratings for GCMs, and more widespread generation of probabilistic climate change scenarios and GCM
25
HESSD
7, 1913–1944, 2010Projected impacts of climate change
D. G. Kingston and R. G. Taylor
Title Page
Abstract Introduction
Conclusions References
Tables Figures
◭ ◮
◭ ◮
Back Close
Full Screen / Esc
Printer-friendly Version
Interactive Discussion Acknowledgements. This work was supported by a grant from the UK Natural and
Environ-mental Research Council (NERC) under the Quantifying and Understanding the Earth System (QUEST) programme (Ref. NE/E001890/1).
References
Abbaspour, K. C., Yang, J., and Maximov, I.: Modelling hydrology and water quality in the
5
pre-ailpine/alpine Thur watershed using SWAT, J. Hydrol., 333, 413–430, 2007.
Arnell, N. W.: Effects of IPCC SRES* emissions scenarios on river runoff: a global perspective, Hydrol. Earth Syst. Sci., 7, 619–641, 2003,
http://www.hydrol-earth-syst-sci.net/7/619/2003/.
Arnold, J. G., Allen, P. M., Muttiah, R., and Bernhardt, G.: Automated Base Flow Separation
10
and Recession Techniques, Ground Water, 33, 1010—1018, 1995.
Arnold, J. G., Srinivasan, R., Muttiah, R., and Williams, J. R.: Large area hydrologic modelling and assessment, Part 1: model development, J. Am. Water Resour. As., 34, 73–89, 1998. Basalirwa, C. P. K.: Delineation of Uganda into climatological rainfall zones using the method
of principal component analysis, Int. J. Climatol., 15, 1161–1177, 1995.
15
Bugenyi, F. W. B.: Tropical freshwater ecotones: their formation, functions and use, Hydrobi-ologia, 458, 33–43, 2001.
Carter, R. C. and Parker, A.: Climate change, population trends and groundwater in Africa, Hydrolog. Sci. J., 54, 676–698, 2009.
Chiew, F. H. S., Teng, J., Vaze, J., Post, D. A., Perraud, J. M., Kirono, D. G. C., and
20
Viney, N. R.: Estimating climate change impact on runoff across southeast Australia: Method, results and implications of the modelling method, Water Resour. Res., 45, W10414, doi:1029/2008WR007338, 2009.
Conway, D.: From headwater tributaries to international river: Observing and adapting to cli-mate variability and change in the Nile basin, Global Environ. Chang., 15, 99–114, 2005.
25
Di Luzio, M., Srinivasan, R., Arnold, J. G., and Neitsch, S. L.: ArcView interface for SWAT User’s Manual, Texas Water Resources Institute, TWRI Report TR-193, 351 pp., 2002. Elshamy, M. E., Seierstad, I. A., and Sorteberg, A.: Impacts of climate change on Blue Nile
flows using bias-corrected GCM scenarios, Hydrol. Earth Syst. Sci., 13, 551–565, 2009, http://www.hydrol-earth-syst-sci.net/13/551/2009/.
HESSD
7, 1913–1944, 2010Projected impacts of climate change
D. G. Kingston and R. G. Taylor
Title Page
Abstract Introduction
Conclusions References
Tables Figures
◭ ◮
◭ ◮
Back Close
Full Screen / Esc
Printer-friendly Version
Interactive Discussion
Farr, T. G., Rosen, P. A., Caro, E., et al.: The shuttle radar topography mission, Rev. Geophys., 45, RG2004, doi:10.1029/2005RG000183, 2007.
Food and Agricultural Organisation of the United Nations (FAO): FAO-UNESCO Soil Map of the World: Revised Legend, World Soil Resources Report 60, FAO, Rome, Italy, 1990.
Fischer, G., Tubiello, F. N., van Velthuizen, H., and Wiberg, D.: Climate change impacts on
5
irrigation water requirements: effects of mitigation, 1980–2080, Technol. Forecast. Soc., 74, 1083–1107, 2007.
Gassman, P. W., Reyes, M. R., Green, C. H., and Arnold, J. G.: The soil and water assessment tool: Historical development, applications and future research directions, T. ASABE., 50, 1211–1250, 2007.
10
Giordano, M.: Agricultural groundwater use and rural livelihoods in sub-Saharan Africa: A first-cut assessment, Hydrogeol. J., 14, 310–318, 2006.
Kamga, F. M.: Impact of greenhouse gas induced climate change on the runoffof the upper Benue river (Cameroon), J. Hydrol., 252, 145–156, 2001.
Kingston, D. G., Todd, M. C., Taylor, R. T., and Thompson, J. R.: Uncertainty in the
15
potential evapotranspiration climate change signal, Geophys. Res. Lett., 36, L20403, doi:10.1029/2009GL040267, 2009.
Kundzewicz, Z. W., Mata, L. J., Arnell, N. W., D ¨oll, P., Jimenez, B., Miller, K., Oki, T., S¸ en, Z., and Shiklomanov, I.: The implications of projected climate change for freshwater resources and their management, Hydrolog. Sci. J., 53, 3–10, 2008.
20
Legesse, D., Vallet-Coulomb, C., and Gasse, F.: Hydrological response of a catchment to cli-mate and land use changes in tropical Africa: case study South Central Ethiopia, J. Hydrol., 275, 67–85, 2003.
Lu, J. B., Sun, G., McNulty, S .G., and Amataya, D. M.: A comparison of six potential evapotran-spiration methods for regional use in the southeastern United States, J. Am. Water Resour.
25
As., 41, 621–633, 2005.
Manning, L. J., Hall, J. W., Fowler, H. J., Kilsby, C. G., and Tebaldi, C.: Using probabilistic climate change information from a multimodel ensemble for water resources assessment, Water Resour. Res., 45, W11411, doi:1029/2007WR006674, 2009.
Messager, C., Gall ´ee, H., Brasseur, O., Cappelaere, B., Peugeot, C., S ´eguis, L., Vauclin, M.,
30
HESSD
7, 1913–1944, 2010Projected impacts of climate change
D. G. Kingston and R. G. Taylor
Title Page
Abstract Introduction
Conclusions References
Tables Figures
◭ ◮
◭ ◮
Back Close
Full Screen / Esc
Printer-friendly Version
Interactive Discussion
Mileham, L., Taylor, R. G., Thompson, J. R., Todd, M. C., and Tindimugaya, C.: Impact of rainfall distribution on the parameterisation of a soil-moisture balance model of groundwa-ter recharge in equatorial Africa, J. Hydrol., 359, 46–58, doi:10.1016/j.jhydrol.2008.06.007, 2008.
Mileham, L., Taylor, R. G., Todd, M. C., Tindimugaya, C., and Thompson, J. R.: The impact
5
of climate change on groundwater recharge and runoff in a humid, equatorial catchment: sensitivity of projections to rainfall intensity, Hydrolog. Sci. J., 54, 727–738, 2009.
Mitchell, T. D. and Jones, P. D.: An improved method of constructing a database of monthly climate observations and associated high-resolution grids, Int. J. Climatol., 25, 693–712, 2005.
10
Mwanja, W. W.: The role of satellite water bodies in the evolution and conservation of Lake Victoria Region fishes, Afr. J. Ecol. Suppl., 42(1), 14–20, 2004.
Nyenje, P. M. and Batelaan, O.: Estimating the effects of climate change on groundwater recharge and baseflow in the upper Ssezibwa catchment, Uganda, Hydrolog. Sci. J., 54(4), 713–726, 2009.
15
Prudhomme, C. and Davies, H.: Assessing uncertainties in climate change impact analyses on the river flow regimes in the UK. Part 2: future climate, Climatic Change, 93, 197–222, 2009.
Russell, J. M. and Johnson, T. C.: The water balance and stable isotope hydrology of Lake Edward, Uganda-Congo, J. Great Lakes Res., 32, 77–90, 2006.
20
Sene, K. J., Tate, E. L., and Farquharson, F. A. K.: Sensitivity of the impacts of climate change on White Nile flows, Climatic Change, 50, 177–208, 2001.
Tate, E., Sutcliffe, J., Conway, D., and Farquharson, F.: Water balance of Lake Victoria: update to 2000 and climate change modelling to 2100, Hydrolog. Sci. J., 49, 563–574, 2004. Taylor, R. G.: Rethinking water scarcity: role of storage. EOS, Trans. Am. Geophys. U., 90(28),
25
237–238, 2009.
Taylor, R. G., Barrett, M. H., and Tindimugaya, C.: Urban areas of sub-Saharan Africa: weath-ered crystalline aquifer systems, Urban Groundwater Pollution, 24, 155–179, 2004.
Taylor, R. G. and Howard, K. W. F.: Post-Palaeozoic evolution of weathered landsurfaces in Uganda by tectonically controlled weathering and stripping, Geomorphology, 25, 173–192,
30
1998.
HESSD
7, 1913–1944, 2010Projected impacts of climate change
D. G. Kingston and R. G. Taylor
Title Page
Abstract Introduction
Conclusions References
Tables Figures
◭ ◮
◭ ◮
Back Close
Full Screen / Esc
Printer-friendly Version
Interactive Discussion
Taylor, R. G., Koussis, A. D., and Tindimugaya, C.: Groundwater and climate in Africa – a review, Hydrolog. Sci. J., 54, 655–664, 2009.
Todd, M. C., Osborn, T., and Taylor, R. G.: Quantifying uncertainty in the impact of climate change on water resources at river basin and global scales – a unified approach, Hydrol. Earth Syst. Sci. Discuss., in preparation, 2010.
5
van Griensven, A., Meixner, T., Grunwald, S., Bishop, T., Diluzio, M., and Srinivasan, R.: A global sensitivity analysis tool for the parameters of multi-varible catchment models, J. Hy-drol., 324, 10–23, 2006.
van Griensven, A. and Meixner, T.: A global and efficient multi-objective auto-calibration and uncertainty estimation method for water quality catchment models, J. Hydroinform., 9, 277–
10
291, 2007.
V ¨or ¨osmarty, C. J., Federer, C. A., and Schloss, A. L.: Potential evaporation functions com-pared on US watersheds: Possible implications for global-scale water balance and terrestrial ecosystem modelling, J. Hydrol., 207, 147–169, 1998.
Wit, M. and Stankiewicz, J.: Changes in surface water across Africa with predicted climate
15
HESSD
7, 1913–1944, 2010Projected impacts of climate change
D. G. Kingston and R. G. Taylor
Title Page
Abstract Introduction
Conclusions References
Tables Figures
◭ ◮
◭ ◮
Back Close
Full Screen / Esc
Printer-friendly Version
Interactive Discussion
Table 1.The ten most sensitive parameters in the SWAT model of the Mitano River Basin.
Sensitivity rank SWAT parameter name Parameter description
1 CH K2 Hydraulic conductivity of channel 2 CH N2 Manning’s n for main channel 3 SURLAG Surface runofflag coefficient 4 SOL AWC Soil water capacity
5 CANMX Maximum canopy water storage 6 ESCO Soil evaporation coefficient 7 CN 2 Curve number
8 SOL Z Soil depth 9 SOL ALB Moist soil albedo
HESSD
7, 1913–1944, 2010Projected impacts of climate change
D. G. Kingston and R. G. Taylor
Title Page
Abstract Introduction
Conclusions References
Tables Figures
◭ ◮
◭ ◮
Back Close
Full Screen / Esc
Printer-friendly Version
Interactive Discussion
Table 2.Percent change in monthly PET from baseline to HadCM3 2◦C scenario.
Hargreaves Penman-Monteith Priestley-Taylor
HESSD
7, 1913–1944, 2010Projected impacts of climate change
D. G. Kingston and R. G. Taylor
Title Page
Abstract Introduction
Conclusions References
Tables Figures
◭ ◮
◭ ◮
Back Close
Full Screen / Esc
Printer-friendly Version
Interactive Discussion
HESSD
7, 1913–1944, 2010Projected impacts of climate change
D. G. Kingston and R. G. Taylor
Title Page Abstract Introduction Conclusions References Tables Figures ◭ ◮ ◭ ◮ Back Close
Full Screen / Esc
Printer-friendly Version Interactive Discussion 0 10 20 30
J F M A M J J A S O N D
D is c h a rg e ( m -3s
-1) Obs
Model a 0 20 40 60
0 50 100
% exceedence D is c h a rg e ( m -3s
-1) Obs
Model b 0 10 20 30 40 50 60 1 9 6 1 1 9 6 3 1 9 6 5 1 9 6 7 1 9 6 9 1 9 7 1 1 9 7 3 1 9 7 5 1 9 7 7 1 9 7 9 1 9 8 1 1 9 8 3 1 9 8 5 1 9 8 7 1 9 8 9 1 9 9 1 1 9 9 3 1 9 9 5 1 9 9 7 1 9 9 9 2 0 0 1 2 0 0 3 2 0 0 5 D is c h a rg e ( m -3 s -1 ) Model Obs c Validation period Calibration period
Fig. 2. Comparison of 1961–1990 modelled and observed (a) monthly mean flow; (b) flow
duration curve); and(c)1961–2005 month-to-month sequencing.
HESSD
7, 1913–1944, 2010Projected impacts of climate change
D. G. Kingston and R. G. Taylor
Title Page
Abstract Introduction
Conclusions References
Tables Figures
◭ ◮
◭ ◮
Back Close
Full Screen / Esc
Printer-friendly Version
Interactive Discussion -150
0 150
1965 1967 1969 1971 1973 1975 1977 1979
P
re
c
ip
it
a
ti
o
n
(
m
m
)
-40 0 40
D
is
c
h
a
rg
e
(
m
-3 s
-1 )
Precipitation Discharge
HESSD
7, 1913–1944, 2010Projected impacts of climate change
D. G. Kingston and R. G. Taylor
Title Page
Abstract Introduction
Conclusions References
Tables Figures
◭ ◮
◭ ◮
Back Close
Full Screen / Esc
Printer-friendly Version
Interactive Discussion
(a)
0 10 20 30
J F M A M J J A S O N D
D
is
c
h
a
rg
e
(
m
-3 s
-1 )
baseline 0.5 °C 1 °C 1.5 °C 2 °C 2.5 °C 3 °C 4 °C 5 °C 6 °C
(b)
-15 -10 -5 0 5 10
0.5 1 1.5 2 2.5 3 4 5 6
Change in global mean temperature (°C)
A
n
n
u
a
l
fl
o
w
a
n
o
m
al
y
(%
)
fr
o
m
b
a
se
li
n
e
HESSD
7, 1913–1944, 2010Projected impacts of climate change
D. G. Kingston and R. G. Taylor
Title Page
Abstract Introduction
Conclusions References
Tables Figures
◭ ◮
◭ ◮
Back Close
Full Screen / Esc
Printer-friendly Version
Interactive Discussion 0
20 40 60 80 100
1 2 3 4 5 6 7 8 9 10 11 12
G
ro
u
n
d
w
a
te
r
c
o
n
tr
ib
u
ti
o
n
t
o
r
iv
e
r
fl
o
w
(
%
)
baseline 2deg 4deg 6deg
Fig. 5. Groundwater flow contribution to Mitano discharge for HadCM3 prescribed warming
HESSD
7, 1913–1944, 2010Projected impacts of climate change
D. G. Kingston and R. G. Taylor
Title Page
Abstract Introduction
Conclusions References
Tables Figures
◭ ◮
◭ ◮
Back Close
Full Screen / Esc
Printer-friendly Version
Interactive Discussion
(a)
0 5 10 15 20 25
J F M A M J J A S O N D
D
is
c
h
a
rg
e
(
m
-3 s
-1 ) baseline
1 °C 2 °C 3 °C 4 °C 5 °C 6 °C
(b)
0 5 10 15 20 25
J F M A M J J A S O N D
D
is
c
h
a
rg
e
(
m
-3 s
-1 ) baseline
1 °C 2 °C 3 °C 4 °C 5 °C 6 °C
HESSD
7, 1913–1944, 2010Projected impacts of climate change
D. G. Kingston and R. G. Taylor
Title Page Abstract Introduction Conclusions References Tables Figures ◭ ◮ ◭ ◮ Back Close
Full Screen / Esc
Printer-friendly Version Interactive Discussion (a) 0 0.5 1 1.5 2 2.5 3 3.5
J F M A M J J A S O N D
C h a n g e i n t e m p e ra tu re f ro m b a s e li n e ( °C ) CCCMA CSIRO HadCM3 HadGEM1 IPSL MPI NCAR (b) -40 0 40 80
J F M A M J J A S O N D
C h a n g e in p re ci p ti at io n f ro m b as el in e (% ) CCCMA CSIRO HadCM3 HadGEM1 IPSL MPI NCAR
HESSD
7, 1913–1944, 2010Projected impacts of climate change
D. G. Kingston and R. G. Taylor
Title Page
Abstract Introduction
Conclusions References
Tables Figures
◭ ◮
◭ ◮
Back Close
Full Screen / Esc
Printer-friendly Version
Interactive Discussion
(a)
0 5 10 15 20 25 30 35
1 2 3 4 5 6 7 8 9 10 11 12
D
is
ch
ar
g
e
(
m
-3 s
-1 )
baseline CCCMA CSIRO HadCM3 HadGEM1
IPSL MPI NCAR
(b)
-40 0 40 80
HadCM3 CCCMA CSIRO IPSL NCAR MPI HadGEM
GCM
A
n
n
u
a
l
fl
o
w
a
n
o
m
a
ly
(
%
)
fr
o
m
b
a
s
e
li
n
e
Fig. 8. Climate change signal in(a)monthly and(b)annual discharge for the 2◦C prescribed
HESSD
7, 1913–1944, 2010Projected impacts of climate change
D. G. Kingston and R. G. Taylor
Title Page
Abstract Introduction
Conclusions References
Tables Figures
◭ ◮
◭ ◮
Back Close
Full Screen / Esc
Printer-friendly Version
Interactive Discussion
(a)
0 5 10 15 20 25
J F M A M J J A S O N D
D
is
c
h
a
rg
e
(
m
-3 s
-1 )
baseline CCCMA CSIRO
HadCM3 HadGEM1 IPSL
MPI NCAR
(b)
0 10 20 30 40
J F M A M J J A S O N D
D
is
c
h
a
rg
e
(
m
-3 s
-1 )
baseline
CCCMA CSIRO HadCM3 HadGEM1
IPSL MPI NCAR
Fig. 9. (a)Temperature and(b)precipitation only climate change signals for 2◦C prescribed
HESSD
7, 1913–1944, 2010Projected impacts of climate change
D. G. Kingston and R. G. Taylor
Title Page Abstract Introduction Conclusions References Tables Figures ◭ ◮ ◭ ◮ Back Close
Full Screen / Esc
Printer-friendly Version Interactive Discussion -4 -3 -2 -1 0 1 2 3 4 5 6
J F M A M J J A S O N D
D is p a ri ty ( % ) in s c e n a ri o -b a s e li n e d if fe re n c e b e tw e e n p e rt u rb e d v s re fe re n c e m o d e l ru n s
Fig. 10. Model parameter uncertainty for HadCM3 2◦C scenario: maximum extent of the