Comparative Transcriptome Analysis Reveals
Different Silk Yields of Two Silkworm Strains
Juan Li1, Sheng Qin1,2, Huanjun Yu1, Jing Zhang1, Na Liu1, Ye Yu1, Chengxiang Hou1,2, Muwang Li1,2*
1School of Biotechnology, Jiangsu University of Science and Technology, Zhenjiang Jiangsu 212018, China,2The Sericultural Research Institute, Chinese Academy of Agricultural Science, Zhenjiang Jiangsu 212018, China
Abstract
Cocoon and silk yields are the most important characteristics of sericulture. However, few studies have examined the genes that modulate these features. Further studies of these genes will be useful for improving the products of sericulture. JingSong (JS) and Lan10 (L10) are two strains having significantly different cocoon and silk yields. In the current study, RNA-Seq and quantitative polymerase chain reaction (qPCR) were performed on both strains in order to determine divergence of the silk gland, which controls silk biosynthe-sis in silkworms. Compared with L10, JS had 1375 differentially expressed genes (DEGs; 738 up-regulated genes and 673 down-regulated genes). Nine enriched gene ontology (GO) terms were identified by GO enrichment analysis based on these DEGs. KEGG enrichment analysis results showed that the DEGs were enriched in three pathways, which were mainly associated with the processing and biosynthesis of proteins. The representa-tive genes in the enrichment pathways and ten significant DEGs were further verified by qPCR, the results of which were consistent with the RNA-Seq data. Our study has revealed differences in silk glands between the two silkworm strains and provides a perspective for understanding the molecular mechanisms determining silk yield.
Introduction
Bombyx moriwas domesticated from the wild silkworm (B.mandarina) and has been used in various economic applications for thousands of years. Indeed, silk produced by domestic silk-worms is widely used as a textile material in daily life [1,2]. However, little is known about the molecular mechanisms contributing to different silk yields in domestic silkworm strains [3].
Hundreds of silkworm strains are preserved at the Sericultural Research Institute, Chinese Academy of Agricultural Sciences, and hereditary and ecological divergence of various genes has been shown to be responsible for the quality of silk produced by silkworm in many strains. Jingsong (JS) and Lan10 (L10) are typical strains with high and low silk yields, respectively. The JS strain is widely used in various applications as a commercial strain and has silk proper-ties that are advantageous for silk yields. In contrast, L10 produces smaller cocoons and has
a11111
OPEN ACCESS
Citation:Li J, Qin S, Yu H, Zhang J, Liu N, Yu Y, et al. (2016) Comparative Transcriptome Analysis Reveals Different Silk Yields of Two Silkworm Strains. PLoS ONE 11(5): e0155329. doi:10.1371/journal. pone.0155329
Editor:J Joe Hull, USDA-ARS, UNITED STATES
Received:December 22, 2015
Accepted:April 27, 2016
Published:May 9, 2016
Copyright:© 2016 Li et al. This is an open access article distributed under the terms of theCreative Commons Attribution License, which permits unrestricted use, distribution, and reproduction in any medium, provided the original author and source are credited.
Data Availability Statement:All relevant data are within the paper and its Supporting Information files.
Funding:This project was supported by the National Natural Science Foundation of China (grant No. 31372375), the Natural Science Foundation of JiangSu Province (BK20131240) and the Project of the State Key Laboratory of Silkworm Genome Biology (sklsgb2013020).
poor silk-producing properties [4]. The silk yield of JS is about five-fold higher than that of L10. The silk yield is about 0.5 g per individual in Js, while that of L10 is about 0.1 g. Because cocoon and silk yields are determined by genetic quantitative traits, molecular marker tech-niques have been used widely in silkworms in order to identify many quantitative trait loci (QTLs) [5–7]; indeed, our laboratory has used such techniques to identify 14 QTLs [4]. Although technopositioning can be useful for finding the genetic loci of large fragments having relatively high location-dependent (LOD) values, RNA-Seq based transcriptome analysis may be more suitable for detecting minor genes [8,9].
The silk gland (SG), which is the primary organ responsible for silk yield, can be divided into three compartments: the anterior silk gland (ASG), middle silk gland (MSG), and poste-rior silk gland (PSG). The silk fibers are composed of two types of major silk proteins, fibroins and sericins, which are produced by the SGs. Fibroins and sericins are synthesized by the PSG and MSG, respectively [10]. Fibroins are composed of the fibroin heavy chain (fib-H), fibroin light chain (fib-L), and p25 proteins. The three proteins form a hexameric complex in a 6:6:1 ratio [11]. The mRNA levels of these genes and the corresponding fibroin protein accumulate in SGs during different developmental stages [12]. The lumen of the MSG contains more than seven major sericins and various uncharacterized minor proteins, which are encoded mainly bySer1,Ser2,Ser3,MSGS3,MSGS4, andMSG5[13–18]. However, no studies have examined the molecular mechanisms in SGs that contribute to different silk yields in domestic silkworms.
In this study, we used the SGs from third day fifth-instar larvae of the JS and L10 strains to examine the silk yield differences between the two strains by RNA-Seq. Our results will provide insights into the molecular mechanisms of silk production and lead to improved cocoon silk yield [19,20].
Methods
Sample preparation
L10 and JS strains, which have different rates of silk production, were chosen from the silk-worm resource library. The larvae were reared on live mulberry under a constant 14-h light/ 10-h dark photoperiod at 25 ± 1°C and 75% ± 3% relative humidity. Intact SGs were dissected and frozen in liquid nitrogen immediately for RNA-seq.
RNA extraction and library preparation
SG total RNAs were extracted using TRIzol reagent (Invitrogen, USA) following the manufac-turer's protocol. An Agilent 2100 Bioanalyzer was used to determine RNA quality. Contami-nating genomic DNA was removed from a 3μg total RNA aliquot by treatment with 10μg DNase I (Takara, Japan) for 30 min at 37°C. RNA was purified from the digest using Dyna-beads1
Oligo (dT) 25 (Life Tech, USA). Finally, 100 ng purified mRNA per sample were used to construct the respective cDNA libraries using an NEBNext1UltraTM RNA Library Prep Kit for Illumina (NEB, USA).
RNA sequencing (RNA-Seq) and quality control
were removed from the raw data. All of the downstream analyses were based on high-quality, clean sequences. The clean reads were directly mapped to the silkworm reference genome [23] using the Bowtie short read aligner [24].
Analysis of differentially expressed genes (DEGs)
The expression levels of genes were normalized using the reads per kb per million reads (RPKM) method [25]. The gene expression levels were compared between the two strains using DEGSeq [26].Pvalues were adjusted for multiple comparisons using the Benjamini and Hochberg method [27]. DEGs were filtered with the following thresholds: false-discovery rate (FDR)0.001 and |log2 Fold Change (Log2FC)|1.
Annotation and enrichment analysis for gene ontology (GO) and KEGG
analyses
All genes in the current transcriptome of the silkworm were annotated based on BLAST homology searches. The expressed genes were searched against the Swiss-Prot and TrEMBL databases by double-direction BLAST with an e-value of 1e-5or less. Orthologous genes were then annotated to GO terms and KEGG pathways using GOPipe [28] and the KEGG database [29]. To explore the function of DEGs between the two silkworm strains, GO and KEGG enrichment analyses were performed using hypergeometric tests. An FDR of 0.05 or less was set as the threshold for screening the significantly enriched GO and KEGG terms.
Validation by quantitative real-time reverse transcription polymerase
chain reaction (qRT-PCR)
To further validate the RNA-Seq results, SGs from three biological samples for each strain were dissected from 3-day-old fifth instar larvae and divided into three parts (ASG, MSG, and PSG). In addition to the SGs, the fat body, midgut and hemolymph were also dissected. RNAiso Plus (TaKaRa Dalian, China) was used to isolate total RNA according to the manufacturer’s instruc-tions. Gel electrophoresis and ultraviolet spectrophotometry were used to determine the integ-rity and puinteg-rity of the RNA. One microgram of total RNA from each sample was used to synthesize cDNA using a PrimeScript™RT reagent Kit with gDNA Eraser (Perfect Real Time, TaKaRa)—followed by storage at -20°C. Real-time quantitative PCR was carried out in a reac-tion volume of 20μL, containing 2μL of template, 10μL of 2× SYBR Premix EX Taq (TaKaRa), 0.4μL of 50× ROX Reference Dye (TaKaRa), and 0.4μL of specific primers (10μM). The PCR amplification efficiency (E) and R^2 of each primer pair was calculated from the slope of a standard curve, which was conducted according to MIQE (Minimum information for publica-tion of quantitative real-time PCR experiments) guidelines [30]. The qRT-PCR primer sequences, which were designed based on the consensus sequence of each alignment, and their efficiencies are provided inS1 Table. qRT-PCR was performed with an ABI7300 real-time PCR system, using the following conditions: 95°C for 5 min, followed by 40 cycles of 95°C for 5 s, 60°C for 31 s and dissociation.
The mRNA quantity of each gene was calculated with the 2-44Ctmethod [31] and normal-ized to the abundance of the house-keeping geneBmGAPDH(Accession No. XM_012690444) [32]. The relative mRNA levels of each gene are presented as fold changes relative to the expression level ofBmGAPDH.
Results
Overview of transcriptome sequencing data
Pooled total RNAs were isolated from 3-day-old fifth instar larval SGs corresponding to either the JS or L10 strain of silkworm. cDNA libraries were then constructed and sequenced using an Illumina HiSeq2500 platform. 22,704,312 and 21,167,022 raw reads were generated from the cDNA libraries. The quality of the RNA-Seq data is listed in theS2-1 Table. In total, 22,635,272 and 21,099,316 clean reads were filtered from the raw data. The clean data has been submitted to the NCBI SRA database with the accession numbers: SRR3190017 and
SRR3190036. These clean reads were mapped to reference genome sequences obtained from the Silkworm Genome Database (Silk DB;https://www.silkdb.org/silkdb/) using the Bowtie short read aligner [23,24]. A total of 14,772,549 (65.26%) clean reads were mapped to 10,849 genes in JS, and 13,787,558 (65.35%) clean reads were mapped to 11,218 genes in L10 (S2-2 Table). There were 10,097 commonly expressed genes between the two strains with ~ 47% and 56% of the genes covered by more than 90% of the clean reads in the JS and L10 strains, respec-tively (S1 Fig).
DEGs in SGs
The gene expression levels were compared between the two strains using DEGSeq [26]. Based on the thresholds for screening DEGs, 1411 genes were identified as DEGs in JS compared to L10; of these, 738 were up-regulated, and 673 were down-regulated in JS. All of the DEGs are listed inS3 Table.
KEGG and GO annotations and enrichment analyses
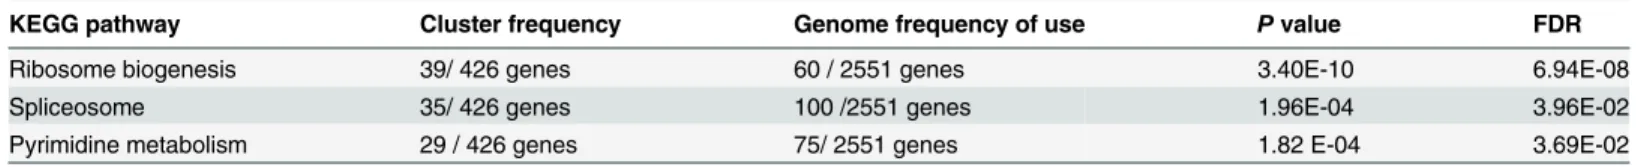
Based on homologous proteins identified in BLAST searches, 2551 genes were mapped to 32 pathways comprising the five main KEGG database categories (S2 Fig). KEGG pathway enrich-ment analysis was performed based on hypergeometric tests. The DEGs between the two silk-worm stains were significantly enriched in three pathways (Table 1), pyrimidine metabolism, ribosome biogenesis in eukaryotes and the spliceosome. These genes are mainly responsible for protein production. Compared with L10, more than 97% of DEGs in JS were significantly up-regulated in ribosome biogenesis in eukaryotes and the spliceosome (Fig 1). Additionally, ~72% of DEGs in JS were also significantly up-regulated compared with those in L10 in the pyrimidine metabolism pathway. These results suggested that the processing and biosynthesis of proteins were activated to a greater degree in JS than in L10. All DEGs in the enrichment pathways are listed inS4 Table.
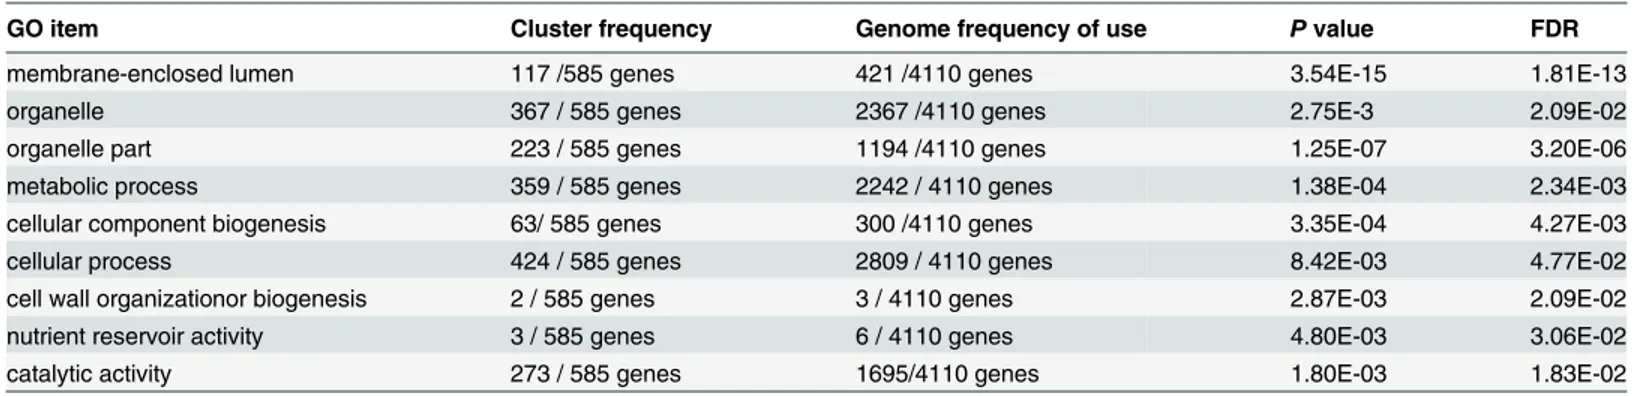
It is reasonable to hypothesize that silk fiber biosynthesis is dependent on the production of proteins in the SG. The results of GO enrichment analysis reflected the differences in the SG between the two strains. The GO terms for the DEGs were annotated using GOPipe [28], and
Table 1. KEGG enrichment of the DEGs between L10 and JS.
KEGG pathway Cluster frequency Genome frequency of use Pvalue FDR
Ribosome biogenesis 39/ 426 genes 60 / 2551 genes 3.40E-10 6.94E-08
Spliceosome 35/ 426 genes 100 /2551 genes 1.96E-04 3.96E-02
Pyrimidine metabolism 29 / 426 genes 75/ 2551 genes 1.82 E-04 3.69E-02
Cluster frequency is the number of DEG annotation terms relative to the ontology; genome frequency of use is the number of annotations to the reference genes of the term relative to the ontology.
the GO classification bar graph was drawn according to the GO IDs. From this analysis, 4110 genes were annotated with 51 GO terms across three main categories (S3 Fig). The DEGs between the two silkworm stains were significantly enriched in nine GO items (Table 2). The dominant GO term was membrane-enclosed lumen, belonging to the cellular component, which is consistent with results from the pathway enrichment analysis. One of the DEG enriched pathways was ribosome biogenesis. Ribosomes are mainly attached to the membrane-enclosed lumen, for example the endoplasmic reticulum. It indicated that the protein process
Fig 1. Volcano plot of DEGs in enrichment pathways.The pink points indicate genes in the pyrimidine metabolism pathway, green points indicate the genes in ribosome biogenesis in eukaryotes, and blue points indicate genes in the spliceosome pathway. The translucent points indicate genes for which the log2 fold change (Log2 FC) was less than 1 (and are therefore not differentially expressed).
doi:10.1371/journal.pone.0155329.g001
Table 2. Gene ontology enrichment of the DEGs between L10 and JS.
GO item Cluster frequency Genome frequency of use Pvalue FDR
membrane-enclosed lumen 117 /585 genes 421 /4110 genes 3.54E-15 1.81E-13
organelle 367 / 585 genes 2367 /4110 genes 2.75E-3 2.09E-02
organelle part 223 / 585 genes 1194 /4110 genes 1.25E-07 3.20E-06
metabolic process 359 / 585 genes 2242 / 4110 genes 1.38E-04 2.34E-03
cellular component biogenesis 63/ 585 genes 300 /4110 genes 3.35E-04 4.27E-03
cellular process 424 / 585 genes 2809 / 4110 genes 8.42E-03 4.77E-02
cell wall organizationor biogenesis 2 / 585 genes 3 / 4110 genes 2.87E-03 2.09E-02
nutrient reservoir activity 3 / 585 genes 6 / 4110 genes 4.80E-03 3.06E-02
catalytic activity 273 / 585 genes 1695/4110 genes 1.80E-03 1.83E-02
Cluster frequency is the number of DEG annotation terms relative to the ontology; genome frequency of use is the number of annotations to the reference genes of the term relative to the ontology.
had significant differences between the L10 and JS SGs. The DEGs were also enriched in some biological processes, including metabolic processes, cellular component biogenesis, cell wall organization or biogenesis, and cellular process. We observed significant differences in DEGs involved in molecular functions for nutrient reservoir activity and catalytic activity between the two strains. The results implied that most of the DEGs may play a positive role in protein biosynthesis.
Validation of DEGs by qRT-PCR
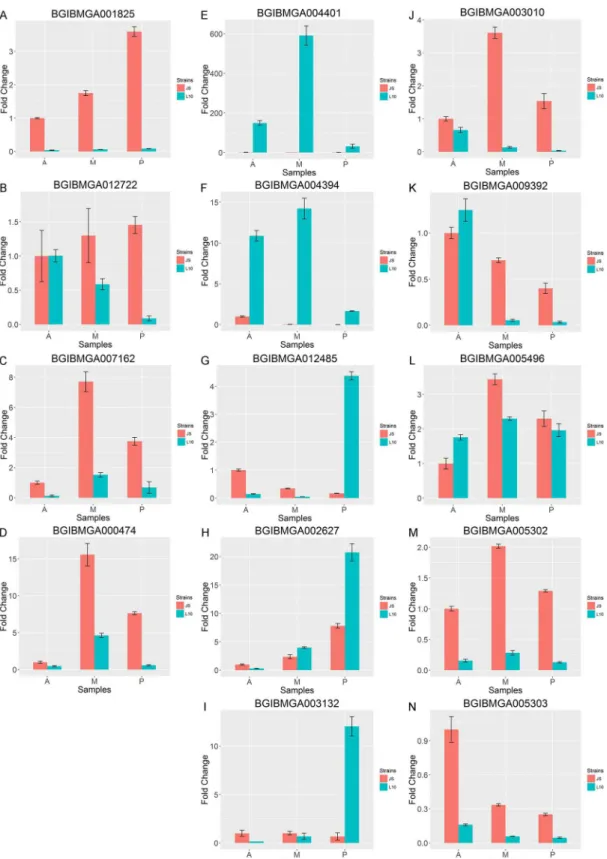
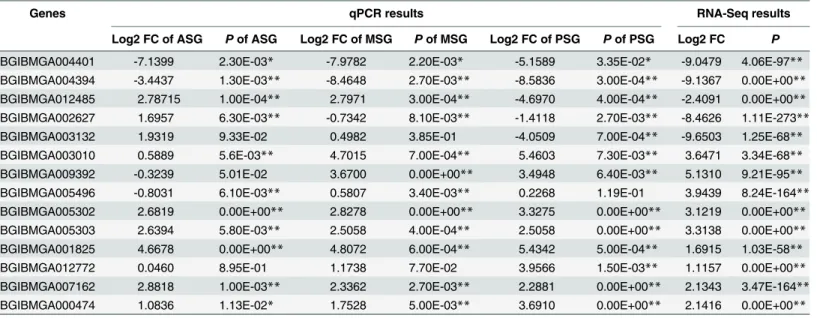
To validate the RNA-Seq data, qPCR was performed for representative genes in the enrichment pathways and 10 additional significantly different genes selected from the DEGs. The gene sequences were obtained from the silkworm genome sequence [33]. The qPCR expression results were similar to the results obtained from the Illumina sequencing data. In enrichment pathways, the expressions of three representative genes in JS were significantly higher than that in L10 (P0.05,Fig 2,Table 3). The expression ofBGIBMGA012722in JS was significantly higher than that in the L10 PSG. For the other 10 DEGs, genes in the second column ofFig 2
were up-regulated in the L10 SG compared to JS (P0.05,Fig 2E~2I,Table 3). In contrast, the genes in the third column ofFig 2were more highly expressed in JS SG (P0.05,Fig 2J~2N,
Table 3).
Based on the qRT-PCR results, we found that the following genes were differentially expressed in the SGs, fat, midgut, and hemolymph (S4 Fig). Compared with JS, genes with higher expression in the SG of L10, most of which were more highly expressed in the fat body (BGIBMGA004401andBGIBMGA004394) and some of which were expressed at significantly higher levels in the midgut (BGIBMGA002627andBGIBMGA003132). Compared with L10, genes with higher expression in the SG of JS silkworms, were also expressed highly in the fat body, however, expression of the genes was lower than that observed in the hemolymph of L10 silkworms. As described above, the expression patterns of DEGs in SGs was different from that of fat body and hemolymph in L10 and JS. Moreover, we predicted that the biosynthesis and secretion of silk proteins may depend on the cooperation of multiple tissues. The expression profiles of these genes across six tissues are shown inS4 Fig.
Discussion
Enrichment pathways in SGs were mainly related to protein synthesis
Fig 2. Quantitative real-time PCR validation for genes.Red bars indicate gene expression in JS and blue bars indicate gene expression in L10. A and B are related to spliceosome enriched transcripts, C and D are involved in ribosome biogenesis. Transcripts in JS were significantly higher than L10 between each comparison pair. Genes of the second column (E-I) were with higher expression of SGs in L10. Genes of the third column (J-N) were with higher expression of SGs in JS.A:the anterior SG in L10 or JS;M:the middle SG in L10 or JS;P:the posterior SG in L10 or JS.
spliceosome sites and may be associated with silk expression inBombyx mori[39]. Indeed, our results showed that DEGs were enriched in the spliceosome pathway in the SG, suggesting that genes related to silk yield may facilitate the expression of silk protein.
DEGs up-regulated in L10
We characterized 10 DEGs, five of which were regulated in L10, and five of which were up-regulated in JS (Fig 2andS4 Fig). We manually annotated the functions of these 10 DEGs. In L10, genes encoding a 30 kDa lipoprotein and phosphoserine aminotransferase were up-regu-lated. The gene encoding the 30 kDa lipoprotein is expressed mainly in the fat body and integu-ment during the larval and pupal stages [40,41] and is involved in various physiological processes, including energy storage, embryonic development, and immune response in silk-worms [42–45]. The 30 kDa protein is involved in the degeneration of theB.moriSG by a cas-pase-dependent pathway [46]. Thus, the highly efficient biosynthesis and secretion of silk proteins may be suppressed by the 30 kDa lipoprotein. We also identified the
BGIBMGA012485gene, which functions as a phosphoserine aminotransferase and is involved in serine biosynthesis [47,48], as being up-regulated in the PSG but not the ASG or MSG of L10; the opposite expression pattern was observed in JS. We speculated that this gene may be regulated by another component that could specifically block production in the MSG and ASG in L10. As we known, the spinneret is another important tissue for spinning. Filippi's glands (FG), which are a pair of tiny glands located at the distal ends of the two ASGs, join to form a common duct. Spinneret and FGs contribute to silk formation, spinneret-expressed genes are closely related to silk formation and provide a suitable environment for silk fiber formation. In a previous study, FGs were suggested to possibly function in transporting small solutes to the ASG duct [49]. DEGs in the spinneret and FG between day 3 of fifth instar larvae and wander-ing stage larvae were mainly enriched in the pathways associated with ion-transport, chitin binding, and energy metabolism. But these findings are different from our study in which it is mainly related to pyrimidine metabolism, ribosome biogenesis in eukaryotes, and the
Table 3. Comparison of NSG and qPCR results in SG between L10 and JS.
Genes qPCR results RNA-Seq results
Log2 FC of ASG Pof ASG Log2 FC of MSG Pof MSG Log2 FC of PSG Pof PSG Log2 FC P
BGIBMGA004401 -7.1399 2.30E-03* -7.9782 2.20E-03* -5.1589 3.35E-02* -9.0479 4.06E-97** BGIBMGA004394 -3.4437 1.30E-03** -8.4648 2.70E-03** -8.5836 3.00E-04** -9.1367 0.00E+00** BGIBMGA012485 2.78715 1.00E-04** 2.7971 3.00E-04** -4.6970 4.00E-04** -2.4091 0.00E+00** BGIBMGA002627 1.6957 6.30E-03** -0.7342 8.10E-03** -1.4118 2.70E-03** -8.4626 1.11E-273**
BGIBMGA003132 1.9319 9.33E-02 0.4982 3.85E-01 -4.0509 7.00E-04** -9.6503 1.25E-68**
BGIBMGA003010 0.5889 5.6E-03** 4.7015 7.00E-04** 5.4603 7.30E-03** 3.6471 3.34E-68** BGIBMGA009392 -0.3239 5.01E-02 3.6700 0.00E+00** 3.4948 6.40E-03** 5.1310 9.21E-95** BGIBMGA005496 -0.8031 6.10E-03** 0.5807 3.40E-03** 0.2268 1.19E-01 3.9439 8.24E-164** BGIBMGA005302 2.6819 0.00E+00** 2.8278 0.00E+00** 3.3275 0.00E+00** 3.1219 0.00E+00** BGIBMGA005303 2.6394 5.80E-03** 2.5058 4.00E-04** 2.5058 0.00E+00** 3.3138 0.00E+00** BGIBMGA001825 4.6678 0.00E+00** 4.8072 6.00E-04** 5.4342 5.00E-04** 1.6915 1.03E-58**
BGIBMGA012772 0.0460 8.95E-01 1.1738 7.70E-02 3.9566 1.50E-03** 1.1157 0.00E+00**
BGIBMGA007162 2.8818 1.00E-03** 2.3362 2.70E-03** 2.2881 0.00E+00** 2.1343 3.47E-164** BGIBMGA000474 1.0836 1.13E-02* 1.7528 5.00E-03** 3.6910 0.00E+00** 2.1416 0.00E+00**
Log2 FC is referred to log2 fold change andPis referred toPvalue.P0.05 is marked with "*" andP0.01 is marked with "**".
spliceosome. That might be because the SG is responsible for biosynthesis of the silk ingredi-ents and the spinneret and FG provide the environment for mixing the ingrediingredi-ents. It suggests that spinneret, FG and SG play different functional roles during the silk fiber formation. Despite high expression in the PSG of L10, the silk yield was low. Thus, of the up-regulated DEGs in the L10, some may play important roles in defense against pathogens and in low effi-ciency of protein synthesis. Additionally, some of the genes may be involved in signaling pro-cesses during cell communication.
DEGs up-regulated in JS
We identified a number of genes that were up-regulated in JS, including a gene (BGIBMGA0 03010) encoding a protein with similar function to Werner helicase-interacting protein 1 (WRNIP1).BGIBMGA003010encodes a protein that exhibits ATPase activity and is involved in DNA synthesis and WRNIP1 has been reported to function in the metabolism of ubiquitinated proteins [50]. Several different DNA repair pathways have been shown to be regulated by ubiquitination. For example, the proper execution of nucleotide excision repair depends upon the polyubiquitination and degradation of a subset of its component enzymes [51,52], whereas translesion DNA synthesis is regulated by mono- and polyubiquitination of
PCNA3[53]. TheBGIBMGA009392gene encodes a protein with protein kinase functional-ity, which is fundamental to most signaling and regulatory processes in eukaryotic cells [54]. The DESs up-regulated in JS are mainly enriched in the pyrimidine metabolism, spliceosome and ribosome biogenesis pathways. The up-regulatory genes in the pyrimidine metabolism and spliceosome pathways will facilitate the transcription process of mRNAs which are required during the silk fiber synthesis and the highly expressed genes in ribosome biogene-sis pathway will benefit the translation process of silk related proteins. The more proteins are translated, the more silk fiber will be produced. That might be the cause which led to the difference in silk production between two silkworm strains.
Supporting Information
S1 Fig. The proportions of genes covered by clean reads in L10 and JS (TIF)
S2 Fig. Annotated KEGG pathways in SG transcriptome data. (TIF)
S3 Fig. Annotated GO terms in SG transcriptome data. (TIF)
S4 Fig. Quantitative real-time PCR validation for genes in six tissues. A:the anterior SG in L10 or JS;F:the fat of L10 or JS;M:the middle SG in L10 or JS;P:the posterior SG in L10 or JS;X:the haemolymph of L10 or JS;ZC:the midgut of L10 or JS.
(TIF)
S1 Table. Primer sequences used for the qPCR validation experiment. (XLSX)
S2 Table. Summary of Illumina sequencing and reads mapping. (XLSX)
S4 Table. The DEGs in enrichment pathways. (XLSX)
Acknowledgments
This project was supported by the National Natural Science Foundation of China (grant No. 31372375), the Natural Science Foundation of JiangSu Province (BK20131240) and the Project of the State Key Laboratory of Silkworm Genome Biology (sklsgb2013020). The manuscript was improved by Editage.
Author Contributions
Conceived and designed the experiments: ML. Performed the experiments: JL HY JZ NL YY. Analyzed the data: SQ JL. Wrote the paper: ML CH SQ.
References
1. Goldsmith MR, Shimada T, Abe H (2005) The genetics and genomics of the silkworm,Bombyx mori. Annu Rev Entomol 50: 71–100. PMID:15355234
2. Sun W, Yu H, Shen Y, Banno Y, Xiang Z, Zhang Z, (2012) Phylogeny and evolutionary history of the silkworm. Sci China Life Sci 55: 483–496. doi:10.1007/s11427-012-4334-7PMID:22744178 3. Ma L, Xu H, Zhu J, Ma S, Liu Y, Jiang R, et al. (2011) Ras1(CA) overexpression in the posterior silk
gland improves silk yield. Cell Res 21: 934–943. doi:10.1038/cr.2011.36PMID:21403678
4. Li B, Wang XY, Hou CX, Xu AY, Li MW (2013) Genetic analysis of quantitative trait loci for cocoon and silk production quantity inBombyx mori(Lepidoptera: Bombycidae). Eur J Entomol 110: 205–213. 5. Hou CX, Sun PJ, Guo XJ, Huang YP, Li MW (2013) Marker-assisted selection in breeding silkworm
strains with high silk production and resistance to the densonucleosis virus. Genet Mol Res 12: 4171–
4178. doi:10.4238/2013.October.7.3PMID:24114212
6. Li MW, Yu HJ, Yi XL, Li J, Dai FY, Hou CX. (2015) Marker-assisted selection in breeding silkworm strains with high tolerance to fluoride, scaleless wings, and high silk production. Genet Mol Res 14: 11162–11170. doi:10.4238/2015.September.22.10PMID:26400347
7. Zhan SA, Huang JH, Guo QH, Zhao YP, Li WH, Huang YP. (2009) An integrated genetic linkage map for silkworms with three parental combinations and its application to the mapping of single genes and QTL. BMC Genomics 10.
8. Xu Q, Lu A, Xiao G, Yang B, Zhang J, Li X, et al. (2012) Transcriptional profiling of midgut immunity response and degeneration in the wandering silkworm,Bombyx mori. PLoS One 7: e43769. doi:10. 1371/journal.pone.0043769PMID:22937093
9. Hou C, Qin G, Liu T, Geng T, Gao K, Pan Z, et al. (2014) Transcriptome analysis of silkworm,Bombyx mori, during early response to Beauveria bassiana challenges. PLoS One 9: e91189. doi:10.1371/ journal.pone.0091189PMID:24618587
10. Xia QY, Li S, Feng QL (2014) Advances in Silkworm Studies Accelerated by the Genome Sequencing ofBombyx mori. Annu Rev Entomol Vol 59, 2014 59: 513–536.
11. Inoue S, Tanaka K, Arisaka F, Kimura S, Ohtomo K, Mizuno S. (2000) Silk fibroin ofBombyx moriis secreted, assembling a high molecular mass elementary unit consisting of H-chain, L-chain, and P25, with a 6:6:1 molar ratio. J Biol Chem 275: 40517–40528. PMID:10986287
12. Maekawa H, Suzuki Y (1980) Repeated turn-off and turn-on of fibroin gene transcription during silk gland development ofBombyx mori. Dev Biol 78: 394–406. PMID:7409308
13. Takasu Y, Hata T, Uchino K, Zhang Q (2010) Identification ofSer2proteins as major sericin compo-nents in the non-cocoon silk ofBombyx mori. Insect Biochem Molec 40: 339–344.
14. Kimoto M, Kitagawa T, Kobayashi I, Nakata T, Kuroiwa A, Takiya S. (2012) Inhibition of the binding of MSG-intermolt-specific complex, MIC, to thesericin-1gene promoter andsericin-1gene expression by POU-M1/SGF-3. Dev Genes Evol 222: 351–359. doi:10.1007/s00427-012-0418-4PMID:23070540 15. Okamoto H, Ishikawa E, Suzuki Y (1982) Structural analysis of sericin genes. Homologies with fibroin
gene in the 5' flanking nucleotide sequences. J Biol Chem 257: 15192–15199. PMID:6294094 16. Michaille JJ, Couble P, Prudhomme JC, Garel A (1986) A single gene produces multiple sericin
17. Michaille JJ, Garel A, Prudhomme JC (1990) Cloning and characterization of the highly polymorphic Ser2gene ofBombyx mori. Gene 86: 177–184. PMID:2323571
18. Zurovec M, Yang C, Kodrik D, Sehnal F (1998) Identification of a novel type of silk protein and regula-tion of its expression. J Biol Chem 273: 15423–15428. PMID:9624126
19. Julien E, Bordeaux MC, Garel A, Couble P (2002) Fork head alternative binding drives stage-specific gene expression in the silk gland ofBombyx mori. Insect Biochem Mol Biol 32: 377–387. PMID:
11886772
20. Marshall A (1998) The insects are coming. Nat Biotechnol 16: 530–533. PMID:9624682
21. Andrews S (2010) FastQC: A quality control tool for high throughput sequence data. Reference Source.
22. Gordon A, Hannon G (2010) Fastx-toolkit. FASTQ/A short-reads preprocessing tools (unpublished) http://hannonlab.cshl.edu/fastx_toolkit.
23. Wang J, Xia Q, He X, Dai M, Ruan J, Chen J, et al. (2005) SilkDB: a knowledgebase for silkworm biol-ogy and genomics. Nucleic Acids Res 33: D399–402. PMID:15608225
24. Langmead B, Salzberg SL (2012) Fast gapped-read alignment with Bowtie 2. Nat Methods 9: 357–
359. doi:10.1038/nmeth.1923PMID:22388286
25. Mortazavi A, Williams BA, McCue K, Schaeffer L, Wold B (2008) Mapping and quantifying mammalian transcriptomes by RNA-Seq. Nat Methods 5: 621–628. doi:10.1038/nmeth.1226PMID:18516045 26. Wang L, Feng Z, Wang X, Wang X, Zhang X (2010) DEGseq: an R package for identifying differentially
expressed genes from RNA-seq data. Bioinformatics 26: 136–138. doi:10.1093/bioinformatics/btp612
PMID:19855105
27. Benjamini Y, Hochberg Y (1995) Controlling the false discovery rate: a practical and powerful approach to multiple testing. J R Stat Soc B (Methodological): 289–300.
28. Chen Z, Xue C, Zhu S, Zhou F, Xuefeng BL, Liu GP, et al. (2004) GoPipe: streamlined gene ontology annotation for batch anonymous sequences with statistics. Sheng wu hua xue yu sheng wu wu li jin zhan 32: 187–191.
29. Kanehisa M, Goto S, Furumichi M, Tanabe M, Hirakawa M (2010) KEGG for representation and analy-sis of molecular networks involving diseases and drugs. Nucleic Acids Res 38: D355–360. doi:10.
1093/nar/gkp896PMID:19880382
30. Bustin SA, Benes V, Garson JA, Hellemans J, Huggett J, Kubista M, et al. (2009) The MIQE guidelines: minimum information for publication of quantitative real-time PCR experiments. Clin Chem 55: 611–
622. doi:10.1373/clinchem.2008.112797PMID:19246619
31. Livak KJ, Schmittgen TD (2001) Analysis of relative gene expression data using real-time quantitative PCR and the 2(-Delta Delta C(T)) Method. Methods 25: 402–408. PMID:11846609
32. Jin S, Cheng T, Jiang L, Lin P, Yang Q, Xiao Y, et al. (2014) Identification of a new Sprouty protein responsible for the inhibition of theBombyx morinucleopolyhedrovirus reproduction. PLoS One 9: e99200. doi:10.1371/journal.pone.0099200PMID:24915434
33. Xia Q, Zhou Z, Lu C, Cheng D, Dai F, Li B, et al. (2004) A draft sequence for the genome of the domesti-cated silkworm (Bombyx mori). Science 306: 1937–1940. PMID:15591204
34. Leary DJ, Huang S (2001) Regulation of ribosome biogenesis within the nucleolus. FEBS Lett 509: 145–150. PMID:11741579
35. Lempiainen H, Shore D (2009) Growth control and ribosome biogenesis. Curr Opin Cell Biol 21: 855–
863. doi:10.1016/j.ceb.2009.09.002PMID:19796927
36. Delaunay J, Mathieu C, Schapira G (1972) Eukaryotic ribosomal proteins. Interspecific and intraspecific comparisons by two-dimensional polyacrylamide-gel electrophoresis. Eur J Biochem 31: 561–564.
PMID:4650157
37. Guthrie C, Patterson B (1988) Spliceosomal snRNAs. Annu Rev Genet 22: 387–419. PMID:2977088 38. Will CL, Luhrmann R (2001) Spliceosomal UsnRNP biogenesis, structure and function. Curr Opin Cell
Biol 13: 290–301. PMID:11343899
39. Zha XF, Xia QY, Zhao P, Li J, Duan J, Wang ZL, et al. (2005) Detection and analysis of alternative splic-ing in the silkworm by alignsplic-ing expressed sequence tags with the genomic sequence. Insect Mol Biol 14: 113–119. PMID:15796744
40. Casasnovas JM, Larvie M, Stehle T (1999) Crystal structure of two CD46 domains reveals an extended measles virus-binding surface. EMBO J 18: 2911–2922. PMID:10357804
42. Hou Y, Zou Y, Wang F, Gong J, Zhong X, Xia Q, et al. (2010) Comparative analysis of proteome maps of silkworm hemolymph during different developmental stages. Proteome Sci 8: 45. doi: 10.1186/1477-5956-8-45PMID:20822545
43. Ujita M, Kimura A, Nishino D, Yokoyama E, Banno Y, Fujii H, et al. (2002) Specific binding of silkworm Bombyx mori30-kDa lipoproteins to carbohydrates containing glucose. Biosci Biotechnol Biochem 66: 2264–2266. PMID:12450147
44. Ujita M, Katsuno Y, Kawachi I, Ueno Y, Banno Y, Fujii H, et al. (2005) Glucan-binding activity of silk-worm 30-kDa apolipoprotein and its involvement in defense against fungal infection. Biosci Biotechnol Biochem 69: 1178–1185. PMID:15973050
45. Kim EJ, Park HJ, Park TH (2003) Inhibition of apoptosis by recombinant 30K protein originating from silkworm hemolymph. Biochem Biophys Res Commun 308: 523–528. PMID:12914782
46. Ji MM, Liu AQ, Gan LP, Xing R, Wang H, Sima YH, et al. (2013) Functional analysis of 30K proteins dur-ing silk gland degeneration by a caspase-dependent pathway in Bombyx. Insect Mol Biol 22: 273–283.
doi:10.1111/imb.12019PMID:23496335
47. Bai G, Schaak DD, Smith EA, McDonough KA (2011) Dysregulation of serine biosynthesis contributes to the growth defect of a Mycobacterium tuberculosis crp mutant. Mol Microbiol 82: 180–198. doi:10.
1111/j.1365-2958.2011.07806.xPMID:21902733
48. Ali V, Nozaki T (2006) Biochemical and functional characterization of phosphoserine aminotransferase from Entamoeba histolytica, which possesses both phosphorylated and non-phosphorylated serine metabolic pathways. Mol Biochem Parasitol 145: 71–83. PMID:16289358
49. Wang X, Li Y, Peng L, Chen H, Xia Q, Zhao P. (2016) Comparative transcriptome analysis ofBombyx morispinnerets and Filippi's glands suggests their role in silk fiber formation. Insect Biochem Mol Biol 68: 89–99. doi:10.1016/j.ibmb.2015.11.003PMID:26592349
50. Bish RA, Myers MP (2007) Werner helicase-interacting protein 1 binds polyubiquitin via its zinc finger domain. J Biol Chem 282: 23184–23193. PMID:17550899
51. Sugasawa K, Okuda Y, Saijo M, Nishi R, Matsuda N, Chu G, et al. (2005) UV-induced ubiquitylation of XPC protein mediated by UV-DDB-ubiquitin ligase complex. Cell 121: 387–400. PMID:15882621 52. Nag A, Bondar T, Shiv S, Raychaudhuri P (2001) The xeroderma pigmentosum group E gene product
DDB2 is a specific target of cullin 4A in mammalian cells. Mol Cell Biol 21: 6738–6747. PMID:
11564859
53. Hoege C, Pfander B, Moldovan GL, Pyrowolakis G, Jentsch S (2002) RAD6-dependent DNA repair is linked to modification of PCNA by ubiquitin and SUMO. Nature 419: 135–141. PMID:12226657 54. Engh RA, Bossemeyer D (2002) Structural aspects of protein kinase control-role of conformational