UNIVERSITY OF SAO PAULO
ENGINEERING SCHOOL OF SÃO CARLOS
INSTITUTE OF PHYSICS OF SÃO CARLOS
INSTITUTE OF CHEMISTRY OF SÃO CARLOS
SUPERIOR NORMAL SCHOOL OF CACHAN
LABORATORY OF MECHANICS AND TECHNOLOGY
FATIGUE LIFE EVALUATION OF A356 ALUMINUM ALLOY
USED FOR ENGINE CYLINDER HEAD
MAURICIO ANGELONI
MAURICIO ANGELONI
AVALIAÇÃO DA VIDA EM FADIGA DE LIGA DE
ALUMÍNIO A356 UTILIZADA EM CABEÇOTE DE MOTOR
Tese apresentada ao Programa de Pós-Graduação Interunidades em Ciência e Engenharia de Materiais da Universidade de São Paulo, para a obtenção do Título de Doutor em Ciência e Engenharia de Materiais.
Orientedores: Prof. Dr. Waldek W. Bose Filho Profª. Dra. Sylvie Pommier
THÈSE DE DOCTORAT
DE L’ECOLE NORMALE SUPERIEURE DE CACHAN
PRESENTEE PAR Monsieur Mauricio ANGELONI
POUR OBTENIR LE GRADE DE
DOCTEUR DE L’ECOLE NORMALE SUPERIEURE DE CACHAN
DOMAINE :
Mécanique- Génie mécanique – Génie civil
SUJET DE LA THESE:
Évaluation de la vie en fatigue en a
lliage d’
aluminium A356 utilisé pour les
culasses de moteurs
Thèse en cotutelle entre l’Universite de São Paulo, São Carlos (Brésil) et L’Ecole Normale
Superieure de Cachan présentée et soutenue à l’Instituto de Física de São Carlos (Brésil) le 22
mars 2011 devant le jury composé de :
M. Waldek W. Bose Filho Professeur USP Examinateur et directeur de thèse Mme. Sylvie Pommier Professeur ENS-Cachan Examinateur et directrice de thèse Renné Billardon Professeur UPMC Président et examinateur
Yves Nadot Professeur ENSMA Rapporteur
Sérgio P. B. Proença Professeur USP Examinateur
José Alexander Araújo Professeur UNB Rapporteur et Examinateur
Jonas de Carvalho Professeur USP Examinateur
AUTORIZO A REPRODUÇÃO E DIVULGAÇÃO TOTAL OU PARCIAL DESTE TRABALHO, POR QUALQUER MEIO CONVENCIONAL OU ELETRÔNICO, PARA FINS DE ESTUDO E PESQUISA, DESDE QUE CITADA A FONTE.
Ficha catalográfica preparada pela Seção de Tratamento da Informação do Serviço de Biblioteca – EECS/USP
Angeloni, Mauricio
A584a Avaliação da Vida em Fadiga de Liga de Alumínio A356 Utilizada em Cabeçote de Motor / Mauricio Angeloni; orientador Waldek Wladimir Bose Filho e Sylvie Pommier. -- São Carlos, 2011.
Tese (Doutorado-Programa de Pós-Graduação e Área de Concentração Interunidades em Ciência e Engenharia de Materiais) – Escola de Engenharia de São Carlos, Instituto de Física de São Carlos, Instituto de Química de São Carlos da Universidade de São Paulo, 2011.
ACKNOWLEDGEMENTS
Professors Supervisors Dr. Waldek W. Bose Filho and Dra. Sylvie Pommier for his tireless and able guidance and also for the support, friendship and trust, without which this work would not have been accomplished.
To Professor. Dr. Spinelli Dirceu by trust and belief.
I thank my parents Gilberto Angeloni and Diva Maria Cordeiro Angeloni and my girlfriend Wuendy Fernanda Cardili for encouragement and support in difficult times.
The friends of the Department of Materials Engineering of Engineering School of São Carlos-USP and the friends of the Laboratory of Mechanics and Technology of ENS-Cachan for their immeasurable support in hard times.
RESUMO
ANGELONI, M. Avaliação da Vida em Fadiga de Liga de Alumínio A356 Utilizada em Cabeçote de Motor. 2011. 201p. Tese (Doutorado) – Escola de Engenharia de São Carlos, Instituto de Física de São Carlos, Instituto de Química de São Carlos, Universidade de São Paulo, São Carlos, 2011.
Para caracterizar componentes usados em aplicações de alta responsabilidade não basta apenas conhecer a composição química e os resultados de ensaios de tração, impacto e dureza, pois estes podem não fornecer os subsídios necessários que permitam prever, de maneira confiável, o comportamento dos componentes nas condições reais de trabalho. Exemplo disto são os cabeçotes de motor automotivos, submetidos a tensões térmicas e mecânicas relativamente altas durante seu uso normal e altíssimo em condições extremas. Durante longos tempos de funcionamento e eventuais falhas na refrigeração e ou lubrificação a temperatura pode chegar a valores próximos de 300ºC. Esta variação de temperaturas provoca choques térmicos que podem gerar trincas e/ou uma grande quantidade de deformação plástica em regiões próximas aos pistões. Desconsiderando a presença de choques térmicos provocados por falhas, ainda assim, uma pequena quantidade de ciclos de acionamento e parada do motor, é considerada como os principais causadores de pequenas trincas. Isso indica que o surgimento de trincas em cabeçotes de motor deve ser considerado um problema de fadiga termomecânica de baixo ciclo. Outro problema é a heterogeneidade microestrutural no componente devido ao processo de fundição, levando a propriedades mecânicas e físicas diferentes em uma mesma peça. Além da presença de porosidade gerada por bolhas de gás e vazios de solidificação, que podem adquirir tamanho tal que se aproximem de pequenas trincas, diminuindo a vida para a nucleação e assim mudando o foco do problema para o de propagação de trinca por fadiga. A proposta deste trabalho foi a de determinar as propriedades de fadiga isotérmica e termomecânica através de ensaios de fadiga de baixo ciclo, bem como as propriedades de propagação de trinca por fadiga, relaxação, caracterização microestrutural e modelagem do comportamento mecânico por elementos finitos para a liga de alumínio utilizada na fabricação de cabeçotes de motores automotivos pela indústria nacional. Todos os ensaios e análises computacionais foram realizados nos laboratórios da Universidade de São Paulo (EESC-USP) e da École Normale Supérieure de Cachan (ENS-LMT). Os ensaios de fadiga isotérmica foram realizados nas temperaturas de 120ºC e 280ºC e os ensaios termomecânicos foram realizados em fase entre as temperaturas de 120ºC e 280ºC. Os ensaios de relaxação foram realizados em várias temperaturas com carregamento de onda trapezoidal, enquanto que os ensaios de propagação de trinca por fadiga foram realizados nas temperaturas de 120ºC, 200ºC e 280ºC para carregamentos de onda senoidal e trapezoidal em controle de carga e de deslocamento. Foi feita também análise microestrutural nos corpos de prova, após os ensaios de fadiga, por microscopia óptica e por microscopia eletrônica de varredura MEV. Os resultados destes ensaios mostraram que os defeitos de fundição e a falta de homogeneidade no material, aliados a longos tempos de exposição a carregamentos e em altas temperaturas, constituem um fator crítico no desempenho do componente. Estes resultados ajudarão a estabelecer modelos precisos de previsão de vida para os cabeçotes de motor.
ABSTRACT
ANGELONI, M. Fatigue Life Evaluation of A356 Aluminum Alloy used for Engine Cylinder Head. 2011. 201p. Tese (Doutorado) – Escola de Engenharia de São Carlos, Instituto de Física de São Carlos, Instituto de Química de São Carlos, Universidade de São Paulo, São Carlos, 2011.
In order to characterize mechanical components used in high responsibility applications, the knowledge of chemical composition and results from regular experiments such as traction, impact and hardness tests is important, but not sufficient. They cannot supply the necessary information that permit anticipating, in a reliable way, the components’ behavior in actual working conditions. As an example, there are engine’s cylinder head submitted to mechanical and thermal tensions that are relatively high during the in service use, and very high in same very demanding condition. During long run times and any failure in the cooling and/or lubrication the temperature may reach 300ºC. This temperature variation causes thermal shocks which may generate cracks and/or a wide ranging of plastic deformation in regions close to the pistons. Even not considering the thermal shock effects caused by failure, even so, a short number of start-up and shutdown cycles of engine, are considered the main cause of small cracks. This indicates that the generation of cracks in cylinder head may be considered as low cycle thermomechanical fatigue problem. Another problem is the microstructure heterogeneity in the component due to the casting process, leading to different physical and mechanical properties in the same piece. Besides the presence of porosity generated by gas bubbles and voids of solidification, which may be as great as short crack, reducing the
nucleation life and changing the problem’s focus for the fatigue crack growth. The purpose of this study was to determine the isothermal and thermomechanical fatigue property through low cycle fatigue, as well as the fatigue crack growth, relaxation, microestrutural characterization and modeling of mechanical behavior by finite element for the aluminum alloy employed in the manufacture of engine cylinder head by the national automotive industry. All tests and computer analysis were performed in the laboratories of the University of São Paulo (EESC-USP) and the École Normale Supérieure de Cachan (ENS-LMT). Isothermal fatigue experiments were carried out at temperature of 120ºC and 280ºC and the thermomechanical performed in phase between the temperatures of 120ºC and 280ºC. The relaxation experiments were performed at some temperatures with trapezoidal wave loading, whereas the experiments of fatigue crack growth carried out at temperatures of 120ºC, 200ºC and 280ºC for sine and trapezoidal wave loading in displacement and load control. The microstructure analysis was also made in the specimens after the fatigue test by optical microscopy and scanning electron microscopy SEM. The results of these experiments showed
that the casting defects and material’s inhomogeneities, coupled long run times in high
temperatures and loads, are a critical factor in the component performance. These results help us to establish accurate models for life prediction of the engine cylinder head.
RÉSUMÉ
ANGELONI, M. Évaluation de la Vie en Fatigue en Alliage d’Aluminium A356 utilisés pour la Culasse du Moteur. 2011. 201p. Tese (Doutorado) – Escola de Engenharia de São Carlos, Instituto de Física de São Carlos, Instituto de Química de São Carlos, Universidade de São Paulo, São Carlos, 2011.
Afin de caractériser les composants qui demande de haut-responsabilité ne suffit pas de connaître la composition chimique et les résultats des essais de traction, impact et dureté, car ils ne peuvent pas fournir des données nécessaire qui permettent de prédire avec certitude le comportement des composants dans les conditions réelles de travail. Des exemples sont des culasses du moteur, soumis à des contraintes thermiques et mécaniques relativement élevé en utilisation normale et très élevé dans des conditions extrêmes. Pour de longues périodes de fonctionnement et pour d’eventuels défauts de refroidissement ou de lubrification la température peut atteindre des valeurs proches de 300°C. Cette variation de température provoque un choc thermique qui peut provoquer des fissures et/ou une grande quantité de déformation plastique dans les régions proches des pistons. Sans tenir compte la présence de chocs thermiques causés par des défaillance, encore, une petite quantité de cycles de démarrer et d'arrêt du moteur, est considérée comme la principale cause des fissures petites. Cela indique que l'apparition de fissures dans la culasses du moteur doivent être considérés comme un problème de fatigue thermomécanique oligocyclique. An autre problème est la hétérogénéité de la microstructure du composante en raison du processus de fonderie, conduisant à des différents propriétés physiques et mécaniques dans la même pièce. De plus, la présence de porosité généré par les bulles de gaz et les vides de la solidification, qui peut obtenir une telle taille qui viennent à proximité des petits fissures, réduisant la vie à la nucléation et donc changer le centre de l'attention pour la propagation des fissures par fatigue. Le but de cette étude était de déterminer les propriétés des essais de fatigue isotherme et thermomécanique utilisant de fatigue oligocyclique, ainsi que les propriétés de propagation des fissures de fatigue, la relaxation, la caractérisation et la modélisation du comportement mécanique par éléments finis pour une alliage d’aluminium utilisé dans la fabrication de culasse du moteur automobile par l’industrie nationale. Tous les essais et l'analyse numérique ont été effectuées dans les laboratoires de l'Université de São Paulo (USP-EESC) et l'École Normale Supérieure de Cachan (ENS-LMT). Les essais de fatigue isotherme ont été effectués à des températures de 120°C et 280°C et les thermomécanique ont été réalisées en phase entre les températures de 120°C et 280ºC. Les essais de relaxation ont été effectués à différentes températures avec des chargement d’ondes trapézoïdale, tandis que les essais de propagation des fissures de fatigue ont été réalisés à des températures de 120°C, 200°C et 280°C avec des
chargement d’ondes trapézoïdale et sinusoïdales sûr le contrôle de charge et de déplacement.
A été faite l’analyse des microstructures dans les échantillons, après les essais de fatigue, pour microscopie optique et microscopie électronique à balayage MEB. Les résultats de ces essais ont montré que les défauts de fonderie et le manque d'homogénéité dans le matériau, couplé avec des longue temps de exposition à des températures élevées et des charges, constituent un facteur critique dans l'exécution de la composante. Ces résultats aideront à établir des modèles précis de prédiction de la vie pour les culasses de moteur.
SUMÁRIO
LIST OF FIGURES ... xiii
LIST OF TABLES ... xviii
LIST OF SYMBOLS ... xix
INTRODUCTION ... 22
CHAPTER 1: MATERIAL ... 25
1.1 Metal Alloys in Molten State... 25
1.2 Cast Aluminum Alloys ... 27
1.3 Aluminum-Silicon 300 Series ... 32
1.3.1 Silicon Modifiers ... 34
1.3.2 Non-Metallic Inclusions ... 37
1.3.3 Inter-Metallic Phases ... 37
1.3.4 Grain Refinement and Porosity ... 40
1.3.5 Influence of Impurities ... 43
1.4 Defects and Fracture Toughness... 44
1.5 Solidification Rate and SDAS ... 45
1.6 Brief of Chapter 1 ... 47
CHAPTER 2: TEMPERATURE EFFECTS ... 48
2.1 Effect of High Temperature on Materials... 48
2.2 Creep-Fatigue Interaction ... 50
2.3 Damage and Crack Initiation at High Temperatures ... 52
2.3.1 Cyclic Sliding ... 52
2.3.2 Creep Cavitation ... 53
2.3.3 Grain Boundary Sliding ... 55
2.3.4 Oxidation and Corrosion ... 56
2.4 Brief of Chapter 2 ... 58
CHAPTER 3: FATIGUE ... 59
3.1 Fatigue at High Temperature ... 59
3.2 Low-Cycle fatigue ... 60
3.3 Isothermal Fatigue ... 65
3.4 In-Phase and Out-of-Phase Thermomechanical Fatigue and Thermal Fatigue ... 68
3.5 Effect of Porosity on Fatigue Life ... 77
3.6 Life Prediction Models ... 78
3.6.1 Damage Accumulation Models ... 78
3.6.2 Modified-Frequency Coffin-Manson Equations ... 79
3.6.3 Strain-Variation Partitioning Model ... 79
3.6.4 Diverse Models ... 81
3.6.5 Modeling of Anisothermal Hysteresis as a Function of Isothermal Data ... 83
3.6.6 Graphic Method Modeling ... 84
3.6.7 Thermo-Mechanical Fatigue Modeling for Nucleation of Cracks ... 86
3.7 Fatigue Crack Growth ... 89
3.7.1 Effect of Porosity on Fatigue Crack Growth ... 95
3.8 Brief of Chapter 3 ... 99
CHAPTER 4: FINITE ELEMENTS ... 100
4.1 Brief History ... 100
4.2 Finite Element Method ... 101
4.3 Behavior Model ... 106
4.4.1 Study of Displacement Field at Crack Tip ... 109
4.4.2 Model Evolution Equation ... 111
4.5 Brief of Chapter 4 ... 120
CHAPTER 5: METHODOLOGY ... 121
5.1 Experimental Procedures ... 121
5.1.1 Materials ... 121
5.1.2 Manufacturing Process ... 121
5.1.3 Preparation of Test Specimens ... 122
5.1.4 Mechanical Test System... 123
5.1.5 Tensile Tests ... 128
5.1.6 Isothermal and Anisothermal Fatigue Testing ... 128
5.1.7 Crack Growth Tests ... 130
5.1.8 Micro Structural and Fracture Analysis ... 131
5.2 Computational Procedures ... 131
5.2.1 First Step ... 131
5.2.2 Second Step ... 131
5.2.3 Third Step ... 132
5.2.4 Fourth Step ... 132
5.3 Brief of Chapter 5 ... 133
CHAPTER 6: RESULTS AND DISCUTION ... 134
6.1 Experimental Results ... 134
6.1.1 Micro-structural and Chemical Analysis ... 134
6.1.2 Mechanical Tests ... 151
6.1.2.1 Tensile Test ... 151
6.1.2.2 Isothermal Fatigue ... 154
6.1.2.3 Thermomechanical Fatigue (TMF) ... 157
6.1.2.4 Relaxation ... 161
6.1.2.5 Fatigue Crack Growth ... 167
6.2 Computational Results ... 193
6.2.1 Monotonic Loading (Tensile Test) ... 193
6.2.2 Cyclic Loading (Fatigue Test) ... 199
6.2.2.1 Identification of Material Behavior Law Parameters ... 199
6.2.2.2 Identification of Plastic Blunting Law Parameters ... 203
6.2.2.3 Identification of Crack Propagation Law Parameter... 205
CONCLUSIONS ... 208
LIST OF FIGURES
Figure 1: Picture of a fatigue crack that caused the cylinder head to fail during operation. .... 22
Figure 2: (a) Homogeneous nucleation and (b) heterogeneous nucleation (Milan, 2004). ... 26
Figure 3: Schematic representation of (a) planar growth and (b) dendritic growth (Milan, 2004). ... 27
Figure 4: Solidification dendrites of an aluminum alloy with high silicon content (Milan, 2004). ... 27
Figure 5: Schematic representation of a dendrite (Massinon & Constantin, 2002). ... 28
Figure 6: (a) Principle of competitive growth leading to a lamellar eutectic, and (b) schematic representation of a lamellar eutectic (Barralis J., Maeder G., 1997). ... 29
Figure 7: Morphological modifications in Si particles. ... 35
Figure 8: Segregation Factor ... 38
Figure 9: Influence of iron content, solidification rate, and SDAS on fracture toughness, ductility, and particle size in phase in an aluminum alloy (Al-7Si-0,4Mg) (Campbell, 1991). ... 39
Figure 10: (a) 3D schematic representation of a solidification void and its 2D projection; (b) and (c) optical micrograph of solidification voids (Anson & Gruzleski, 1999). ... 41
Figure 11: Schematic representation of void development by micro-contractions in the boundaries of grains and the influence of grain size (Hetke & Gundlach, 1994). ... 42
Figure 12: Influence of solidification rate and SDAS on mechanical strength and ductility of an aluminum alloy casting (Al-7Si-0.4Mg) (Campbell, 1991). ... 43
Figure 13: Correlation between SDAS, grain size, and local solidification time for the Al-4,5Cu alloy (CAMPBELL, 1991)... 46
Figure 14: Influence of temperature on fatigue limit for different alloys (Fuchs, 2001). ... 49
Figure 15: (a) Balanced, slow-fast, and fast-slow fatigue loading; (b) map of mechanisms of life under fatigue in relation to temperature (for fixed values of non-linear variation of strain and frequency) for fast-slow loading in fatigue-creep (Reidel, 1987)... 54
Figure 16: Illustration of Fujita’s mechanism for fatigue crack nucleation (Suresh, 1998). .... 57
Figure 17: Variation of plastic deformation in relation to life of AISI A289 alloys in air and vacuum with frequency and temperature variation (Coffin, 1973). ... 57
Figure 18: Plastic strain amplitude in relation to number of reverses, bi-logarithmic scale (Dieter, 1981). ... 61
Figure 19: Actual stress in relation to number of reverses, in bi-logarithmic scale (Dieter, 1981). ... 62
Figure 20: Total strain amplitude in relation to number of reverses to failure, obtained from the superposition of elastic and plastic deformation in relation to number of reverses to failure (Fuchs, 2001). ... 63
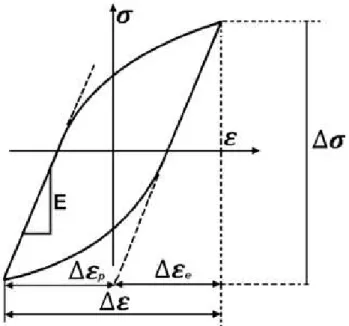
Figure 21: Ideal strain-stress hysteresis loop resulting from a low-cycle fatigue test under constant cyclic strain (Thomas, 1987). ... 64
Figure 22: Isothermal and thermo-mechanical fatigue curves (Shi, 1998). ... 65
Figure 23: Effect of temperature on fatigue life (Srinivasan, 2003). ... 66
Figure 24: Cyclic stress response in relation to temperature (Srinivasan, 2003). ... 67
Figure 25: Comparison between thermal fatigue tests and thermo-mechanical tests (Engler-Pinto Jr., 1996). Todos os parâmetros mecânicos medidos durante o ensaio... 70
Figure 26: Thermal and mechanical variation and total strain in relation to time for out-of-phase (a) and in-out-of-phase (b) thermo-mechanical fatigue. ... 72
Figure 28: Stress-strain relationship for various loading histories and cycling types: (a) continuous strain cycling; (b) level of strain (strain hold); (c) continuous cyclic mean stress; (d) level of stress (stress hold); (e) stress-strain hold limit (CP); (e)
thermo-mechanical status (mixed thermo-mechanical-thermal) (Fuchs, 1980). ... 75
Figure 29: Hysteresis curve under elastic thermo-mechanical strain conditions for phase cycling (Hetmarski, 1991). ... 75
Figure 30: Hysteresis curve under plastic thermo-mechanical strain conditions for phase cycling (Hetmarski, 1991). ... 76
Figure 31: Hysteresis curve under creep thermo-mechanical strain conditions for phase cycling (Hetmarski, 1991). ... 76
Figure 32: SN curves for three aluminum alloys (A, B, and C), with 0.131, 0.168, and -0.158 slopes (Buffière et al., 2001). ... 77
Figure 33: Schematic representation of inelastic deformation variation partitioned into four components, E, P, and C representing elastic, plastic, and creep deformations, respectively (Suresh, 1998). ... 80
Figure 34: Schematic representation of fatigue-life relationships for the partitioning of deformation variation (Suresh, 1998). ... 81
Figure 35: Schematic representation of difference between two inelastic equations (Engler & Spinelli, 2002). ... 85
Figure 36: Curve representing in relation to . ... 91
Figure 37: Propagation stages of a fatigue crack. ... 92
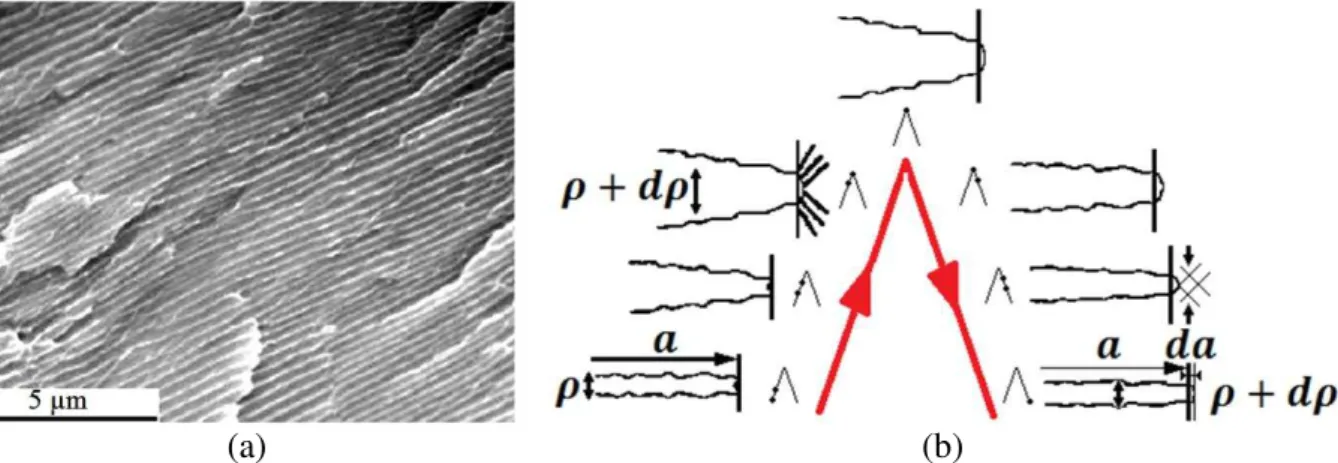
Figure 38: (a) Fatigue grooves observed on rupture surface and (b) mechanism of propagation by rounding and sharpening of the crack tip. ... 93
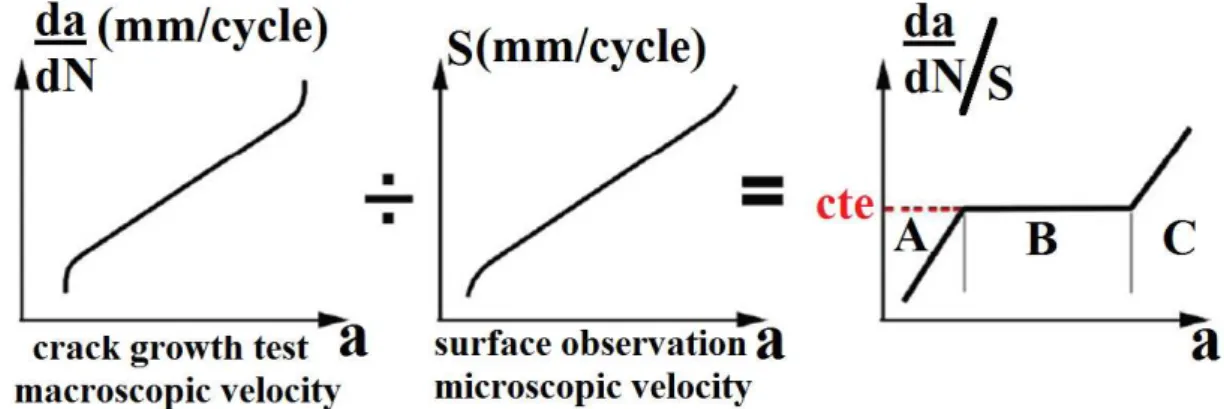
Figure 39: Relationship between groove paces and propagation rate. ... 94
Figure 40: (a) Classification of pores observed by tomography in a specimen after 233,000 cycles; for every pore, the effective stress level was measured in relation to the stress intensity factor, estimated according to pore dimensions X and Y; (b) definition of X and Y on a pore 3D diagram. ... 97
Figure 41: (a) Classification of pore observed by tomography on the surface of a specimen after 233,000 cycles; for each pore, the measurement between the crack lateral length ( ) on the surface (including pore) and the maximum lateral pore dimension below the surface ( ) is indicated in relation to ; the different symbols indicate whether crack has not spread ( ) or has spread ( ); (b) definition of and : in black, intersection of pore with specimen surface; in gray, 2D projection of 3D shape of pore below the surface (Buffière et al., 2001). ... 98
Figure 42: Design cycle. ... 102
Figure 43: The exhaust fan (a) physical problem and (b) the continuum... 104
Figure 44: The continuum discretized by countless elements. ... 104
Figure 45: Typical post-processing stage of a commercial package. ... 106
Figure 46: Coordinate system around the crack. ... 109
Figure 47. Evolution of plastic rounding in relation to applied stress intensity factor... 113
Figure 48: Algorithm of propagation with incremental law. ... 116
Figure 49: Evolution of contact point in relation to the plastic rounding law at (a) negative contact level, and (b) positive contact level. ... 119
Figure 50: Permanent mold cast produced according to ASTM B108-08 (2008)... 122
Figure 51: (a) 1.0 engine head supplied by General Motors Brazil and (b) cutting process employed to obtain specimens. ... 122
Figure 52: Machined, polished, and painted specimens. ... 123
Figure 53: Testing system showing induction furnace and MTS 810 servo-hydraulic equipment. ... 125
Figure 54: System of grips, infrared pyrometer, and extensometer for fatigue testing.. ... 126
Figure 56: Anisothermal fatigue testing system. ... 127 Figure 57: Tensile test specimen for different temperatures. ... 128 Figure 58: Geometry of fatigue test specimens. ... 129 Figure 59: Anisothermal hystereses obtained between 600°C and 900°C for IN738LC alloy. ... 130 Figure 60: Cycle formats usually employed in thermo-mechanical fatigue tests. ... 130 Figure 61: Scanning electron microscopy (SEM) image of fractured surface of a fatigue crack
propagation test specimen. ... 135 Figure 62: Analysis of chemical composition via EDX in specimen tested at 120°C for areas
of (a) 25mm2 and (b and c) 900µm2in the regions of crack propagation and brittle fracture. ... 136 Figure 63: Analysis of chemical composition via EDX in specimen tested at 120°C for areas
of (a) 25mm2 and (b and c) 900µm2 in the regions of crack propagation and brittle fracture. ... 137 Figure 64: Analysis of chemical composition via EDX in specimen tested at 280°C for areas
of (a) 25mm2 and (b and c) 900µm2 in the regions of crack propagation and brittle fracture. ... 138 Figure 65: Optical micrographs of the alloy showing (a) well refined dendrite microstructure
and (b) coalesced silica particles that constitute the inter-dendrite eutectic (dark grey indicated by full arrow) and Fe2Si2Al9-type precipitates (dotted arrow)... 140
Figure 66: Metallographic analysis of specimens obtained from engine head transversally (a), (c), and (e) with corresponding images of casting voids (b), (d), and (f); and perpendicularly (g), (i), and (k) with corresponding images of casting voids (h), (j), and (l). ... 146 Figure 67: Detail of casting voids found in specimens obtained from the engine head,
transversally (a and b) and perpendicularly (c and d). ... 148 Figure 68: Fractographic analysis of the specimens submitted to (a) fatigue crack growth test
at 120ºC taken in the region of stable crack propagation and (b) ampliation of the same region, (c) thermomechanical fatigue test and (d) isothermal fatigue test at 280°C. ... 150 Figure 69: (a) Results of tensile tests conducted at 25°C, 120°C, and 280°C, (b) details of
estimation of Young’s modulus ( ), (c) yield stress at 0.2% ( ), and (d) rupture stress ( ). ... 153 Figure 70: Elasticity modulus vs. temperature for permanent mold cast A356 alloy. ... 153 Figure 71: Curve of stress amplitude as a function of the number of reversals to fail for
permanent mold cast alloy at 120°C and 280°C. ... 154 Figure 72: Curve of strain amplitude as a function of the number of reversals to fail for
permanent mold cast alloy at 120°C and 280°C. ... 155 Figure 73: Hysteresis curve for isothermal fatigue tests at 120°C and total mechanical
deformation of (a) 0.3% and (b) 0.5%. ... 156 Figure 74: Hysteresis curve for isothermal fatigue tests at 280°C and 0.3% total mechanical
deformation. ... 157 Figure 75: Curves of (a) mechanical deformation amplitude and (b) stress as a function of the
number of reversals to failure. ... 158 Figure 76: Comparison between graphs of (a) mechanical deformation amplitude in relation to
the number of reversals to fail, (b) stress amplitude as a function of the number of reversals to fail, and (c) hysteresis related to isothermal and anisothermal tests for 0.3% total mechanical deformation. ... 161 Figure 77: Chart of signal of perfectly adjusted command and response. ... 162 Figure 78: Relaxation test hystereses for total deformations of 0.1%, 0.3%, 0.5%, 0.7%, and
0.9% at (a) 80°C, (b) 100°C, (c) 120°C, (d) 140°C, (e) 180°C, and (f) 280°C. ... 165 Figure 79: Stress vs. time curves for a constant deformation level of 0.5% at 100°C, 180°C,
Figure 80: Fracture surface of a specimen tested for fatigue crack propagation and (a) criteria employed to define the points and , and (b) and (c) calibration curves. ... 168 Figure 81: Graph of crack propagation ( ) as a function of stress intensity factor ( ) at
75°C under sinusoidal wave loading. ... 169 Figure 82: Graph of crack propagation ( ) as a function of stress intensity factor variation
( ) at 120°C and under sinusoidal and trapezoidal wave loadings... 170 Figure 83: Graph of crack propagation ( ) as a function of stress intensity factor variation
( ) at 200°C and under sinusoidal and trapezoidal wave loadings. ... 171 Figure 84: Graph of crack propagation ( ) as a function of stress intensity factor variation
( ) at 280°C and under sinusoidal and trapezoidal wave loadings. ... 172 Figure 85: Comparative graph of displacement and strength in relation to time for a cycle,
corresponding to crack growth tests under trapezoidal wave loading and (a) constant load and (b) constant displacement. ... 173 Figure 86: Graph of crack length as a function of the number of cycles for crack propagation
tests under trapezoidal wave loading and (a) load control and (b) displacement control. ... 175 Figure 87: Comparative graph of crack propagation ( ) as a function of stress intensity
factor variation ( ) at 75°C, 120°C, 200°C, and 280°C and under sinusoidal wave and dwell loadings. ... 176 Figure 88: Displacement vs. time graph for a crack propagation test at 120°C under dwell
loading. ... 177 Figure 89: Shows the example of tow edge dislocations pinned at two obstacles. Dislocation 1
has to absorb vacancies to climb and dislocation 2 needs to emit them. Pile-up of dislocation at obstacles and vacancy diffusion. Dislocation 1 is a vacancy sink, dislocation 2 a vacancy source. (Roesler 2007) ... 179 Figure 90: Deformation mechanism maps. The grain size is 32µm in both cases. (Roesler
2007) ... 179 Figure 91: SEM analysis from a specimen tested by fatigue at 120ºC, dwell cycle in load
control: (a) notch and stable crack growth region, (b) detail of the stable crack growth region at 120ºC and (c) final fracture; (d) is SEM analysis from a specimen tested by fatigue at 120ºC, sinusoidal wave shape in load control (10 Hz frequency) and (e) detail of (d). ... 182 Figure 92: SEM analysis from a specimen fatigue tested at 200ºC, sinusoidal wave shape, 10
Hz frequency): (a) region of stable crack growth, (b) detail of (a), (c) fatigue striations and (d) cast defect on fracture surface. ... 184 Figure 93: SEM analysis from a specimen fatigue tested at 280ºC, dwell cycle in load control:
(a) notch and stable crack growth region, (b), (c), (d) and (e) detail of the stable crack growth region at 280ºC. ... 187 Figure 94: SEM analysis from a specimen fatigue tested at 280ºC, dwell cycle in displacement
control: (a) notch and stable crack growth region, (b), (c), (d) and (e) detail of the stable crack growth region at 280ºC. ... 191 Figure 95: Photograph of specimen used for fatigue crack propagation testing showing (a) the
region of the notch and pre-crack at room temperature and (b) tentative tests under anisothermal loading. ... 192 Figure 96: Modeling results of strain specimen at room temperature in terms of (a)
displacement, (b) deformation, and (c) Von Mises stress. ... 194 Figure 97: Von Mises stress results of modeling on useful region of strain specimen at room
temperature. ... 195 Figure 98: Tensile tests at 25°C: (a) loading as a function of total strain and 0.2 yield point;
(b) comparison between experimental and computational curves for elastic region. .... 196 Figure 99: Tensile tests at 120°C: (a) loading as a function of total strain and 0.2 yield point;
Figure 100: Tensile tests at 280°C: (a) loading as a function of total strain and 0.2 yield point; (b) comparison between experimental and computational curves for elastic region. .... 196 Figure 101: Tensile tests at 25°C: (a) loading as a function of total strain and yield point taken
at end of tangent to elastic region of curve; (b) comparison between experimental and computational curves for elastic region. ... 197 Figure 102: Tensile tests at 120°C: (a) loading as a function of total strain and yield point
taken at end of tangent to elastic region of curve; (b) comparison between experimental and computational curves for elastic region. ... 197 Figure 103: Tensile tests at 280°C: (a) loading as a function of total strain and yield point
taken at end of tangent to elastic region of curve; (b) comparison between experimental and computational curves for elastic region. ... 198 Figure 104: Comparison between computational and experimental tensile test curves. ... 198 Figure 105: Axisymmetric model employed to identify the behavior law parameters of the
material in question: (a) and (b) boundary conditions; and (c) Finite Element mesh .... 200 Figure 106: Experimental hysteresis curves for isothermal fatigue tests at 120°C and total
mechanical deformation of 0.3% and its corresponding computational hysteresis curve from ABAQUS. ... 201 Figure 107: Experimental hysteresis curves for isothermal fatigue tests at 280°C and total
mechanical deformation of 0.3% and its corresponding computational hysteresis curve from ABAQUS. ... 202 Figure 108: Experimental hysteresis curves for anisothermal fatigue tests between 120 and
280°C and total mechanical deformation of 0.3% and its corresponding computational hysteresis curve from ABAQUS. ... 202 Figure 109: Relaxation test hystereses for total deformations of 0.1%, 0.3%, 0.5% and 0.7% at
180°C and its corresponding computational hysteresis curve from ABAQUS. ... 203 Figure 110: Finite Element calculation performed to identify plastic blunting law parameters. ... 204 Figure 111: Identification of parameters , , , and . ... 204 Figure 112: Identification of parameters , , , and . ... 205 Figure 113: Graph of crack propagation ( ) as a function of stress intensity factor
LIST OF TABLES
Table 1: Most important aluminum alloys. ... 31
Table 2: Alloying elements and their effects. ... 32
Table 3: Components used at high temperatures. ... 59
Table 4: Numerical parameter for Paris equation. ... 91
Table 5: Nominal chemical composition of the aluminum-silica alloy under study. ... 121
Table 6: Results of chemical analysis through spectrometry (% in weight). ... 134
Table 7: Results of chemical analysis via EDX (% in weight). ... 138
Table 8: Quantitative analysis of material porosity. ... 140
Table 9: Behavior Law parameters of material under study. ... 201
LIST OF SYMBOLS
= fractions of creep damage. = fractions of fatigue damage.
= elastic deformation amplitude
= plastic deformation amplitude
= stress amplitude
= total deformation amplitude
= number of reverse to failure = grain size
= average particle size
= fraction by volume of cavity-nucleating particles at the grain boundary = 2nd stress tensor invariant
= elastic modulus tensor for plastic elements = elastic modulus tensor for elastic elements = solidification time
= elastic deformation
= elastic deformation tensor
= fatigue ductility coefficient
= creep strain
= mechanical strain
= plastic deformation
= thermal strain
= visco-plastic deformation tensor
= fatigue strength coefficient = material yield stress
= energy dissipated per cycle = compliance tensor
= number of reverse = fatigue ductility exponent = specific heat
= dendrite arm spacing = Young’s modulus
= strength modulus = Boltzmann’s constant
= thermal conductivity = viscosity exponent. = stress deviation tensor = Segregation Factor
= absolute temperature (K) = stress tensor (hardening) = plastic multiplier
= total strain = viscosity
= Poisson modulus = density
= stress
= atomic volume
= fatigue strength exponent
= average time for an applied average stress and is the time to fracture = amount of accumulated creep damage
= fraction of damage accumulated
= frequency into the Coffin-Manson relationship = plastic deformation in reverse strain-stress
= creep deformation in tensile and plastic deformation in compression
= plastic deformation in tension and creep in compression
= creep deformation in reverse tension-compression
= fatigue accumulated damage
= environmental attack (oxidation) accumulated damage
= creep accumulated damage = Total accumulated damage
= approximate slope of the hardening curve on a inelastic stress-strain graph
= Thermal gradient = crack growth rate = stress intensity factor
= plastic flow rate
= maximum stress intensity factor = opening stress intensity factor
INTRODUCTION
Many machines have several types of components subjected to variations in temperature or load during operation. The induced thermal gradient inside these components can promote internal stresses and strains and repeated thermal cycles may lead to crack nucleation and propagation by a process known as thermo-mechanical fatigue (TMF).
This process can be clearly seen in internal combustion engines. When this type of engine is started, the temperature of the head and valves increases rapidly at the same time that the nearby material, which is water cooled, restrains the thermal expansion of the material. As a result, there is an increase in thermal stress and significant plastic deformation may occur at high temperatures if it exceeds the elastic limit under compression of the material.
Moreover, upon cooling to room temperature, tensile stresses are created and may promote cracks and be conducive to component failure (Figure 1). Repeated engine startup-shutdown cycles can cause these components to undergo plastic deformation, leading to stress-strain hysteresis loops and, consequently, TMF. Therefore, the study of the material mechanical behavior and fracture mechanisms is vital to a proper engineering design of these components.
Materials employed in the making of automotive engine cylinder heads are often submitted to critical thermo-mechanical efforts. The development of new materials for the automotive industry has been hitherto based almost exclusively on laboratorial specimen testing. The financial cost and time expenditure involved in the process, from selection of materials to approval for serial production, are high, demanding a wide array of mechanical tests. From project planning to production, there is a series of stages before the component is approved.
For example, in the case of an engine cylinder head, some of these steps comprise dynamometer tests, whose cost is around R$ 140,000, durability tests (R$ 150,000), piloting it in some 300 vehicles, and so forth. Therefore, minor project faults may cause huge financial losses and waste of time, which can be minimized by computational simulation. Nowadays, there are several models that enable the accurate modeling of the behavior of many materials submitted to isothermal loading. However, only recently has intensive development of behavior laws under anisothermal conditions started. In some cases, isothermal models can be extrapolated for anisothermal solicitation, but some materials display interaction effects during the thermal cycle, which can alter their mechanical behavior and lead to non-conservative predictions of residual lifetime. In this context, it is fundamental to conduct anisothermal testing.
Another problem is the casting-related microstructural heterogeneity, which can give rise to different mechanical and physical properties in the same component. Finite elements analysis have been used to model casting processes as well as components under real-life operational conditions so as to build satisfactory predictive mathematical models capable of determining fatigue lifetime of components, thereby diminishing the cost of material selection and/or improvement. This study deals with this problem by investigating its influence on the component under loading conditions closest to those observed in real life. Therefore, investigating the mechanical behavior and developing constitutive equations for these materials are vital to better determine their residual lifetime and implement projects of components more effectively.
temperatures—particularly with diesel engines—between intake valves, the warmest areas of the head.
Although there are studies on the morphology and development of cast aluminum alloys, the literature is deficient with regard to cyclic mechanical behavior of these alloys under varying temperature conditions, such as those found in transmission housings and cylinder heads of engines.
Numerical simulation is a useful tool for solving equations that predict material behavior. The finite element method (FEM) has been developed and applied very satisfactorily. Basically, micro-structural features and thermal, mechanical and geometrical aspects should be incorporated into TMF process modeling. There are two approaches to understanding the TMF process: (1) by modeling crack initiation and propagation at the microscopic level, and (2) by taking into account the material macroscopic behavior.
CHAPTER 1: MATERIAL
1.1Metal Alloys in Molten State
Casting is defined as the process of manufacturing metal parts from the liquid state. After melting, the metal is poured into molds to obtain components with complex geometries and/or close to final measures, in order to avoid waste of raw material and excessive machining costs. It is the oldest manufacturing process in recorded history, known for thousands of years. Even today it is one of the most widely used processes because it is relatively simple and comparatively inexpensive, though it may require the control of a large number of variables.
The production of most metal components involves solidification, a cooling phenomenon during which liquid metal is transformed into finished solid objects or ingots, which are then processed by other forming means. Basically, the solidification process can be divided into nucleation and growth stages.
During nucleation, liquids present a disordered structure, in which atoms and molecules are in constant motion, with no fixed positions. As temperature drops, the total energy of atoms decreases thereby increasing the force of attraction among them. At a given point, a set of atoms may arrange themselves according to metal crystallographic rules in a small area of the liquid, forming a solid nucleus. The development process of stable nuclei requires that the system temperature be below the metal solidification point for the energy balance to promote its stabilization.
If the super-cooling level is not sufficient, the nucleus can become unstable and melt again. The process may repeat until the temperature is low enough for the formed nuclei to display a minimum curvature radius, one that results in an energetically stable structure, as shown schematically in Figure 2a. This process is known as homogeneous nucleation. In pure metals, the super-cooling temperature needed for stable nucleation to occur may be in the order of hundreds of degrees Celsius, e.g., development of stable nuclei in iron only occurs at approximately 300°C below its solidification temperature.
required for stabilization (Figure 2b). Most cases of inoculation during casting are based on the principle of heterogeneous nucleation, in which particles are intentionally introduced into the liquid in order to act as nucleation substrates. The result is a structure with fine particle size and better mechanical properties.
Figure 2: (a) Homogeneous nucleation and (b) heterogeneous nucleation (Milan, 2004). After being formed, nuclei tend to grow by accumulation of more solid matter around them. This growth may be planar or dendritic.
If the liquid beyond the solid/liquid interface is at a temperature above fusion, the development of protuberances is inhibited and there occurs planar growth of the crystal solid, as shown in Figure 3a. Latent solidification heat is removed by thermal conduction through the mold walls and, consequently, through the solid formed.
Dendritic growth is favored when the liquid is in a super-cooled state, i.e., at a temperature (Tl) below its melting point (Tf). In this case, the removal of latent heat needed
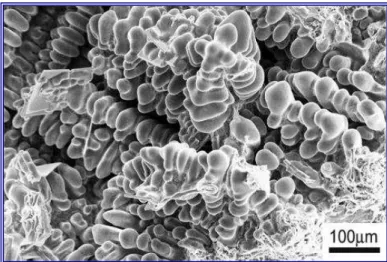
for solidification of the liquid occurs by heat transfer, from the interface area to the super-cooled liquid beyond. This mechanism favors the development of tree-shaped protuberances in the solid/liquid interface, called dendrites, as represented in Figure 3b. Development and growth of dendrites continue until super-cooling of the liquid continues or when they are blocked by the development/growth of other adjacent dendrites. Figure 4 shows the appearance of dendritic solidification on the fracture surface of an aluminum alloy with high silicon content.
rcrit
Solid-liquid interface
rcrit
Substrate
(a)
Liquid
Figure 3: Schematic representation of (a) planar growth and (b) dendritic growth (Milan, 2004).
Figure 4: Solidification dendrites of an aluminum alloy with high silicon content (Milan, 2004).
1.2Cast Aluminum Alloys
Pure aluminum is seldom used because its physic-chemical properties are poor. Nonetheless, its alloys are employed widely in automotive and aeronautical industry.
Aluminum alloys—due to their good mechanical properties and low specific weight—
have been increasingly employed in the production of molded parts, especially in place of iron alloys. The specific weight of aluminum is approximately one third that of iron. Another important aspect favoring the use of aluminum is related to its recycling, which allows an overall assessment of costs compatible to iron components.
The structure of aluminum alloys comprises solid solutions in the form of more or less complex (binary and tertiary) dendrites (hypo-eutectic) and inter-metallic liquid components.
Solid Liquid
Heat extraction
Tl > Tf
Solid Liquid
Heat extraction Tl < Tf
Growth
Growth
In the Al-Si system, solid crystals of aluminum are formed on the metal mold walls and grow inwardly. Its Si composition is lower than that of the liquid that surrounds it, because Si solubility in Al decreases with temperature. Therefore, silicon is forced out to the interface between the liquid and the surface of growing crystals, thus lowering the solidification temperature of the liquid in the region through cryoscopy (liquid state below its normal solidification temperature).
This phenomenon slows solidification of this layer, since it requires that an above normal amount of heat be removed for it to occur. But if growing crystal germs find liquid at a below solidification temperature, thereby consisting of a silicon-poor medium thermodynamically favorable to solidification, they keep on growing as dendrites.
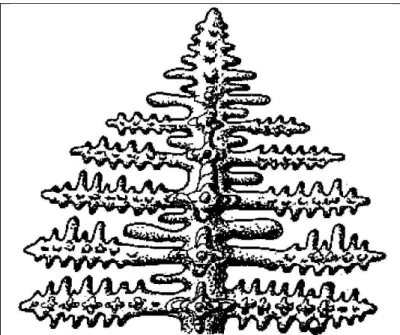
These initially unstable protuberances grow rapidly, which explains the fact that aluminum crystals develop into tree-like shapes (dendrites) instead of spheres or needles (Figure 5). Secondary arms are dozens of micrometers apart. This distance between dendrite arms is known as dendrite arm spacing (DAS) or secondary dendrite arm spacing (SDAS).
(a) (b)
Figure 6: (a) Principle of competitive growth leading to a lamellar eutectic, and (b) schematic representation of a lamellar eutectic (Barralis J., Maeder G., 1997).
For instance, in heads of diesel engines, SDAS typically varies from 20μm inside the component to about 100μm in areas at lower temperatures. The grain size in cast aluminum alloys is generally in the order of millimeters and, therefore, well above the size of a dendrite. The mechanical properties of cast aluminum alloys strongly depend on micro-structural parameters; there are numerous studies that examine this dependence.
The acquisition of a given mechanical property also depends on the casting method employed (e.g., sand mold, permanent mold, lost-wax, and die casting). In fact, permanent mold casting promotes fast cooling, which provides the component with a thinner metallic structure (i.e., low SDAS) and higher tensile strength and elongation values as compared to those of the same alloy cast in sand, for instance. However, sand mold casting is easy to implement and prototypes can be quickly built in order to validate geometry, power, cooling, and so forth (except product life). It has been observed that low SDAS improves life under fatigue. According to empirical law, the shorter the solidification time ( ), the lower is SDAS (fast cooling):
(1)
Solidification in the mold occurs on its walls first and progresses toward the center until the entire component is solid. This induces a gradient of microstructure and, consequently, properties. The literature also indicates the existence of a larger amount of pores and eutectic phase in the center, influenced by a lower cooling rate (Equation 1), which together with higher SDAS, leads to a shorter life under fatigue of specimens taken from this region as compared to those taken from outer regions, where cooling rates are higher.
Besides the influence of the casting method employed, it is also possible to alter the properties of alloys by adding different elements to them. Thus, cast aluminum alloys constitute several families of materials whose chemical composition depends on the relationship between casting requirements (e.g., flowability, machinability, shrinkage) and the way the component will be used (e.g., mechanical properties, surface appearance, and corrosion strength).
Aluminum alloys employed in casting are classified according to their main alloying elements. The most common of these classifications is that established by the Aluminum Association and adopted by other standards bodies (e.g., ASTM and SAE). According to this classification, the most important families are:
a) 1xx.x – pure aluminum alloys; b) 2xx.x – aluminum-copper alloys;
c) 3xx.x – aluminum-silicon alloys (with addition of magnesium and/or copper); d) 4xx.x – aluminum-silicon alloys;
e) 5xx.x – aluminum-magnesium alloys;
f) 7xx.x – aluminum-zinc alloys (with addition of magnesium, copper, chromium, manganese or combinations of the same);
g) 8xx.x – aluminum-tin alloys.
The last digit (after the dot) is employed to describe the nature of the alloy. Therefore,
the digit ―0‖ indicates the chemical composition limits; ―1‖ and ―2‖ represent cast
components and ingots with pre-adjusted composition, respectively.
Alloys from 3xx.x and 4xx.x families are the most important, commercially, because of their mechanical, corrosion, and casting properties. Alloys belonging to families with silicon as their main alloying component represent over 90% of all cast products.
The other families of alloys display low castability levels, but with specific advantages such as: high mechanical properties (2xx), corrosion strength (5xx) or machinability (5xx, 7xx, and 8xx).
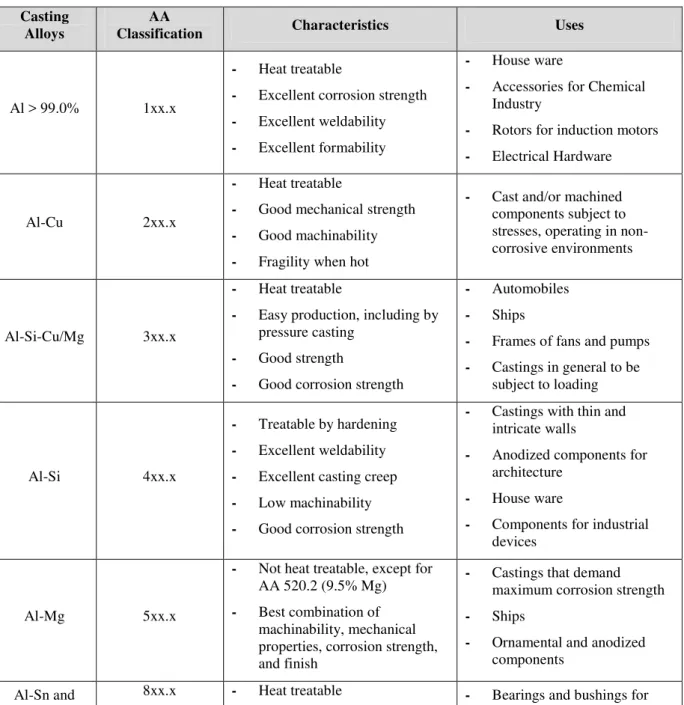
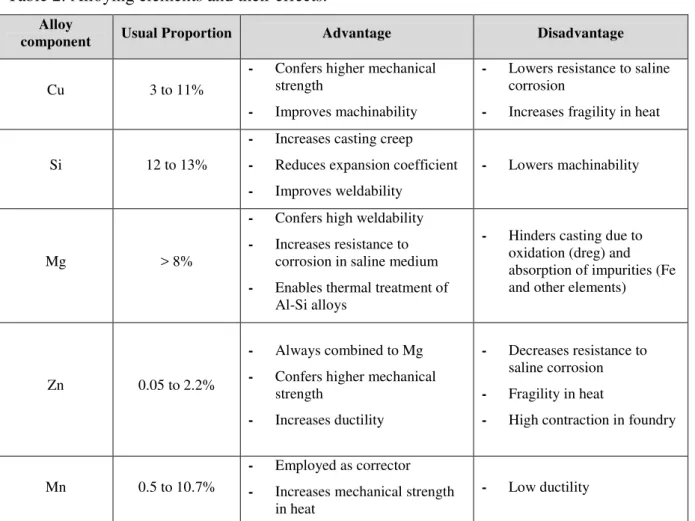
Table 1 shows an overview of the series of most used aluminum alloys, along with their classification given by the AA (Aluminum Association), characteristics, and uses. Table 2 presents some alloying elements and their effects.
Table 1: Most important aluminum alloys. Casting
Alloys Classification AA Characteristics Uses
Al > 99.0% 1xx.x
- Heat treatable
- Excellent corrosion strength - Excellent weldability - Excellent formability
- House ware
- Accessories for Chemical Industry
- Rotors for induction motors - Electrical Hardware
Al-Cu 2xx.x
- Heat treatable
- Good mechanical strength - Good machinability - Fragility when hot
- Cast and/or machined components subject to stresses, operating in non-corrosive environments
Al-Si-Cu/Mg 3xx.x
- Heat treatable
- Easy production, including by pressure casting
- Good strength
- Good corrosion strength
- Automobiles - Ships
- Frames of fans and pumps - Castings in general to be
subject to loading
Al-Si 4xx.x
- Treatable by hardening - Excellent weldability - Excellent casting creep - Low machinability - Good corrosion strength
- Castings with thin and intricate walls
- Anodized components for architecture
- House ware
- Components for industrial devices
Al-Mg 5xx.x
- Not heat treatable, except for AA 520.2 (9.5% Mg) - Best combination of
machinability, mechanical properties, corrosion strength, and finish
- Castings that demand maximum corrosion strength - Ships
- Ornamental and anodized components
other elements
- Excellent resistance to corrosion by lubricating oils - Good resistance to fatigue
axes of trucks and laminators
Table 2: Alloying elements and their effects. Alloy
component Usual Proportion Advantage Disadvantage
Cu 3 to 11%
- Confers higher mechanical strength
- Improves machinability
- Lowers resistance to saline corrosion
- Increases fragility in heat
Si 12 to 13%
- Increases casting creep - Reduces expansion coefficient - Improves weldability
- Lowers machinability
Mg > 8%
- Confers high weldability - Increases resistance to
corrosion in saline medium - Enables thermal treatment of
Al-Si alloys
- Hinders casting due to oxidation (dreg) and absorption of impurities (Fe and other elements)
Zn 0.05 to 2.2%
- Always combined to Mg - Confers higher mechanical
strength
- Increases ductility
- Decreases resistance to saline corrosion - Fragility in heat
- High contraction in foundry
Mn 0.5 to 10.7%
- Employed as corrector - Increases mechanical strength
in heat
- Low ductility
1.3Aluminum-Silicon 300 Series
These are aluminum alloys that display the best casting characteristics, which is why about 90% of aluminum castings belong to the 300 series. Binary alloys have excellent ductility, corrosion strength, and good tensile strength. Si increases creep, reduces shrinkage, and improves weldability. However, high levels of Si hinder machining.
Cu addition to Al-Si alloys improves machinability and increases mechanical strength, but reduces ductility. Mg addition allows alloys to be hardened by heat treatment thereby increasing their mechanical strength.
Hypereutectic alloys (up to 13% silicon) are known for their high wear strength, low thermal expansion coefficient, and high thermal conductivity.
Hetke and Gundlach (1994) sustain that the aluminum-silicon-magnesium alloy is among the easiest to cast irrespective of the casting technique employed. Its main features are good mechanical strength, high corrosion strength, heat treatability, and weldability, according to ASTM B108-97 (1997). This alloy is commonly used in the annealed condition and artificially aged, heat treatment T6. However, for casts with greater dimensional stability, it can be used in the solubilized and over-aged condition, T7, resulting in an increase in ductility with a slight reduction in strength as compared to T6, according to Byczynski et al. (1996).
During solubilization, magnesium is dissolved into the aluminum matrix after quenching and subsequent aging at intermediate temperatures (between 150°C and 200°C); the Mg2Si phase precipitates in the aluminum matrix in the form of finely dispersed particles,
which causes a substantial increase in strength, according to Wang and Cáceres (1997), Lee et al. (1998), and Zhang (1996).
Strength and fracture toughness of the metal matrix can be controlled by varying the temperature and aging time. In general, strength is inversely related to ductility and toughness. However, toughness can be increased through heat treatment, to the detriment of strength.
Hetke and Gundlach (1994) claim that when the metallurgical quality of castings lowers, both strength and toughness decrease. Whenever high toughness values are required, there are three ways of achieving these characteristics:
1. By performing the sub-aging treatment; 2. By softening via over-aging treatment; 3. By improving the quality of the cast.
The main applications involve general-use components, intake manifolds, cylinder engine blocks and heads, automotive and wheel pistons, structural aerospace components, fuel and water pumps, and housing and suspension components.
1.3.1 Silicon Modifiers
The vast majority of cast components in aluminum alloys employ Al-Si alloys. It happens that the raw microstructure of these cast alloys features Si particles with acicular morphology, which is detrimental to ductility (Figure 7). Then, it is necessary to modify this morphology in order to obtain high strength and ductility.
The modification consists of an aluminum-silicon bath treatment by adding agents that modify Si-morphology. The most commonly used modifiers are: Na (sodium), Sr (strontium), Ca (calcium), and Sb (antimonium).
Additions of these elements (generally between 0.005% and 0.02% in weight) promote major changes in the growth of the phase (silicon) of the eutectic, which begins to display a more refined morphology, thus increasing the ductility of Al-Si alloy casts.
Figure 7: Morphological modifications in Si particles.
Sodium and strontium are employed commercially as effective eutectic modifiers. These elements, when added in appropriate amounts, refine and change the morphology of the
β phase of the eutectic from acicular or coarse lamellar to fibrous. This morphological change
promotes substantial improvement in mechanical properties, especially ductility.
Modification with strontium is accomplished through the addition of strontium (Sr) in metal form of as Al-Sr pre-alloys. In general, additions are in the order of 0.02% Sr, which requires a 15-minute incubation time for bathing with little agitation.
Modification with sodium is done by adding metal sodium or fluxes containing this element. Sodium is a more efficient modifier than strontium, providing better modification degrees. However, due to a greater tendency to vaporize, its modifying effect is lost faster than that of strontium. In Na-modified baths, the modifying effect remains for about 30 minutes. In the case of Sr, the effect lasts more than two hours. Another negative aspect of Na is the damage it causes to melting crucibles.
concentrators and weakness planes that promote crack propagation, according to Wang and Cáceres (1998) and Digho and Gokhale (1997).
The degree of silicon modification may vary from weak refinement, resulting in silicon platelets, to a thorough change, resulting in refined silicon fibers. According to Hetke and Gundlach (1994), the amount of Sr or Na required to promote thorough modification is strongly correlated with the solidification rate. The higher the cooling rate, the smaller is the required amount of modifiers. At low solidification rates, the required amount of modifiers is much greater. It may be very difficult to alter some larger sections of castings. However, high solidification rates promote high modification degrees and, consequently, improve mechanical properties.
Na and Sr are mutually compatible so it is possible to use both simultaneously, causing no problems due to scrap contamination.
As compared to non-modified alloys, the alloys treated with sodium and strontium show higher tendency to micro-porosity and lower propensity to macro-shrinkages in the thicker areas of the components.
Technologically speaking, this feature of modified alloys allows the production of parts with less need for hot top. At the same time, it is virtually impossible to eliminate micro-porosity formed in all component sections. Modified cast alloys with sodium or strontium should not be used when micro-porosity is not tolerated. In these applications, the use of unmodified alloys promotes to healthier parts. On the other hand, it requires feeding (hot top) in all thick areas where macro-shrinkages concentrate.
An alternative to modification with sodium or strontium is that with antimonium. When this treatment is employed, the phase morphology remains lamellar, undergoing just one refinement, which is enough to develop components with higher degree of reliability than that obtained in non-modified alloys.
Antimonium is widely used in Japan and parts of Europe. Strontium and, to a lesser extent, sodium are commonly used in the United States, Canada, parts of Europe, and Brazil. Calcium has, even today, little commercial application as a modifier.
1.3.2 Non-Metallic Inclusions
Inclusions are foreign materials present in aluminum that can compromise its physical and chemical characteristics, such as reducing its mechanical and corrosion strength, as well as cause quality problems in the final product. There has been a constant search for understanding their origin and means to detect and control them.
Molten aluminum alloys contain highly reactive metals and oxidation of the molten metal is fast. Even in a protective atmosphere, a metal can initiate the process of oxidation. Very large oxide inclusions are not readily wet by the molten alloy and act as discontinuities, which drastically reduces mechanical strength and ductility. Furthermore, they can greatly reduce fatigue resistance, shortening the component life.
According to Crepeau (1998), various kinds of insoluble sludge can develop in molten aluminum alloys at high concentrations of certain impurities. This sludge can gather in the liquid pool and later contribute to defects arising in the cast. Over time, it attaches to the crucible bottom. Both oxides and sludge must be removed by having the liquid metal filtered before it enters the mold cavity.
1.3.3 Inter-Metallic Phases
In furnaces operating at low temperatures in which aluminum is not subjected to agitation, alloying elements, such as iron, chromium, manganese, and copper, precipitate and thus form a mud or sand at the bottom of the furnace or crucible. Under favorable conditions, these alloying elements, which by nature present high density, have their solubility limits diminished and thus accumulate at the bottom of the furnace, forming high-density/hardness compounds. Their development is predictable as it derives from the percentile participation of these alloying elements in aluminum, determined by a so-called Segregation Factor, which is calculated as follows:
(2)
Figure 8: Segregation Factor
Without adequate control, the impurity content may rise to undesirable levels, resulting in the development of inter-metallic phases, which precipitate in inter-dendritic regions and around grains. These phases usually give rise to acicular platelets or inter-dendritic eutectic lattices, which can reduce matrix continuity. As a result, these hard particles act as stress raisers, propitiating crack development and decreasing fracture toughness, according to Verdu et al. (1996), and fatigue strength, according to Madelaine-Dupuich and Stolarz (1996).
Hetke and Gundlach (1994) sustain that iron and copper are major impurities in Al-Si alloys. Iron is particularly damaging because of development of acicular platelets, which significantly reduce ductility and fracture toughness. The size of acicular particles and, consequently, their influence on ductility are also affected by the solidification rate. When balanced with magnesium, iron forms a more compact eutectic phase, i.e., Al15(Fe,Mn)3Si2,
shaped as ―chinese writing‖, less detrimental to mechanical properties, as indicated by Crepeau (1998).
beryllium to aluminum-silicon alloys with the intention of nullifying the harmful effect of iron on mechanical properties. Figure 9 shows the influence of iron content, solidification rate, and SDAS (secondary dendrite arm spacing) on fracture toughness, ductility, and silicon particle size of the phase in a aluminum alloy (Al-7Si-0.4Mg).
1.3.4 Grain Refinement and Porosity
Porosity in aluminum alloys is responsible for decrease in mechanical strength and occurrence of cracks and thus constitutes an important problem. According to Hetke and Gundlach (1994) and Anson and Gruzleski (1999), two varieties of micro-porosity can occur in aluminum castings: porosity resulting from gas (hydrogen) and porosity deriving from micro-contraction due to solidification.
Porosity caused by gas can be controlled through the level of hydrogen dissolved in the liquid metal. Hydrogen gas is highly soluble in liquid aluminum; the higher the temperature, the more hydrogen is dissolved in aluminum. During solidification, the amount of hydrogen dissolved in aluminum in equilibrium certainly diminishes; high cooling speed causes hydrogen to saturate in the metal, because the gas does not have enough time to leave and is thus trapped, giving rise to porosity especially in thicker areas where solidification last occurs. This porosity, usually oblong and bright, compromises the product mechanical properties and sealing, making it unfit for use.
Hydrogen contaminates liquid aluminum, especially by adding solid furnace loads contaminated with oil and residues from fusion furnaces. These residues, upon decomposition, release oxygen (which reacts with aluminum to form oxides), carbon-enrich gases or fumes, and the hydrogen is immediately incorporated into the liquid metal.
Relative humidity also contributes to aluminum contamination on the surface where oxidation and hydrogen absorption occur; liquid aluminum reacts with air moisture: . This gaseous hydrogen is partly dissolved into liquid aluminum in atomic form. During solidification, hydrogen becomes less soluble and recombines, is driven out of the solid phase to the liquid phase, which becomes rich in gas, creating bubbles that get trapped in the solid.
Most foundries degasify their baths with great care to minimize gas-related porosity. If control is not exercised, gas porosity can easily exceed 4% in volume, seriously degrading mechanical properties of castings. Another type of porosity caused by gas derives from turbulent feeding, resulting in elongated pores, as stated by Medeiros (1999).
Porosity caused by solidification micro-contractions occurs because aluminum
contracts and silicon expands during solidification, which is conducive to a theoretical