modelling system: model development and evaluation of global
aerosol climatology
S. L. Gong1,2, D. Lavou´e1,3, T. L. Zhao1, P. Huang1, and J. W. Kaminski4
1Air Quality Research Division, Science & Technology Branch, Environment Canada, 4905 Dufferin Street, Toronto,
Ontario M3H 5T4, Canada
2Chinese Academy of Meteorological Sciences, China Meteorological Administration (CMA), Beijing 100081, China 3DL Modeling & Research, Brampton, Ontario, Canada
4Department of Earth and Space Science and Engineering, York University, 4700 Keele Street, Toronto,
Ontario, M3J 1P3, Canada
Correspondence to:S. L. Gong ([email protected])
Received: 1 December 2011 – Published in Atmos. Chem. Phys. Discuss.: 11 April 2012 Revised: 10 August 2012 – Accepted: 21 August 2012 – Published: 13 September 2012
Abstract. A global air quality modeling system GEM-AQ/EC was developed by implementing tropospheric chem-istry and aerosol processes on-line into the Global Environ-mental Multiscale weather prediction model – GEM. Due to the multi-scale features of the GEM, the integrated model, GEM-AQ/EC, is able to investigate chemical weather at scales from global to urban domains. The current chemical mechanism is comprised of 50 gas-phase species, 116 chem-ical and 19 photolysis reactions, and is complemented by a sectional aerosol module CAM (The Canadian Aerosol Mod-ule) with 5 aerosols types: sulphate, black carbon, organic carbon, sea-salt and soil dust. Monthly emission inventories of black carbon and organic carbon from boreal and temper-ate vegetation fires were assembled using the most reliable areas burned datasets by countries, from statistical databases and derived from remote sensing products of 1995–2004. The model was run for ten years from from 1995–2004 with re-analyzed meteorology on a global uniform 1° × 1° hori-zontal resolution domain and 28 hybrid levels extending up to 10 hPa. The simulating results were compared with various observations including surface network around the globe and satellite data. Regional features of global aerosols are rea-sonably captured including emission, surface concentrations and aerosol optical depth. For various types of aerosols, sat-isfactory correlations were achieved between modeled and observed with some degree of systematic bias possibly due
to large uncertainties in the emissions used in this study. A global distribution of natural aerosol contributions to the to-tal aerosols is obtained and compared with observations.
1 Introduction
East Asia contribute about 15 % of global sulphate and 30 % of global black carbon (BC) pollution loads; Europe and North America each contribute about 5 % of global BC and sulphate pollution loads (Koch et al., 2007). A recent assess-ment by the Task Force on Hemispheric Transport of Air Pollutants (TF HTAP) has found that anthropogenic emis-sions from one continent could contribute to the background levels of smog and PM in another continent (HTAP, 2010). The impact levels of smog and PM by the intercontinental transport varies depending the species and variability of the general circulation (Fiore et al., 2009; Reddy and Boucher, 2007; Liu et al., 2008).
Five major aerosol types are generally considered as the sources of particulate emissions in the atmosphere: sea salt (SS), mineral or soil dust (SD), black carbon (BC), par-ticulate organic matter (POM), and sulfate (SU) (Textor et al., 2006). Aerosols affect directly and indirectly Earth’s ra-diative balance. SS, SU, and POM tend to cool the atmo-sphere by reflecting light from the sun. SD scatters and partly absorbs solar radiation, depending on the particle size and chemical compositions. On the other hand, BC absorbs solar radiation and warms the atmosphere. The overall radiative impact of atmospheric aerosols is difficult to assess and is highly variable at regional scale (Penner et al., 2001; Kauf-man et al., 2002). Recently, BC has been identified as an im-portant contributor to radiative warming at global scale, and more particularly in the Arctic (Flanner et al., 2007). In addi-tion, BC deposited on snow and ice reduces their albedo and can accelerate the melting. BC is currently the focus of many international studies to examine the effect of mitigating an-thropogenic emission sources of the aerosol on both climate and air quality (Kandlikar et al., 2009; Jacobson, 2010; Baron et al., 2009; Governing Council of the United Nations Envi-ronment Programme, 2011).
The issue of the inter-annual variability in both natural aerosol emissions and intercontinental transport has not been fully addressed in previous aerosol modeling works. For instance, during the international AeroCom (Aerosol inter-Comparison) experiment (Dentener et al., 2006) the aerosol emission inventories of both anthropogenic and natural ori-gins for the year 2000 were collected from published inven-tories and simulations, in order to provide the harmonized global aerosol emission inputs to over 15 transport models. Similarly, the HTAP project aims to study the hemispheric and intercontinental transport of specific air pollutants in-cluding aerosols for the year 2001 only.
To adequately address this issue, the inter-annual varia-tions in the emissions of various aerosols as well as in the transport patterns need to be addressed. The goal of the present study is two folds: (1) to develop a comprehensive emission inventory of natural aerosols for ten consecutive years from 1995 through 2004, and hence to investigate the inter-annual variability and seasonal cycle of SS, SD, BC, or POM emissions at continental and global scales, and (2)
to evaluate the newly developed global air quality forecast model GEM-AQ/EC that uses the emissions.
Finally, a ten-year run using GEM-AQ/EC was performed to investigate global aerosol budgets and to capture the vari-ability of the transboundary and intercontinental transport patterns. The ability of the model to simulate seasonal and inter-annual variations and regional distributions of the dif-ferent aerosol components was validated with various sur-face station measurements and observations from satellites. Results from this study are presented in this paper and the companion paper published in the same journal issue (Zhao et al., 2012) focusing on the annual variability of inter-continental transports of air pollutants and the meteorologi-cal influences.
2 GEM-AQ/EC description
Based upon the Canadian operational weather forecast model GEM (Global Environmental Mutilscale model) (Cˆot´e et al., 1998) and augmented by implementing tropospheric gas phase chemistry (Venkatram et al., 1988) and aerosols (Gong et al., 2003a), an on-line multiscale chemical weather mod-elling system GEM-AQ was developed to address the impact of aerosols and other pollutants on global air quality (Kamin-ski et al., 2008). The model GEM, as the host meteorologi-cal model for the on-line implementation of air quality pro-cesses could be run in global uniform, global variable and limited area configurations for modelling chemical weather at scales from global to urban domains. A full description of the model structure and evaluation of gas phase chem-istry processes has been given by Kaminski et al. (2008). GEM-AQ is one of the models that contributed to the HTAP assessment. GEM-AQ/EC was enhanced from the original GEM-AQ model by adding more aerosol processes and new emissions as described below.
2.1 Aerosol processes
types of aerosols in GEM-AQ/EC is computed to enable the computation of the spatiotemporal distribution of aerosol optical characteristics, assessing model performance against observations, and interactively modeling the aerosol direct radiative effects (Ayash et al., 2008).
2.2 Natural aerosol emissions
The natural aerosols included in GEM-AQ/EC are sea salt produced from open oceans (Gong, 2003) and soil dust emit-ted from deserts (Marticorena and Bergametti, 1995; F´ecan et al., 1999; Gong et al., 2003b). The sea salt and soil dust emissions are on-line calculated from the simulated meteo-rology in the GEM. The other natural emissions are carbona-ceous aerosol emissions from boreal and temperate vegeta-tion fires.
A Geographic Information System (GIS) application was developed to construct multi-year emission inventories for BC and POM from boreal and temperate vegetation fires. Vegetation fire emissions were calculated from the product of three components: vegetation fuel consumption values, emission factors, and areas burned data (Seiler and Crutzen, 1980). Fuel consumption and emission factors were previ-ously described in (Lavou´e et al., 2000). At a given loca-tion, the fuel consumption was set to be constant for the whole study period in all regions, except in Canada. Monthly area burned datasets were created using a composite ap-proach combining fire statistics reported by countries and fire hotspots and scars detected by satellite. Vectorized poly-gons of burn scars available in some regions were converted into areas burned per grid cell. Next, monthly seasonality was inferred from official fire reports. However, if this informa-tion was not available, seasonal variability was introduced by scaling the emissions with MODIS (Moderate Resolution Imaging Spectroradiometer) Active Fires (USDA Forest Ser-vice, http://activefiremaps.fs.fed.us/) and ATSR (Along Track Scanning Radiometer) World Fire Atlas (European Space Agency, http://due.esrin.esa.int/wfa/) products. Both space-based sensors provide fire hotspot counts, which can be used as proxy data for assessing fire activity on a monthly ba-sis. This method was detailed and validated in earlier stud-ies (Generoso et al., 2003; Schultz, 2002). It is worthwhile noticing that no satellite hotspot was used to derive annual areas burned in the present study. Also, as pointed out in ear-lier biomass burning studies (Schultz, 2002), examining fire
thropogenic biomass burning during 1995–2004 were limited at the start of the present study (mid-2000s). Emissions from Liousse et al. (1996) based on 1991 Food and Agriculture Or-ganization production data for tropical forest fires, savannah fires, and biofuel burning were then set to be constant for the ten years of simulations with GEM-AQ/EC. Climatological emissions representative of the end of 1980’s were consid-ered for the tropical forest fires and savannah fires (Liousse et al., 1996). The vast majority of these fires are intention-ally set fires for land conversion, timber harvesting, slash-and-burn agriculture, and other socio-economic reasons. Bio-fuel burning adds up to a large contribution to the global emissions of carbonaceous particles. Sources include agri-cultural waste burning, residential cooking worldwide, burn-ing of charcoal and dung, and charcoal makburn-ing. A distinct seasonality to the emissions was applied accordingly to the hemisphere where they occur. The original 4.4◦× 7.5◦
inven-tory was interpolated onto a 1◦× 1◦grid and a land-sea mask
was applied to constrain emission fluxes to the land surface only.
Global emissions for BC and POM from fossil fuel com-bustion (Table 2) were calculated by applying the method de-veloped by Cooke et al. (1999) and the United Nations fuel database (United Nations, 2007) for the years 1990–2005. This database provides consumption and transaction figures of 23 different fuel types (e.g. hard coal, lignite brown, diesel...) on an annual basis for more than 200 countries worldwide. For every country, a specific emission factor was applied to each fuel type consumed. Their values account for the level of development reached by the country. Emission factors are the same as the ones proposed initially by Cooke et al. (1999). BC emission inventories constructed with this technique were previously used to investigate transport path-ways to the Arctic (Sharma et al., 2004) and to determine the relative contributions of circumpolar continental sources to the winter/spring Arctic Haze phenomenon (Gong et al., 2010).
The global sulphur emissions, including SO2, DMS and
Table 1.Literature references and web sites visited to get areas burned by countries in different geographical areas between 1995 and 2004.
Geographical areas Literature references and web sites for areas burned (1995–2004)
Canada Stocks et al., (2003), http://cwfis.cfs.nrcan.gc.ca/en CA/lfdb, Lavou´e and Stocks (2011)
Contiguous United States http://iys.cidi.org/wildfire/firearch.htm
Alaska http://agdc.usgs.gov/data/blm/fire/
Mexico http://www.conafor.gob.mx/portal/index.php/temas-forestales/incendios
Eastern Europe European Commission (2005, 2006); UN/ECE Timber Bulletin (2002)
Bulgaria, Hungary, Poland, Czech Republic, Romania, Slovakia
Northern Europe European Commission (2005, 2006); UN/ECE Timber Bulletin (2002)
Denmark, Estonia (Terep, 2004), Finland, Ireland, Latvia, Lithuania (Peleckas, 2004), Norway, Sweden, United Kingdom
Southern Europe European Commission (2005, 2006); UN/ECE Timber Bulletin, 2002
Austria, Belgium, France (http://www.promethee.com), Germany (http://www.fire.uni-freiburg. de), Luxembourg,Netherlands, Switzerland
Western Europe European Commission (2005, 2006); UN/ECE Timber Bulletin (2002)
Austria, Belgium, France (http://www.promethee.com), Germany (http://www.fire.uni-freiburg. de), Luxembourg, Netherlands, Switzerland
Middle East European Commission (2005, 2006)
Cyprus, Israel, Lebanon (Bassil, 2000), Turkey (http://www.ogm.gov.tr/) ,Bilgili (1997)
North Africa Algeria (Madoui, 2002), Libya (ECE/FAO Agriculture and Timber Division, 1986), Morocco (Forestry Department/FAO, 2001), Tunisia (ECE/FAO Agriculture and Timber Division, 1986)
Russia Sukhinin et al. (2004a, b), (http://www.landcover.org/data/burned/,
http://www.fire.uni-freiburg.de/)
Mongolia Erdenesaikhan and Erdenetuya (1999); Valendik et al. (1998)
Table 2.Annual aerosol emissions by source types in the Northern and Southern Hemispheres, and globally over the 10 yr (SS=sea salt,
SD=soil dust, BC=black carbon, POM=particulate organic matter).
Open ocean Deserts and Boreal and temperate vegeration fires Global fossil fuel burning Tropical forest and savanna fires
semi-deserts Global crop and biofuel fires
SS
(1012kg yr−1) SD(1011kg yr−1) BC(107kg yr−1) POM(109kg yr−1) BC(108kg yr−1) POM(108kg yr−1) BC(109kg yr−1) POM(1010kg yr−1)
NH SH Global
6.9 ± 0.2 (33 %) 13.7 ± 0.3 (67 %) 20.6 ± 0.3
19.9 ± 1.2 (94 %) 1.3 ± 0.6 (6 %) 21.2 ± 1.4
21.4 ± 6.4 n/a 21.4 ± 6.4
3.6 ± 1.3 n/a 3.6 ± 1.3
65.8 ± 6.1 (90 %) 7.2 ± 0.8 (10 %) 73.0 ± 6.7
91.4 ± 6.4 (93 %) 7.0 ± 0.8 (7 %) 98.4 ± 6.8
2.9 (52 %) 2.7 (48 %) 5.6
2.8 (52 %) 2.6 (48 %) 5.4
2.4 Simulation setup
The GEM-AQ/EC used in the study was configured with 28 hybrid vertical levels with the model top at 10 hPa. The hor-izontal model grid was configured as global uniform reso-lution of 1° × 1°. The GEM-AQ/EC was run with the fully nudged variables of wind, temperature, pressure and wa-ter vapor of NCEP-reanalysis meteorology every 24 h. This nudge setup resulted in the meteorological fields with 24-h forecast segments starting from the reanalysis meteorology with the meteorological simulation being forced to obser-vations of the NCEP reanalysis meteorology. Initial aerosol conditions were generated by GEM-AQ/EC running with a
Fig. 1.Geographic locations of observational sites used in compar-ing with modelcompar-ing results. The background contours are the PM10 concentrations (µg m−3)averaged from the ten years of modelled results. Blue dots are stations from IMPROVE and CAPMoN in North America, green dots are the stations from EMEP of Europe, black dots are stations from CAWNET of China and red dots are the stations from GAW and Miami University research stations.
soil dust aerosols calculated on-line from the modelled me-teorology and other surface parameters as well as the natural components of BC and POM. This configuration allows the assessments of the impact of meteorology on the global dis-tribution and transport of air pollutants as well as the contri-bution of natural aerosols to the global air quality.
3 Global aerosol distributions
In order to evaluate the performance of GEM-AQ/EC for simulating global aerosols at various regions, observational data from a number of long term monitoring networks are se-lected, including IMPROVE (Interagency Monitoring of Pro-tected Visual Environments) and CAPMoN (Canadian Air and Precipitation Monitoring Network) from North Amer-ica, EMEP (European Monitoring and Evaluation Program) from Europe and CAWNET (China Atmosphere Watch Net-work) from China. AOD data from AeroNet, aerosol data from GAW (Global Atmospheric Watch) stations as well as data from Miami University research stations are also used. Figure 1 shows the geographic distributions of the surface observational networks used to compare with the modeling results. In addition, satellite observation of AOD by MODIS is also used in this study.
3.1 Global emissions of natural aerosols
In the following, the aerosol emissions inventories were cal-culated with the methods described in Sect. 2.2. Annual esti-mates are compared to inventories available in the literature. Table 2 summarizes the natural aerosol emissions of sea-salt, soil dust and carbonaceous aerosols into various categories and hemispheres.
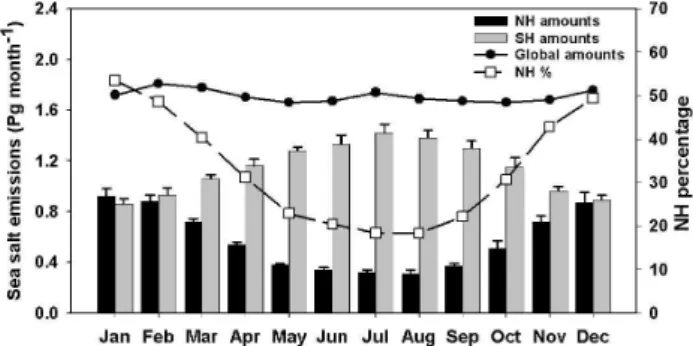
Fig. 2.Seasonality of sea salt aerosol mass production (mean ± s.d.)
at global scale and in the Northern (NH) and Southern Hemisphere (SH) oceans (1 Pg=1012kg).
3.1.1 Sea salt production from open oceans
Figure 2 shows the global sea-salt emissions with a pro-nounced seasonality in both hemispheres. Monthly emis-sions in Southern Hemisphere (SH) reach 1.4 Pg month−1 in July–August during the austral winter, whereas Northern Hemisphere (NH) maximum corresponds to 1.0 Pg month−1 in December–February during the boreal winter. About two-thirds of the emissions are located in the SH and one-third in the NH (Table 2, Fig. 3a). The annual global SS mass production during the study period corresponds to 20.77×
1012kg yr−1. Table 2 presents total emissions by particle
type at global scale and for Northern and Southern Hemi-spheres. SS is one the major contributors to the mass of par-ticulate matter injected in the atmosphere. One order of mag-nitude separates global SS to SD amounts.
The annual estimate of 20.7×10¹²kg is in the upper range of the annual emission estimates from 0.3×10¹² to 30×
1012kg yr−1found across the literature (Lewis and Schwartz, 2004). Gong et al. (1997b) determined a total of 11.7×
1012kg yr−1 based on the SS product flux formulation of Monahan et al. (1986) and using wind speed observations at several locations around the globe. Later, Gong et al. (1998) determined a much lower total of 3.33×10¹²kg yr−1
ap-plying the same mathematical formula to wind fields cal-culated with a global transport model (Gong et al., 2002). Chin et al. (2002) followed a similar approach with a global transport model and calculated the annual emissions of 5.8– 7.5×10¹²kg. Schulz et al. (2004) determined 19.8×10¹²kg. Grini et al. (2002) determined a total of 6.5×10¹²kg yr−1 based on global transport model using Monahan et al. (1986) for the radius at 80 % relative humidity, i.e.r80<7 µm and
O’Dowd and Smith (1993) forr80>7 µm. For the AeroCom
(a)
(b)
(c)
Fig. 3.Total emission maps of global sea-salt(a), global mineral
dust(b), BC from boreal and temperate vegetation fires(c)in metric tonnes per km2during 1995–2004.
3.1.2 Soil dust emission from desert areas
During 1995–2004, the range of global SD emissions cal-culated with the CAM dust scheme is 1880–2330 Tg yr−1, which is comparable to previous estimates of 1000 to 2150 Tg yr−1published in the literature (Zender et al., 2004), and the maximum is calculated for 2002 with 2330 Tg of dust emitted to the atmosphere. The averaged global emission of 2120 ± 140 Tg yr−1 is comparable to the global mean of 2073 Tg yr−1calculated between 1981 and 1996 by Ginoux
et al. (2004). Among 15 global aerosol models within the Ae-roCom project, there were large differences in simulating the dust cycle and its impact on climate (Huneeus et al., 2011).
Figure 3b presents the spatial distribution of total SD emis-sions in tonnes km−2for the 10 yr of this study. This figure clearly points out the large emissions occurring in the two prominent desert areas of North Africa and East Asia.
Fig-ure 4 exhibits the “roller-coaster” type-monthly variation of dust emissions at global scale and for the major deserts. The largest sources of dust are located in North Africa and are roughly larger by one order of magnitude than that of Asia. More than three-quarters of global dust emissions occur in North Africa.
Dust emissions from Saharan desert occur all year long with a minimum in the wintertime and a maximum during the summer (Fig. 4). The modeling outputs suggest that average emissions are 1600 ± 130 Tg yr−1with a maximum of 1750 Tg in 2002. Kaufman et al. (2005a) estimated that 240 ± 80 Tg of African dust are transported to the Atlantic Ocean ev-ery year by using MODIS satellite imagev-ery. Recent studies pointed out that localized sources are responsible for most of the North African SD emissions. The Bod´el´e region (15– 20◦E, 12–18◦N) is considered as the most active source of
dust in the Sahara desert, and probably in the world (Koren et al., 2006; Washington and Todd, 2005; Tegen et al., 2006). The Bod´el´e is an enclosed topographic depression located between the Tibesti Mountains and Lake Chad. High veloc-ity winds are associated to the particular topography of the area. Field observations pointed out that the ground is made of very fine remains of microscopic freshwater organisms, which populated the lake Mega-Chad thousands years ago, whereas the soil of northern Sahara is mostly composed of a mixture of clay aggregates. Ginoux et al. (2004) estimated that the Bod´el´e is responsible for up to half of all the dust that leaves West Africa, and Todd et al. (2007) suggested that the region might release 1.2 ± 0.5 Tg of dust per day during substantial dust events. Prospero and Lamb (2003) claimed that dust emissions from the Sahara considerably increased in past decades. Results from this study spanning only 10 yr are not able to confirm their conclusion.
Dust emissions from East Asia have a more pronounced seasonality than those in North Africa. Dust events orig-inate every spring from the Gobi desert (36–44◦N, 100–
114◦E), located in southern Mongolia and northern China.
Fig. 4.Monthly emissions of mineral dust from global deserts and for the Sahara and East Asia desertic areas from 1995 through 2004.
Finally, SD emissions from North American deserts are relatively much lower compared to those occurring in the Sahara and Gobi deserts. They correspond on average to 4 ± 2 Tg yr−1, which contribute only to 0.2 % of the global SD emissions. Over the 10 yr of the study, a maximum of 8 Tg was reached in 1998. Modeling outputs suggest that the 2001 “Red Bowl” dust episode in southern US represented “only” 3 Tg (Park et al., 2007).
3.1.3 Black carbon from boreal and temperate vegetation fires
Figure 5a shows the high inter-annual variability of black car-bon emissions from vegetation fires in Canada, Alaska, con-terminous US, Russia, Mongolia, and all other geographical areas combined. Russian contribution is preponderant due to its large forest territory and nature of fires occurring with all-time high in 2003. Large emissions in 2002 and 2003 were due to extreme fire events in both North America and Siberia. There is a factor 2 to 3 between the minimum in 2001 and the maximum in 2003 for total BC emissions. Southern Eu-rope is the predominant source region of natural BC west of the Ural Mountains. In particular, the 2003 fires in Southern Europe were a large source of emissions. On average, Rus-sia and Canada represents 36 % and 19 % of BC emissions. Conterminous US accounts for almost 10 % of total emis-sions with the largest contribution located in the western part of the country.
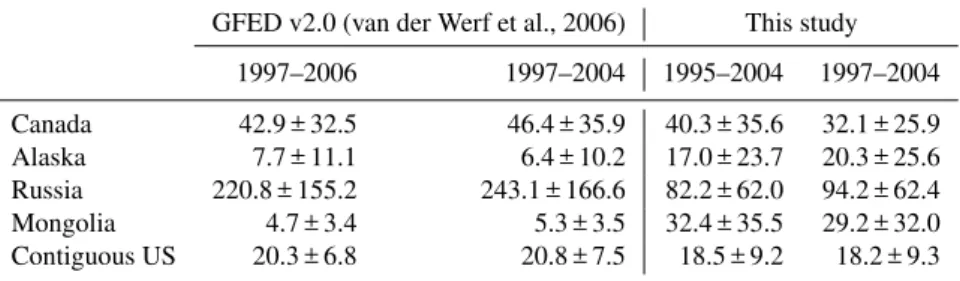
Table 3 compares the annual BC estimates to the Global Fire Emissions Database (GFED) v2.1 for countries which are estimated to have the largest emissions (van der Werf et al., 2006). Mean and standard deviation values are presented for 1995–2004, GFED time period 1997–2006, and the over-lap period between the two datasets. GFED emissions are based on areas burned derived from MODIS hotspots (Giglio et al., 2006) and then do not include any statistical infor-mation from agencies’ field reports. Standard deviations
cal-(a)
(b)
Fig. 5.Inter-annual(a)and monthly variability(b)of black carbon
emitted by wildland fires in the boreal and temperate regions.
culated from both datasets are shown to be high, hence in-dicating great inter-annual variability of the emissions (Ta-ble 3). Both inventories agree that Russia and Canada are the main contributors to BC from vegetation fires in the Northern Hemisphere.
Table 3.Comparison of BC emissions from vegetation fires to Global Fire Emission Database version 2.1 for countries with the largest emissions in the boreal and temperate regions (in Gg).
GFED v2.0 (van der Werf et al., 2006) This study
1997–2006 1997–2004 1995–2004 1997–2004
Canada 42.9 ± 32.5 46.4 ± 35.9 40.3 ± 35.6 32.1 ± 25.9
Alaska 7.7 ± 11.1 6.4 ± 10.2 17.0 ± 23.7 20.3 ± 25.6
Russia 220.8 ± 155.2 243.1 ± 166.6 82.2 ± 62.0 94.2 ± 62.4
Mongolia 4.7 ± 3.4 5.3 ± 3.5 32.4 ± 35.5 29.2 ± 32.0
Contiguous US 20.3 ± 6.8 20.8 ± 7.5 18.5 ± 9.2 18.2 ± 9.3
latitudes for each year. The seasonal cycle is clearly driven by the boreal fire activity that ceases during wintertime. Peak usually occurs during the summer months, except in 1996 with a maximum in May due to Mongolian fires. In that country, fire statistics and remote sensing indeed reveal that a large number of fires can occur during springtime, and spread quickly in the extensive steppe and stepped-forest ar-eas. However, summertime monsoon rains seriously limit the number of fires.
The variability in the number of ATSR nighttime fire counts was employed as a proxy for determining the monthly variability in the area burned from annual AVHRR fire scars in Siberia. Generoso et al. (2003) pointed out that ATSR fire pixels show globally a seasonal cycle consistent with diverse satellite products used in fire detection, including daily TRMM (Tropical Rainfall Measuring Mission) prod-ucts, daily AVHRR imageries, and satellite SPOT-derived Global Burnt Area 2000 mapping (Tansey et al., 2004).
3.2 Comparisons with AOD by satellites
Hemispheric-scale differences in land area (39 % of the Northern Hemisphere is covered by land vs. 19 % in the Southern Hemisphere) and in human population have led to large inter-hemispheric differences in aerosol source strengths. This, in turn, leads to the difference in the global aerosol distributions (Textor et al., 2006). Satellite observa-tion of aerosols by AOD has the advantage of displaying the main feature of global aerosol distributions and revealing the regional characteristics. Figure 6 shows the global AOD from satellite observations of monthly averaged MODIS over the period of 2000–2004 with the model simulated AOD as the sum of the single species contribution from sulphate, sea-salt, black carbon, organic carbon and soil dust aerosols for four seasons.
The main features of the global aerosol distributions are captured by the GEM-AQ/EC. Four regions in the globe, i.e. North America, Europe, South Asia and East Asia, have the majority of the global anthropogenic emissions and con-tribute to the regional and global aerosol burdens. This is clearly reflected in Fig. 6 where four aerosol plumes are
ob-served and simulated with long range transports. The AODs predicted are comparable with the satellite observations.
The natural sources of aerosols are in the desert areas and over the oceans. The aerosol regime in Africa is a good ex-ample of a primary (soil dust) aerosol mixing with primary and secondary biomass burning aerosols. The soil dust com-ponent covers the Saharan desert source region and extends thousands of kilometres downwind. The tran-Atlantic trans-port of African dust aerosols was clearly visible from both observed and simulated AODs. This is also consistent with the emission patterns shown in Fig. 3 for dust aerosols.
There are seasonal variations observed and predicted, es-pecially for the natural components. Dust aerosols show a distinct peak in East Asia spring and transports over the Pa-cific. High summer AOD in central Africa that is linked to the bio-mass burning has been well simulated by the GEM-AQ/EC.
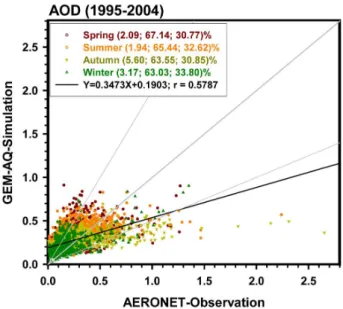
3.3 Comparisons with AOD by AERONET
To further evaluate the model performance, monthly modeled AOD was compared with the surface based global AERONET AOD observations from 1995 to 2004. AERONET data cover the whole 10 yr of simulation period. Simulated AODs were distributed in the horizontal model grid at the global uniform resolution of 1◦× 1◦and mapped
JJA SON
Fig. 6.Comparisons of seasonally averaged AOD between MODIS and model simulations for 2000–2004. The filled contours are for MODIS
and the contour lines are for model simulations.
Fig. 7.Correlation between model-simulated AOD and AERONET
observations from 1995 to 2004. Scattered dots are grouped into four seasons, each of which shows a different behavior. Dots within the gray area indicate the modeled AODs are within a factor of 2 from observations. The numbers in the bracket following the season are the percentages of modeled results with under-, within a factor of 2 and over-estimations.
seen from the figure that the model has captured the global spatial and temporal distributions of the AODs, which have been qualitatively illustrated by the comparison with satellite
observations (Fig. 6). More than 63 % of the simulated points are within a factor of two (shaded area in Fig. 7) compared with the observations. Overestimates for about 30–34 % of the points are found for the lower AOD (<0.3) and underes-timate for about 2–6 % of the points for higher AOD values (>0.3). Seasonally, autumn sees the highest underestimate and winter the highest over-estimate. These differences could be caused by the seasonal changes of aerosol emissions and the aerosol transport driven by atmospheric circulations.
This comparison yields some insights into the model per-formance and emissions. The reasonable correlation coeffi-cient indicates the acceptable skills of the model in predict-ing the spatial and temporal distributions of AOD around the globe. It is interesting to note that the over-estimates for 30–40 % of the points are located in the lower AOD re-gions where more AERONET sites are stationed and lower emissions of PM are found, such as in the North America and Europe. Conversely, under-estimates are seen over much less points (2–6 %) in the AERONET sties and in the high AOD regions. This may point to the possibility of under-estimates of emissions in the polluted areas, e.g. Asia, and over-estimates in the relatively less polluted regions, e.g. North America.
3.4 Comparisons with surface observations
Speciated PM observations are available from some sur-face monitoring stations such as IMPROVE and EMEP with PM10 and PM2.5concentrations. The comparisons
(a)
PM10 (1995-2004)
IMPROVE-Observation [ µg m-3 ]
0 20 40 60 80 100
G
EM-A
Q
-Si
m
u
la
ti
on
[
µ
g
m
-3
]
0 20 40 60 80 100
Spring (20.79; 78.11; 1.10)% Summer (20.83; 78.70; 0.47)%
Autumn (35.74; 63.35; 0.91)%
Winter (45.75; 49.50; 4.75)% Y=0.3580X+2.7564; r = 0.6117
PM2.5 (1995-2004)
IMPROVE-Observation [ µg m-3
]
0 10 20 30 40 50 60
0 10 20 30 40 50 60
Spring (1.99; 75.56; 22.45)% Summer (2.17; 78.93; 18.90)%
Autumn (16.93; 73.99; 9.08)%
Winter (23.13; 52.58; 24.29)% Y=0.6131X+2.8244; r = 0.6528
(b)
PM10 (1997-2004)
0 20 40 60 80 100
G
EM-A
Q
-Si
m
u
la
ti
o
n
[
µ
g
m
-3
]
0 20 40 60 80 100
Spring (26.30; 73.32; 0.38)% Summer (5.25; 94.36; 0.39)%
Autumn (35.84; 64.16; 0.0)%
Winter (63.69; 35.71; 0.60)% Y=0.2069X+7.0222; r = 0.3064
PM2.5 (1998-2004)
EMEP-Observation [ µg m-3 ]
0 10 20 30 40 50
0 10 20 30 40 50
Spring (9.69; 82.70; 7.61)% Summer (0.68; 94.54; 4.78)%
Autumn (16.61; 81.73; 1.66)%
Winter (47.01; 51.87; 1.12)% Y=0.2052X+7.2826; r = 0.2544
EMEP-Observation [ µg m-3
]
Fig. 8.Correlations of seasonally averaged PM10 and PM2.5with network observations in (a)North America and(b) Europe. Legend
explanations are given the same as in Fig. 7.
in Fig. 8a for North America and Fig. 8b in Europe. Reason-able comparisons are achieved for North America with corre-lation coefficients (r) reaching 0.61 and 0.65 for the 10 yr av-eraged PM10and PM2.5, respectively. For PM10, the
simula-tion results for spring and summer are more than 78 % within a factor of two compared to observations with about 20 % underestimates. The under-estimates increase to 35–45 % in autumn and winter. It seems that certain sources of coarse particles are missed by the modeling system.
The model performance for Europe is not as good as for NA with correlation coefficients (r) only reaching 0.31 and 0.25 for the averaged PM10 and PM2.5, respectively. It
should be noted that the observational data for Europe has a slightly shorter time span than the NA data. Except for winter months when large under-estimates of the model predictions are found, most of the predictions are within a factor of two from the observations (Fig. 8b). For both NA and EU, the summer has the best performance.
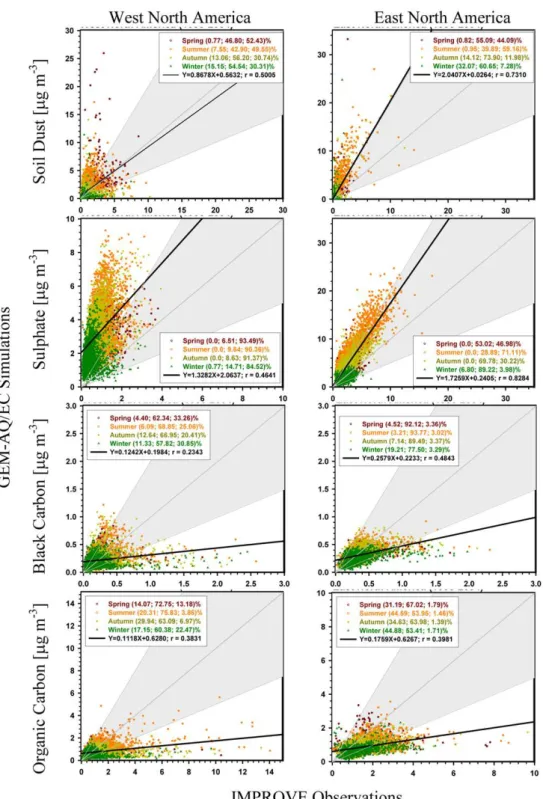
Fig. 9.Comparisons of model predicted concentrations of four major aerosol species in North America with IMPROVE network observations. West and East North Americas are compared separately. Legend explanations are given the same as in Fig. 7.
in the current paper, does not take into account the variabil-ity in amounts of fuel consumed from month to month, ex-cept for Canada. Therefore, the method underpredicts emis-sions, including those of BC and OC, from fires during drier than normal years. A new version of the boreal fire
Fig. 10.Seasonal dust aerosol distributions (µg m−3) in North America and influence of trans-Atlantic transport of dust from Africa.
weather conditions, and thus the nature of the fire. The tech-nique used in the present study follows the vertical distribu-tion of smoke in the model layers, already used in the Ae-roCom study (Dentener et al., 2006). The injection heights are set to constant values for various geographical areas; for example, 4–5 km in boreal North America and 2–3 km for other regions. Therefore, the bias of OC prediction could be caused by “misplaced” injection heights for specific years or months. However, considering the seasonality of injection heights would mean taking into account the weather condi-tions in the calculation of the plume heights over 10 yr, which was beyond the scope of our modelling study. The next ver-sion of the boreal fire emisver-sion datasets is currently under development and will integrate the seasonal variability of the emissions heights following the method detailed in Lavou´e et al. (2007).
Positive biases are found for NA dust and sulphate aerosols. The dust aerosols are over-predicted by a factor of 2 for the east NA with a slightly negative bias for the west NA. Given the fact that most of the wind-blown sources is in the west, the over-estimate is a little unusual. If the anthro-pogenic dust (i.e. fugitive dust) were added into the model, the over-estimate in the east would be even larger. However, a detailed analysis of the seasonal variation of the comparisons reveals that most of the over-estimate of dust aerosols in east
NA occurs in spring and summer, which coincides with the peak trans-Atlantic transport of African dust to North Amer-ica (Fig. 10a and b). For fall and winter (Fig. 10c and d) when the continental America is less impacted by the African dust, the model performance is much better, indicating that the model has over-estimated the trans-Atlantic transport of dust. Three factors are attributable for the over-estimate, i.e. dust emission, transport and removal processes. More obser-vational data is needed to identify the dominant factors and to improve the model performance.
For sulphate, the over-prediction is about 1.6 and 1.9 for the west and east NA, respectively. Given the fact that the anthropogenic emission of sulphur used for the 10-yr sim-ulations in this study was from GEIA for the mid-1980’s, the overestimate may be primarily due to larger emissions in North America for GEIA than for the simulation and ob-servational periods of 1995 to 2004. Stern (2005) estimated about 30 % decrease of sulphur emissions in North America from 1985 to 2000 with further drop to 2007 (Gong et al., 2010).
China-Observation [ µg m-3 ]
0 100 200 300 400 500
GE
M
-A
Q-0 100
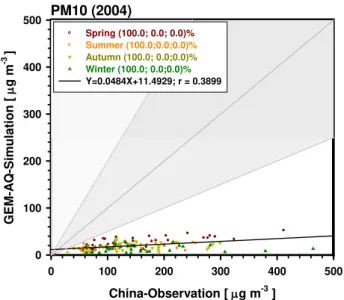
Fig. 11. Comparisons of model predicted PM concentrations in
China with CAWNET network observations in 2004. Legend ex-planations are given the same as in Fig. 7.
estimation of PM in NA is a consequence of the under-prediction of carbonaceous aerosols and the ignorance of ni-trate aerosols.
The uncertainty in emissions is more obvious for the simulation in Asia. Though a relatively good correlation between modeled and observed PM10 was achieved, the
model severely under-estimated the concentration for all months and stations (Fig. 11). The sulphur emissions in Asia have increased more than 20 % from 1985 to 2000 (Stern, 2005) while Zhang et al. (2009) have shown an increas-ing trend durincreas-ing 2001–2006 for China: 36 % increase for SO2, 55 % for NOx, 18 % for CO, 29 % for VOC, 13 %
for PM10, and 14 % for PM2.5, BC, and OC. This
chang-ing trend in emissions has contributed to the discrepancy be-tween model simulated and observed aerosol concentrations in Asia. More accurate emissions in terms of spatial and tem-poral resolutions are needed to better simulate aerosol con-centrations in Asia.
3.5 Seasonal variations
Due to the seasonal variations in emissions and meteorology, aerosols also exhibit certain degree of seasonal variations. Figure 12 shows the simulated and observed seasonal vari-ations of PM2.5 and PM10 averaged over the observational
points in North America and Europe. For both North Amer-ica and Europe, the model predicts a summer high of PM concentrations that are agreed well with observations in NA but not in Europe where no obvious seasonal variations are observed for the averaged concentrations. For NA, the agree-ment for PM2.5is rather good in terms of both seasonal
vari-ations and magnitudes while for PM10the agreement is very
tions. The model reached reasonable agreement with the ob-served concentrations and seasonal variations at these loca-tions. These seasonal variations reflect the sources and trans-port changes during the year, regulated by the global gen-eral circulation variability. The three remote stations over the Pacific, i.e. Cheju, Midway over Oahu, have a spring peak, which is contributed from the spring soil dust emis-sion and transport from the Asian continent. On the other hands, the stations in the Atlantic and its coast, i.e. Rsmas, Bermuda and Barbados, present a summer peak which is contributed from the trans-Atlantic transport of dust aerosols from Africa (Fig. 10b). This seasonal variation is consistent with the observations of structure and variability of aerosols over Africa, the Atlantic, and the Americas by CALIPSO (Cloud -Aerosol Lidar Infrared Pathfinder Satellite Observa-tions) (Adams, 2011). It is interesting to note that the dust spring peaks in Asia and Pacific follow the peak emissions (Fig. 4) and transport in spring by westerly. However, even though the peak emission of dust in Africa appears in spring (Fig. 4), the dust concentrations over the Atlantic and its coast peak in summer. This is probably caused by the sea-sonal variations of the trans-Atlantic transports by the east-erly waves which maximize in summer (Jones et al., 2003) to bring more dust into the Atlantic ocean and the east part of North America.
4 Relative Contribution of natural vs. anthropogenic origins
PM2.5 PM10 N or th A m er ic a Eur ope
North America (1995-2004)
Month
Jan Feb Mar Apr May Jun Jul Aug Sept Oct Nov Dec
P M 2 .5 -C on ce n tr a ti on ( µ g m -3 ) 0 5 10 15 20 GEM-AQ Simulation IMPROVE Observation
North America (1995-2004)
Month
Jan Feb Mar Apr May Jun Jul Aug Sept Oct Nov Dec
P M 10 -C on ce n tr a ti on ( µ g m -3) 0 5 10 15 20 25 30 GEM-AQ Simulation IMPROVE Observation Europe (1997-2004) Month
Jan Feb Mar Apr May Jun Jul Aug Sept Oct Nov Dec
P M 2 .5 C on ce n tr a ti on ( µ g m -3 ) 0 5 10 15 20 25 30 GEM-AQ Simulation EMEP Observation Europe (1997-2004) Month
Jan Feb Mar Apr May Jun Jul Aug Sept Oct Nov Dec
P M 10 C on ce n tr a ti on ( µ g m -3) 0 10 20 30 40 GEM-AQ Simulation EMEP Observation
Fig. 12.Comparisons of simulated monthly PM2.5and PM10concentrations in North America and Europe with observations.
and reasonable results are achieved (Gong and Barrie, 2003; Gong et al., 1997a). The model evaluations in Sect. 3, espe-cially the spatial and temporal correlations, indicated that the model is able to capture the general spatial and temporal dis-tributions of various aerosol properties including AOD and mass concentrations.
The relative contribution of natural aerosols to the global background concentrations are obtained from the 10 yr simu-lations. Over the oceans in the roaring southern 40 and mid-latitude Northern Hemisphere, sea-salt aerosol is the domi-nant aerosol species. This can be seen from both satellite ob-servations (Fig. 14a) and modeling results (Fig. 14b). In the regions where anthropogenic aerosols dominate as indicated by the red pixels in Fig. 14 such as in Europe, East NA and East Asia, the model predicts less than 20 % natural contribu-tions. Over the major continental natural source regions such as in northern Africa, south-west NA and central Asia as in-dicated by the green pixels in Fig. 14a, the predicted natural contributions can range from 50 % to about 100 %.
Natural aerosols have not only inter-annual variations but also seasonal changes. For the 10 yr simulations, the percent-age contribution to the total PM can reach as high as 10 % in some regions due to the inter-annual variability of meteorol-ogy, especially in the tropic and equatorial regions (Fig. 14b). The seasonal variation of natural aerosols depends on the
species and locations. Asian dust aerosols peak in the spring and are transported over the Pacific Ocean. This is illustrated in the observed and modeled dust concentrations at Cheju, Oahu and Midway (Fig. 13). Strong seasonal variations are found for the global sea-salt fluxes in both Northern and Southern Hemispheres. A winter high with respect to each hemisphere is predicted. Sea-salt concentrations are highest in the roaring forties of the Southern Hemisphere and over the northern oceans from October to March, which is con-sistent with the emission patterns of sea-salt aerosol (Fig. 3). Bio-mass burning aerosols from natural sources i.e. boreal forests (Fig. 5), peak in the summer and contribute to the background aerosols in the northern high latitudes and in the Arctic.
It should be noted that the current assessment of the rela-tive contributions of natural aerosols to the global total distri-butions is subject to large uncertainties due to the large uncer-tainties in the emission estimates. For example, the estimate of annual dust emission in this study was around 4 Tg yr−1
Cayenne (4.92οN, 53.30οW)
Month
Jan Feb Mar Apr May Jun Jul Aug Sept Oct Nov Dec
D us t C onc e nt ra ti on [ µ g m -3 ] 0 5 10 15 20 25 30 35 Simulation Observation
Rsmas (25.75οN, 80.25οW)
Month
Jan Feb Mar Apr May Jun Jul Aug Sept Oct Nov Dec
D us t C onc e nt ra ti on [ µ g m -3 ] 0 2 4 6 8 10 12 14 16 18 20 Simulation Observation
Bermuda (32.27οN, 64.87οW)
Month
Jan Feb Mar Apr May Jun Jul Aug Sept Oct Nov Dec
D us t C onc e nt ra ti on [ µ g m -3 ] 0 2 4 6 8 10 12 Simulation Observation
Midway Island (28.22οN,177.35οW)
Month
Jan Feb Mar Apr May Jun Jul Aug Sept Oct Nov Dec
D us t C onc e nt ra ti on [ µ g m -3] 0.0 0.2 0.4 0.6 0.8 1.0 1.2 1.4 1.6 1.8 2.0 Simulation Observation
Oahu Hawaii (21.33οN,157.70οW)
Month
Jan Feb Mar Apr May Jun Jul Aug Sept Oct Nov Dec
D us t C onc e nt ra ti on [ µ g m -3 ] 0.0 0.5 1.0 1.5 2.0 Simulation Observation
Cheju (33.52οN, 126.48οE)
Month
Jan Feb Mar Apr May Jun Jul Aug Sept Oct Nov Dec
D us t C onc e nt ra ti on [ µ g m -3 ] 0 10 20 30 40 Simulation Observation
Rarotonga (21.25οS,159.75οW)
Month
Jan Feb Mar Apr May Jun Jul Aug Sept Oct Nov Dec
D us t C onc e nt ra ti on [ µ g m -3 ] 0.05 0.10 0.15 0.20 0.25 0.30 Simulation Observation
Sal Island (16.78οN, 22.90οW)
Month
Jan Feb Mar Apr May Jun Jul Aug Sept Oct Nov Dec
D us t C onc e nt ra ti on [ µ g m -3 ] 0 50 100 150 200 250 Simulation Observation
Fig. 13.Comparisons of monthly averaged surface soil dust concentrations for 1995–2004 with observations at Miami University research
Fig. 14. (a) This false color image is a map of natural aerosols
(green pixels), human pollution (red pixels), or a mixture of both (light brown pixels). Gray areas indicate a lack of usable data. This map covers pollution measured between January 2001 and July 2002.(b)Global distribution of the averaged percentages of natural aerosol contributions to total aerosols (shading) with the standard deviations (contour lines) of the percentages from the 10 yr model-ing.
5 Conclusions
A global on-line air quality modeling system with size segre-gated aerosol scheme was developed and utilized to simulate the global aerosol emissions and climatology for 10 yr. The inter-annual variability and seasonal cycle of emissions of sea-salt, soil dust, black carbon, and organic matter for bio-mass burning was investigated from 1995–2004. Canadian wildfire emissions for 2000–2004 integrated in the emission inventories were calculated with a state-of-the-art modeling technique, including a semi-empirical fire behaviour model.
Reasonable agreements, especially the spatial and tem-poral correlations, are achieved with observations, indicat-ing that the model is able to capture the general spa-tial and temporal distributions of various aerosol properties including AOD and mass concentrations. The large discrep-ancy between model simulated and observed concentrations is mainly due to the emissions used in this application. The model performance is generally better in North America than in Europe and Asia with the best in the east North America.
In the regions where anthropogenic aerosols dominate such as in Europe, East NA and East Asia, the model
pre-dicts less than 20 % natural contributions. Over the ma-jor continental natural source regions such as in northern Africa, south-west NA and central Asia the predicted natu-ral contributions can range from 50 % to about 100 %. Nat-ural aerosols present larger seasonal variations than the an-thropogenic aerosols and have strong inter-annual variability associated the fluctuation in meteorology.
The variability in global aerosols is complicated by the tempo-spatial changes of emissions as well as by the inter-annual variations of meteorology. The influence of meteoro-logical factors is difficult to distinguish from observations. Although the accuracy in the emission sources may have played an important role in the aerosol simulation, the 10-yr modeling of global aerosols with respect to the mean climate of hemispheric transport provides a way to isolate the me-teorological influence on the aerosol variability through an analysis of the 10-yr aerosol modeling, which is presented in the companion paper published (Zhao et al., 2012) focusing on the inter-annual variability of HTAP and the meteorolog-ical contributions.
Appendix A
Methodology in computing the Carbonaceous Aerosol Emis-sions from Boreal and Temperate Vegetation Fires.
A1 North America
For Canada, hourly emissions were calculated with a fire growth parameterization, a fire behavior prediction model, and modelled surface weather conditions for the years 2000– 2004 (Lavou´e et al., 2007; Lavou´e and Stocks, 2011). From 1995 through 1999, the large fire database (200+hectares)
of (Stocks et al., 2003) was used. This dataset provides the start date, geographical location, and final size of every fire in the records. However, the extinction date is not systemati-cally included by provincial protection agencies. To address this issue, a statistical analysis of fifteen large fires, for which the area growth was recorded by the agencies, was performed to determine a linear relationship between the final size and the length of the burning time period (Table 2). By applying a daily fire growth rate depending on the final size, it was possible to estimate an extinction date for all the fires in the large fire database.
used to set respective seasonal cycles for all other years.
A2 Europe
Regarding Europe, reliable fire statistics for most of the countries permit constraining areas burned on an annual or even a monthly basis. Inventories of areas burned were compiled from multiple sources including technical reports, statistics available on web sites of respective Ministries of the Environment, and information compiled and disseminated by the United Nation Food and Agriculture Organization. Ta-ble 1 summarizes all the information scrutinized by countries in Eastern, Northern, Southern, and Western Europe. In the eastern, northern, and western regions of Europe, fire activity is relatively limited and statistics are usually restricted to an-nual data and are provided at the scale of a country or by ju-risdiction (e.g. the Laender for Germany). However, statistics are more complete on a monthly basis and at the administra-tive unit level in countries of Southern Europe where large vegetation fires may occur. For instance, Spain, Portugal, Italy, and France have maintained comprehensive records on fire activity in their Mediterranean ecosystems.
A3 North Africa and Middle East
Ground-based statistics related to fires occurring in the rest of the Mediterranean basin is much more limited. Only annual areas burned are available, sometimes as best guess, for most of the countries in North Africa and Middle East, with the exception of Turkey, for which information on fire locations and seasonality by ecosystems were published (Table 1).
A4 Boreal Eurasia
For Russia, annual areas burned for 1996 to 2002 were as-sessed from AVHRR (Advanced Very High Resolution Ra-diometer) imagery by Sukhinin et al. (2004a, b). Datasets are available as GIS shape files at the Global Land Cover Facility web site (Table 1). In addition, similar remote sensing 3 anal-ysis exists for subsequent years 2003 and 2004 on the Global Fire Monitoring Center web site (Table 1). Next, ATSR fire counts were employed as proxies to derive the monthly dis-tribution in every grid cell. Finally, a forest fuel map was built from the Russian vegetation mapping completed by the International Institute for Applied System Analysis (http:
ical Survey (https://research.cip.cgiar.org/gis/index.php, ac-cessed 16 March 2011).
Acknowledgements. The authors wish to thank CFCAS (The Canadian Foundation for Climate and Atmospheric Sciences) for its partial finical support for this research through the NW AQ MAQNet Grant. This research was also partially supported by the National Key Research Project (2011CB403404) of the Ministry of Science and Technology of China.
Edited by: E. Vignati
References
Adams, A. M.: Climatology and Variability of Aerosol over Africa, the Atlantic, and the Americas, Open Access Theses., 273 pp., 2011.
Adhikary, B., Carmichael, G. R., Kulkarni, S., Wei, C., Tang, Y., D’Allura, A., Mena-Carrasco, M., Streets, D. G., Zhang, Q., Pierce, R. B., Al-Saadi, J. A., Emmons, L. K., Pfister, G. G., Av-ery, M. A., Barrick, J. D., Blake, D. R., Brune, W. H., Cohen, R. C., Dibb, J. E., Fried, A., Heikes, B. G., Huey, L. G., O’Sullivan, D. W., Sachse, G. W., Shetter, R. E., Singh, H. B., Campos, T. L., Cantrell, C. A., Flocke, F. M., Dunlea, E. J., Jimenez, J. L., Weinheimer, A. J., Crounse, J. D., Wennberg, P. O., Schauer, J. J., Stone, E. A., Jaffe, D. A., and Reidmiller, D. R.: A regional scale modeling analysis of aerosol and trace gas distributions over the eastern Pacific during the INTEX-B field campaign, Atmos. Chem. Phys., 10, 2091–2115, doi:10.5194/acp-10-2091-2010, 2010.
Akimoto, H.: Global Air Quality and Pollution, Science, 302, 1716– 1719, 2003.
Ayash, T., Gong, S. L., and Jia, C.: Direct and indirect shortwave radiative effects of sea salt aerosols, J. Climate, 21, 3207–3220, 2008.
Baron, R. E., Montgomery, W. D., and Tuladhar, S. D.: An Analysis of Black Carbon Mitigation as a Response to Climate Change, Copenhagen Consensus Center, 31, 2009.
Berntsen, T., Isaksen, I. S. A., Wang, W. C., and Liang, X. Z.: Im-pacts of increased antrhopogenic emissions in Asia on tropo-spheric ozone and climate: A global 3-D model study., Tellus, 48B, 13–32, 1996.
Cooke, W. F., Liousse, C., and Cachier, H.: Construction of a 1° x1° fossil fuel emission data set for carbonaceous aerosol and implementation and radiative impact in the ECHAM4 model, J. Geophys. Res., 104, 22137–22162, 1999.
Cˆot´e, J., Desmarais, J.-G., Gravel, S., M´ethot, A., Patoine, A., Roch, M., and Staniforth, A.: The operational CMC/MRB Global En-vironmental Multiscale (GEM) model. Part I: Design consider-ations and formulation, Mon. Weather Rev., 126, 1373–1395, 1998.
Dentener, F., Kinne, S., Bond, T., Boucher, O., Cofala, J., Generoso, S., Ginoux, P., Gong, S., Hoelzemann, J. J., Ito, A., Marelli, L., Penner, J. E., Putaud, J.-P., Textor, C., Schulz, M., van der Werf, G. R., and Wilson, J.: Emissions of primary aerosol and precur-sor gases in the years 2000 and 1750 prescribed data-sets for Ae-roCom, Atmos. Chem. Phys., 6, 4321–4344, doi:10.5194/acp-6-4321-2006, 2006.
EPA, U. S.: National Ambient Air Quality Standards for Particulate Matter: Final Rule, Federal Register, 62, 38651–38760, 1997. F´ecan, F., Marticorena, B., and Bergametti, G.: Parametrization of
the increase of the aeolian erosion threshold wind friction veloc-ity due to soil moisture for arid and semi-arid areas, Ann. Geo-phys., 17, 149–157, doi:10.1007/s00585-999-0149-7, 1999. Fiore, A. M., Dentener, F. J., Wild, O., Cuvelier, C., Schultz, M. G.,
Hess, P., Textor, C., Schulz, M., Doherty, R. M., Horowitz, L. W., MacKenzie, I. A., Sanderson, M. G., Shindell, D. T., Steven-son, D. S., Szopa, S., Dingenen, R. V., Zeng, G., Atherton, C., Bergmann, D., Bey, I., Carmichael, G., Collins, W. J., Duncan, B. N., Faluvegi, G., Folberth, G., Gauss, M., Gong, S., Hauglus-taine, D., Holloway, T., Isaksen, I. S. A., Jacob, D. J., Jonson, J. E., Kaminski, J. W., Keating, T. J., Lupu, A., Marmer, E., Monta-nar, V., Park, R. J., Pitari, G., Pringle, K. J., Pyle, J. A., Schroeder, S., Vivanco, M. G., Wind, P., Wojcik, G., Wu, S., and Zuber, A.: Multimodel estimates of intercontinental source-receptor re-lationships for ozone pollution, J. Geophys. Res., 114, D04301, doi:10.1029/2008JD010816, 2009.
Flanner, M. G., Zender, C. S., Randerson, J. T., and Rasch, P. J.: Present-day climate forcing and response from black carbon in snow, J. Geophys. Res., 112, D11202, doi:10.1029/2006JD008003, 2007.
Generoso, S., Br´eon, F.-M., Balkanski, Y., Boucher, O., and Schulz, M.: Improving the seasonal cycle and interannual variations of biomass burning aerosol sources, Atmos. Chem. Phys., 3, 1211– 1222, doi:10.5194/acp-3-1211-2003, 2003.
Giglio, L., van der Werf, G. R., Randerson, J. T., Collatz, G. J., and Kasibhatla, P.: Global estimation of burned area using MODIS active fire observations, Atmos. Chem. Phys., 6, 957– 974, doi:10.5194/acp-6-957-2006, 2006.
Ginoux, P., Chin, M., Tegen, I., Prospero, J. M., Holben, B., Dubovik, O., and Lin, S.-J.: Sources and distributions of dust aerosols simulated with the GOCART mode, J. Geophys. Res., 106, 20255–20274, 2001.
Ginoux, P., Prospero, J. M., Torres, O., and Chin, M.: Long-term simulation of global dust distribution with the GO-CART model: correlation with North Atlantic Oscillation, Environ. Model. Softw., 19, 113–128, doi:10.1016/S1364-8152(03)00114-2, 2004.
Gong, S. L.: A parameterization of sea-salt aerosol source function for sub- and super-micron particles, Global Biogeochem. Cy., 17, 1097, doi:10.1029/2003GB002079, 2003.
Gong, S. L. and Barrie, L. A.: Simulating the Impact of Sea-salt on Global nss-Sulphate Aerosols, J. Geophys. Res., 108, 4516, doi:10.1029/2002JD003181, 2003.
Gong, S. L., Barrie, L. A., and Blanchet, J.-P.: Modeling sea-salt aerosols in the atmosphere. Part 1: Model development, J. Geo-phys. Res., 102, 3805–3818, 1997a.
Gong, S. L., Barrie, L. A., Prospero, J. M., Savoie, D. L., Ayers, G. P., Blanchet, J.-P., and Spacek, L.: Modeling sea-salt aerosols in the atmosphere – 2. Atmospheric concentrations and fluxes, J. Geophys. Res., 102, 3819–3830, doi:10.1029/96JD03401, 1997b.
Gong, S. L., Barrie, L. A., Blanchet, J.-P., and Spacek, L.: Modeling size-segregated sea salt aerosols in the atmosphere: an applica-tion using Canadian climate models, in: Air polluapplica-tion modeling and its application XII, edited by: Gryning, S.-E. and Chaumer-liac, M., Plenum, New York, 337–345, 1998.
Gong, S. L., Barrie, L. A., and Lazare, M.: Canadian Aerosol Module (CAM): A size-segregated simulation of atmospheric aerosol processes for climate and air quality models – 2. Global sea-salt aerosol and its budgets, J. Geophys. Res., 107, 4779, doi:10.1029/2001JD002004, 2002.
Gong, S. L., Barrie, L. A., Blanchet, J.-P., Salzen, K. v., Lohmann, U., Lesins, G., Spacek, L., Zhang, L. M., Girard, E., Lin, H., Leaitch, R., Leighton, H., Chylek, P., and Huang, P.: Cana-dian Aerosol Module: A size-segregated simulation of atmo-spheric aerosol processes for climate and air quality mod-els 1. Module development, J. Geophys. Res., 108, 4007, doi:10.1029/2001JD002002, 2003a.
Gong, S. L., Zhang, X. Y., Zhao, T. L., McKendry, I. G., Jaffe, D. A., and Lu, N. M.: Characterization Of Soil Dust Dis-tributions In China And Its Transport During ACE-ASIA 2. Model Simulation and Validation, J. Geophys. Res., 108, 4262, doi:10.1029/2002JD002633, 2003b.
Gong, S. L., Zhang, X. Y., Zhao, T. L., Zhang, X. B., Barrie, L. A., McKendry, I. G., and Zhao, C. S.: A simulated climatology of Asian dust aerosol and its trans-Pacific transport. Part II: Inter-annual variability and climate connections, J. Climate, 19, 104– 122, 2006.
Gong, S. L., Zhao, T. L., Sharma, S., Toom-Sauntry, D., Lavou´e, D., Zhang, X. B., Leaitch, W. R., and Barrie, L. A.: Identification of trends and interannual variability of sulfate and black carbon in the Canadian High Arctic: 1981-2007, J. Geophys. Res., 115, D07305, doi:10.1029/2009JD012943, 2010.
Governing Council of the United Nations Environment Programme: Integrated assessment of black carbon and tropospheric ozone – Summary for decision makers Nairobi, 37, 2011.
Grini, A., Myhre, G., Sundet, J., and Isaksen, I. S. A.: Modeling the annual cycle of sea salt in the global 3D model Oslo CTM2: concentrations, fluxes, and radiative input, J. Climate, 15, 1717– 1730, 2002.
HTAP: HEMISPHERIC TRANSPORT OF AIR POLLUTION 2010, UNITED NATIONS, New York and Geneva, 2010. Huneeus, N., Schulz, M., Balkanski, Y., Griesfeller, J., Prospero,
ice, and air pollution health, J. Geophys. Res., 115, D14209, doi:10.1029/2009JD013795, 2010.
Jones, C., Mahowald, N., and Luo, C.: The role of easterly waves on African desert dust transport, J. Climate, 16, 3617–3628, doi:10.1175/1520-0442(2003)016<3617:TROEWO>2.0.CO;2, 2003.
Kaminski, J. W., Neary, L., Struzewska, J., McConnell, J. C., Lupu, A., Jarosz, J., Toyota, K., Gong, S. L., Cˆot´e, J., Liu, X., Chance, K., and Richter, A.: GEM-AQ, an on-line global multiscale chemical weather modelling system: model description and eval-uation of gas phase chemistry processes, Atmos. Chem. Phys., 8, 3255–3281, doi:10.5194/acp-8-3255-2008, 2008.
Kandlikar, M., Reynolds, C. C. O., and Grieshop, A. P.: A Perspec-tive Paper on Black Carbon Mitigation as a Response to Climate Change, Copenhagen Consensus Center, 20, 2009.
Kaufman, Y. J., Tanr¨e, D., and Boucher, O.: A satellite view of aerosols in the climate system, Nature, 419, 215–223, doi:10.1038/nature01091, 2002.
Kaufman, Y. J., Koren, I., Remer, L. A., Tanr´e, D., Ginoux, P., and Fan, S.: Dust transport and deposition observed from the Terra-Moderate Resolution Imaging Spectroradiometer (MODIS) spacecraft over the Atlantic Ocean, J. Geophys. Res., 110, D10S12, doi:10.1029/2003JD004436, 2005a.
Kaufman, Y. J., Koren, I., Remer, L. A., Tanr´e, D., Ginoux, P., and Fan, S.: Dust transport and deposition observed from the Terra-Moderate Resolution Imaging Spectroradiometer (MODIS) spacecraft over the Atlantic Ocean, J. Geophys. Res., 110, D10S12, doi:10.1029/2003JD004436, 2005b.
Kim, S.-W., Yoon, S.-C., Kim, J., Kang, J.-Y., and Sugimoto, N.: Asian dust event observed in Seoul, Korea, during 29–31 May 2008: Analysis of transport and vertical distribution of dust par-ticles from lidar and surface measurements, Sci. Total Environ., 408, 1707–1718, doi:10.1016/j.scitotenv.2009.12.018, 2010. Koch, D., Bond, T. C., Streets, D., Unger, N., and Van der
Werf, G. R.: Global impacts of aerosols from particular source regions and sectors, J. Geophys. Res., 112, D02205, doi:10.1029/2005JD007024, 2007.
Koren, I., Kaufman, Y. J., Washington, R., Todd, M. C., Rudich, Y., Vanderlei Martins, J., and Rosenfeld, D.: The Bod´el´e depres-sion: a single spot in the Sahara that provides most of the min-eral dust to the Amazon forest, Environ. Res. Lett., 1, 014005, doi:10.1088/1748-9326/1/1/014005, 2006.
Lavou´e, D. and Stocks, B. J.: Emissions of air pollutants by Cana-dian wildfires from 2000 to 2004, International Journal of Wild-land Fire, 20, 17–34, doi:10.1071/WF08114, 2011.
Lavou´e, D., Liousse, C., Cachier, H., Stocks, B. J., and Goldammer, J. G.: Modeling of carbonaceous particles emitted by boreal and temperate wildfires at northern latitudes, J. Geophys. Res., 105,
Liu, J., Mauzerall, D. L., and Horowitz, L. W.: Source-receptor relationships between East Asian sulfur dioxide emissions and Northern Hemisphere sulfate concentrations, Atmos. Chem. Phys., 8, 3721–3733, doi:10.5194/acp-8-3721-2008, 2008. Marticorena, B. and Bergametti, G.: Modeling the atmospheric dust
cycle. 1: Design of a soil-derived dust emission scheme, J. Geo-phys. Res., 100, 16415–16430, doi:10.1029/95JD00690, 1995. Monahan, E. C., Spiel, D. E., and Davidson, K. L.: A model of
ma-rine aerosol generation via whitecaps and wave disruption, in: Oceanic whitecaps and their role in air-sea exchange processes, edited by: Monahan, E. C. and Mac Niocaill, G., D. Reidel, Nor-well, Mass., 167–174, 1986.
O’Dowd, C. D. and Smith, M. H.: Physicochemical properties of aerosols over the northeast Atlantic: evidence for wind-speed-related submicron sea-salt aerosol production, J. Geophys. Res., 98, 1137–1149, 1993.
Park, S. H., Gong, S. L., Zhao, T. L., Vet, R. J., Bouchet, V. S., Gong, W., Makar, P. A., Moran, M. D., Stroud, C., and Zhang, J.: Simulation of entrainment and transport of dust particles within North America in April 2001 (“Red Dust Episode”), Geophys. Res. Lett., 112, D20209, doi:10.1029/2007JD008443, 2007. Penner, J. E., Andreae, M., Annegarn, H., Barrie, L., Feichter, J.,
Hegg, D., Jayaraman, A., Leaitch, R., Murphy, D., Nganga, J., and Pitari, G.: Aerosols, their direct and indirect effects, in: Cli-mate Change 2001: The Scientific Basis, Report to Intergovern-mental Panel on Climate Change from the Scientific Assessment Working Group (WGI), 289–416, edited by: Houghton, H. T., Ding, Y., Griggs, D. J., Noguer, M., van der Linden, P. J., Dai, X., Maskell, K., and Johnson, C. A., Cambridge University Press, 289–416, 2001.
Prospero, J. M. and Lamb, P. J.: African droughts and dust trans-port to the Caribbean: climate change implications, Science, 302, 1024–1027, doi:10.1126/science.1089915, 2003.
Reddy, M. S. and Boucher, O.: Climate impact of black carbon emit-ted from energy consumption in the world’s regions, Geophys. Res. Lett., 34, L11802, doi:10.1029/2006GL028904, 2007. Schultz, M. G.: On the use of ATSR fire count data to estimate the
seasonal and interannual variability of vegetation fire emissions, Atmos. Chem. Phys., 2, 387–395, doi:10.5194/acp-2-387-2002, 2002.
Schulz, M., de Leeuw, G., and Balkanski, Y.: Sea-salt aerosol source functions and emissions, in: Emissions of atmospheric trace compounds, edited by: Granier, C., Artaxo, P., and Reeves, C. E., Kluwer Academic Publishers, Dordrecht, The Netherlands, 333–359, 2004.
doi:10.1007/BF00137988, 1980.
Sharma, S., Lavou´e, D., Cachier, H., Barrie, L. A., and Gong, S. L.: Long-term trends of the black carbon concentrations in the Canadian Arctic, J. Geophys. Res., 109, D15203, doi:10.1029/2003JD004331, 2004.
Stern, D. I.: Global sulfur emissions from 1850 to 2000, Chemo-sphere, 58, 163–175, 2005.
Stocks, B. J., Mason, J. A., Todd, J. B., Bosch, E. M., Wot-ton, B. M., Amiro, B. D., Flannigan, M. D., Hirsch, K. G., Logan, K. A., Martell, D. L., and Skinner, W. R.: Large for-est fires in Canada, 1959–1997, J. Geophys. Res., 107, 8149, doi:10.1029/2001JD000484, 2003.
Sukhinin, A. I., French, H. F., Kasischke, E. S., Hewson, J. H., Soja, A. J., Csiszar, I. A., Hyer, E. J., Loboda, T., Conard, S. G., Ro-masko, V. I., Pavlichenko, E. A., Miskiv, S. I., and Slinkina, O. A.: AVHRR-based mapping of fires in Russia: New products for fire management and carbon cycle studies, Remote Sens. Envi-ron., 93, 546–564, doi:10.1016/j.rse.2004.08.011, 2004a. Sukhinin, A. I., French, N. H. F., Kasischke, E. S., Hewson, J. H.,
Soja, A. J., Csiszar, I. A., Hyer, E. J., Loboda, T., Conard, S. G., Romasko, V. I., Pavlichenko, E. A., Miskiv, S. I., and Slinkina, O. A.: Burned Areas in Russia, Department of Geography, Uni-versity of Maryland, College Park, Maryland, 2004b.
Tansey, K., Gr´egoire, J.-M., Stroppiana, D., Sousa, A., Silva, J. M. N., Pereira, J. M. C., Boschetti, L., Maggi, M., Brivio, P. A., Fraser, R., Flasse, S., Ershov, D., Binaghi, E., Graetz, D., and Peduzzi, P.: Vegetation burning in the year 2000: Global burned area estimates from SPOT VEGETATION data, J. Geo-phys. Res., 109, D14S03, doi:10.1029/2003JD003598, 2004. Tegen, I., Heinold, B., Todd, M., Helmert, J., Washington, R., and
Dubovik, O.: Modelling soil dust aerosol in the Bod´el´e depres-sion during the BoDEx campaign, Atmos. Chem. Phys., 6, 4345– 4359, doi:10.5194/acp-6-4345-2006, 2006.
Textor, C., Schulz, M., Guibert, S., Kinne, S., Balkanski, Y., Bauer, S., Berntsen, T., Berglen, T., Boucher, O., Chin, M., Dentener, F., Diehl, T., Easter, R., Feichter, H., Fillmore, D., Ghan, S., Ginoux, P., Gong, S., Grini, A., Hendricks, J., Horowitz, L., Huang, P., Isaksen, I., Iversen, I., Kloster, S., Koch, D., Kirkev˚ag, A., Krist-jansson, J. E., Krol, M., Lauer, A., Lamarque, J. F., Liu, X., Mon-tanaro, V., Myhre, G., Penner, J., Pitari, G., Reddy, S., Seland, Ø., Stier, P., Takemura, T., and Tie, X.: Analysis and quantifica-tion of the diversities of aerosol life cycles within AeroCom, At-mos. Chem. Phys., 6, 1777–1813, doi:10.5194/acp-6-1777-2006, 2006.
Todd, M. C., Martins, V., Washington, R., Lizcano, G., Dubovik, O., M’Bainayel, S., and Engelstaedter, S.: Mineral dust emission from the Bodele Depression, Chad during BoDEx 2005, J. Geo-phys. Res., 112, D06207, doi:10.1029/2006JD007170, 2007. United Nations: The United Nations energy statistics database
(2005), United Nations Statistics Division, New York, 5, 2007. van der Werf, G. R., Randerson, J. T., Giglio, L., Collatz, G. J.,
Kasibhatla, P. S., and Arellano Jr., A. F.: Interannual variabil-ity in global biomass burning emissions from 1997 to 2004, At-mos. Chem. Phys., 6, 3423–3441, doi:10.5194/acp-6-3423-2006, 2006.
Venkatram, A., Karamchandani, P. K., and Misra, P. K.: Testing a comprehensive acid deposition model, Atmos. Environ., 22, 737–747, 1988.
Washington, R. and Todd, M. C.: Atmospheric controls on min-eral dust emission from the Bod´el´e Depression, Chad: The role of the low level jet, Geophys. Res. Lett., 32, L17701, doi:10.1029/2005GL023597, 2005.
Wiedinmyer, C., Quayle, B., Geron, C., Belote, A., McKenzie, D., Zhang, X., O’Neill, S., and Wynne, K. K.: Estimating emissions from fires in North America for Air Quality Modeling, Atmos. Environ., 40, 3419–3432, 2006.
Zender, C. S., Miller, R. L., and Tegen, I.: Quantifying mineral dust mass budgets: Systematic terminology, constraints, and current estimates, Eos Trans. AGU, 85, 509, 2004.
Zhang, Q., Streets, D. G., Carmichael, G. R., He, K. B., Huo, H., Kannari, A., Klimont, Z., Park, I. S., Reddy, S., Fu, J. S., Chen, D., Duan, L., Lei, Y., Wang, L. T., and Yao, Z. L.: Asian emis-sions in 2006 for the NASA INTEX-B mission, Atmos. Chem. Phys., 9, 5131–5153, doi:10.5194/acp-9-5131-2009, 2009. Zhao, T. L., Gong, S. L., Zhang, X. Y., Blanchet, J.-P., McKendry,
I. G., and Zhou, Z. J.: A simulated climatology of Asian dust aerosol and its trans-Pacific transport. Part I: mean climate and validation, J. Climate, 19, 88–103, 2006.
Zhao, T. L., Gong, S. L., Zhang, X. Y., and Jaffe, D. A.: Asian dust storm influence on North American ambient PM levels: observa-tional evidence and controlling factors, Atmos. Chem. Phys., 8, 2717–2728, doi:10.5194/acp-8-2717-2008, 2008.