ACPD
10, 281–326, 2010Kinetic multi-layer model of aerosol chemistry (KM-SUB)
M. Shiraiwa et al.
Title Page
Abstract Introduction
Conclusions References
Tables Figures
◭ ◮
◭ ◮
Back Close
Full Screen / Esc
Printer-friendly Version
Interactive Discussion
Atmos. Chem. Phys. Discuss., 10, 281–326, 2010 www.atmos-chem-phys-discuss.net/10/281/2010/ © Author(s) 2010. This work is distributed under the Creative Commons Attribution 3.0 License.
Atmospheric Chemistry and Physics Discussions
This discussion paper is/has been under review for the journal Atmospheric Chemistry and Physics (ACP). Please refer to the corresponding final paper in ACP if available.
Kinetic multi-layer model of aerosol
surface and bulk chemistry (KM-SUB): the
influence of interfacial transport and bulk
di
ff
usion on the oxidation of oleic acid by
ozone
M. Shiraiwa1, C. Pfrang1,2, and U. P ¨oschl1
1
Max Planck Institute for Chemistry, Biogeochemistry Department, P.O. Box 3060, 55128 Mainz, Germany
2
University of Reading, Department of Chemistry, P.O. Box 224, Whiteknights, Reading RG6 6AD, UK
Received: 17 December 2009 – Accepted: 22 December 2009 – Published: 8 January 2010
Correspondence to: U. P ¨oschl ([email protected])
ACPD
10, 281–326, 2010Kinetic multi-layer model of aerosol chemistry (KM-SUB)
M. Shiraiwa et al.
Title Page
Abstract Introduction
Conclusions References
Tables Figures
◭ ◮
◭ ◮
Back Close
Full Screen / Esc
Printer-friendly Version
Interactive Discussion Abstract
We present a novel kinetic multi-layer model that explicitly resolves mass transport and chemical reaction at the surface and in the bulk of aerosol particles (KM-SUB). The model is based on the PRA framework of gas–particle interactions (P ¨oschl et al., 2007), and it includes reversible adsorption, surface reactions and surface-bulk
ex-5
change as well as bulk diffusion and reaction. Unlike earlier models, KM-SUB does not require simplifying assumptions about steady-state conditions and radial mixing. The temporal evolution and concentration profiles of volatile and non-volatile species at the gas-particle interface and in the particle bulk can be modeled along with surface concentrations and gas uptake coefficients.
10
In this study we explore and exemplify the effects of bulk diffusion on the rate of re-active gas uptake for a simple reference system, the ozonolysis of oleic acid particles, in comparison to experimental data and earlier model studies. We demonstrate how KM-SUB can be used to interpret and analyze experimental data from laboratory stud-ies, and how the results can be extrapolated to atmospheric conditions. In particular,
15
we show how interfacial transport and bulk transport, i.e., surface accommodation, bulk accommodation and bulk diffusion, influence the kinetics of the chemical reaction. Sen-sitivity studies suggest that in fine air particulate matter oleic acid and compounds with similar reactivity against ozone (C=C double bonds) can reach chemical lifetimes of multiple hours only if they are embedded in a (semi-)solid matrix with very low diffusion
20
coefficients (≤10−10cm2s−1).
Depending on the complexity of the investigated system, unlimited numbers of volatile and non-volatile species and chemical reactions can be flexibly added and treated with KM-SUB. We propose and intend to pursue the application of KM-SUB as a basis for the development of a detailed master mechanism of aerosol chemistry
25
ACPD
10, 281–326, 2010Kinetic multi-layer model of aerosol chemistry (KM-SUB)
M. Shiraiwa et al.
Title Page
Abstract Introduction
Conclusions References
Tables Figures
◭ ◮
◭ ◮
Back Close
Full Screen / Esc
Printer-friendly Version
Interactive Discussion 1 Introduction
Aerosols are ubiquitous in the atmosphere and have strong effects on climate and pub-lic health (Seinfeld and Pandis 1998; Finlayson-Pitts and Pitts 2000; P ¨oschl, 2005). Depending on chemical composition and surface properties, aerosol particles can act as condensation nuclei for cloud droplets and ice crystals, and they can affect the
abun-5
dance of trace gases through heterogeneous chemical reactions (Ammann et al., 1998; P ¨oschl, 2005; Fuzzi et al., 2006; Andreae and Rosenfeld, 2008; Hallquist et al., 2009). Gas-particle interactions can also significantly change the physical and chemical prop-erties of aerosols such as toxicity, reactivity, hygroscopicity and radiative propprop-erties (P ¨oschl, 2002; Rudich, 2003; Kanakidou et al., 2005; Rincon et al., 2009;
Wieden-10
sohler et al., 2009). Chemical reactions and mass transport lead to continuous trans-formation and changes in the composition of atmospheric aerosols (“chemical aging”) (Schwartz and Freiberg, 1981; Hanson, 1997; Smith et al., 2003; Ammann and P ¨oschl, 2007).
Atmospheric particles consist of a wide variety of organic and inorganic chemical
15
compounds which can exist in different liquid or (semi-)solid states (crystalline, amor-phous, glassy, ultraviscous, gel-like; Mikhailov et al., 2009). Chemical reactions can occur both at the surface and in the bulk of liquid and (semi-)solid particles. It is often difficult to discriminate surface and bulk reactions, and the relative importance of sur-face and bulk processes is not well understood (e.g., Moise and Rudich, 2000; Hearn
20
et al., 2005; Pfrang et al., 2009).
Resistor model formulations are widely used to describe and investigate heteroge-neous reactions and multiphase processes in laboratory, field and model studies of atmospheric chemistry (Hanson, 1997; Finlayson-Pitts and Pitts, 2000; Worsnop et al., 2002; Anttila et al., 2006; King et al., 2008, 2009; and references therein). The
tradi-25
ACPD
10, 281–326, 2010Kinetic multi-layer model of aerosol chemistry (KM-SUB)
M. Shiraiwa et al.
Title Page
Abstract Introduction
Conclusions References
Tables Figures
◭ ◮
◭ ◮
Back Close
Full Screen / Esc
Printer-friendly Version
Interactive Discussion
In order to overcome these limitations, P ¨oschl, Rudich and Ammann have developed a kinetic model framework (PRA framework) with a double-layer surface concept and universally applicable rate equations and parameters for mass transport and chemical reactions at the gas-particle interface of aerosols and clouds (P ¨oschl et al., 2007). Ammann and P ¨oschl (2007) provided first examples on how the PRA framework can be
5
applied to describe various physico-chemical processes in aerosols and clouds such as reactive gas uptake on solid particles and solubility saturation of liquid droplets under transient or steady-state conditions. Springmann et al. (2009) demonstrated the applicability and usefulness of the PRA framework in an urban plume box model of the degradation of benzo[a]pyrene on soot by ozone and nitrogen dioxide. Shiraiwa
10
et al. (2009) presented a kinetic double-layer surface model (K2-SURF) and master mechanism for the degradation of a wide range of polycyclic aromatic hydrocarbons (PAHs) by multiple photo-oxidants (O3, NO2, OH and NO3) through different types of parallel and sequential surface reactions. Pfrang et al. (2009) developed a kinetic double-layer model coupling aerosol surface and bulk chemistry (K2-SUB), in which
15
mass transport and chemical reactions in the particle are not explicitly resolved but represented by a reacto-diffusive flux (Danckwerts, 1951; Hanson, 1997).
Here we present a kinetic-multi layer model of aerosol surface and bulk chemistry (KM-SUB) that explicitly treats all steps of mass transport and chemical reaction from the gas-particle interface to the particle core, resolving concentration gradients and
20
diffusion throughout the particle bulk. We demonstrate the applicability of KM-SUB for a common model system of organic aerosol chemistry, the ozonolysis of oleic acid droplets, and we compare the results of our numerical simulations with the results of earlier experimental and theoretical studies of this system (Moise and Rudich, 2002; Katrib et al., 2004; King et al., 2004, 2009; Katrib et al., 2005; Ziemann, 2005; Hearn
25
ACPD
10, 281–326, 2010Kinetic multi-layer model of aerosol chemistry (KM-SUB)
M. Shiraiwa et al.
Title Page
Abstract Introduction
Conclusions References
Tables Figures
◭ ◮
◭ ◮
Back Close
Full Screen / Esc
Printer-friendly Version
Interactive Discussion 2 Model description
The kinetic multi-layer model of aerosol surface and bulk chemistry (KM-SUB) builds on the formalism and terminology of the PRA framework (P ¨oschl et al., 2007). A list of symbols is given in Appendix A.
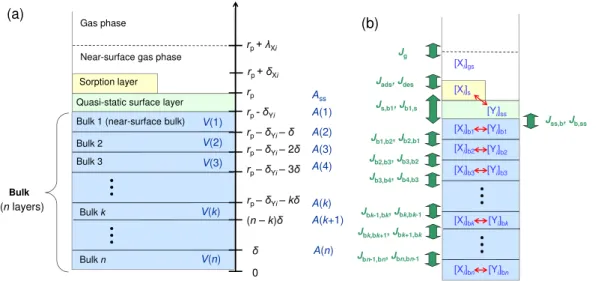
As illustrated in Fig. 1, KM-SUB consists of multiple model compartments and layers,
5
respectively: gas phase, near-gas phase, sorption layer, quasi-static surface layer, near-surface bulk, and a number ofn bulk layers. The quasi-static surface layer has a monolayer thickness that corresponds to the (average) effective molecular diameter of non-volatile species Yj (δYj). The thickness of bulk layer (δ) follows from the number
of layers (n) and particle radius (rp): δ=(rp−δYj)/n.
10
The following processes are considered in KM-SUB: gas phase diffusion, gas-surface transport (reversible adsorption), gas-surface layer reactions, gas-surface-bulk trans-port, bulk diffusion, and bulk reactions. As outlined in the PRA framework, the following differential equations can be used to describe the mass balance of volatile species Xi and non-volatile species Yj for each model layer:
15
d[Xi]s/dt=Jads,Xi−Jdes,Xi+Ps,Xi−Ls,Xi−Js,b,Xi+Jb,s,Xi (1) d[Yj]ss/dt=Jb,ss,Yj−Jss,b,Yj+Pss,Yj−Lss,Yj (2)
d[Xi]b1/dt=(Js,b,Xi−Jb,s,Xi)A(1)/V(1)−(Jb1,b2,Xi−Jb2,b1,Xi)A(2)/V(1)
+Pb1,Xi−Lb1,Xi (3)
d[Yj]b1/dt=(Jss,b,Yj−Jb,ss,Yj)A(1)/V(1)−(Jb1,b2,Yj−Jb2,b1,Yj)A(2)/V(1)
20
+Pb1,Yj−Lb1,Yj (4)
d[Xi]bk/dt=(Jbk−1,bk,Xi−Jbk,bk−1,Xi)A(k)/V(k) −(Jbk,bk+1,Xi−Jbk+1,bk,Xi)A(k+1)/V(k)
ACPD
10, 281–326, 2010Kinetic multi-layer model of aerosol chemistry (KM-SUB)
M. Shiraiwa et al.
Title Page
Abstract Introduction
Conclusions References
Tables Figures
◭ ◮
◭ ◮
Back Close
Full Screen / Esc
Printer-friendly Version
Interactive Discussion
d[Yj]bk/dt=(Jbk−1,bk,Yj−Jbk,bk−1,Yj)A(k)/V(k)
−(Jbk,bk+1,Yj−Jbk+1,bk,Yj)A(k+1)/V(k)
+Pbk,Yj−Lbk,Yj (k=2,...,n−1) (6)
d[Xi]bn/dt=(Jbn−1,bn,Xi−Jbn,bn−1,Xi)A(n)/V(n)+Pbn,Xi−Lbn,Xi (7)
d[Yj]bn/dt=(Jbn−1,bn,Yj−Jbn,bn−1,Yj)A(n)/V(n)+Pbn,Yj−Lbn,Yj (8)
5
The various types of mass transport fluxes (J) and rates of chemical production and loss (P,L) are defined in the list of symbols (Appendix A).A(k) andV(k) are the outer surface area and the volume of the bulk layerk, respectively (Fig. 1). For spherical particles, A(k) and V(k) can be calculated from the particle bulk radius (rb=rp−δYj),
bulk layer thickness (δ) and layer index numberkas follows.
10
V(k)=4 3π
h
(rb−(k−1)δ) 3
−(rb−kδ)3
i
(9)
A(k)=4π(rb−(k−1)δ)2 (10)
For planar geometry (thin films), the surface-to-volume ratio is constant:
A(k)/V(k)=1/δ (11)
The surface-to-volume ratios of the layers play an important role in accounting for
par-15
ticle geometry. The absolute number of non-volatile molecules Yj in the particle (NYj)
can be calculated as follows:
NYj =[Yj]ssAss+
n
X
k=1
[Yj]bkV(k) (12)
whereAss is the surface area of the particle. In the following sub-sections we specify
the formalisms used to describe and calculate fluxes or rates of gas-surface
interac-20
ACPD
10, 281–326, 2010Kinetic multi-layer model of aerosol chemistry (KM-SUB)
M. Shiraiwa et al.
Title Page
Abstract Introduction
Conclusions References
Tables Figures
◭ ◮
◭ ◮
Back Close
Full Screen / Esc
Printer-friendly Version
Interactive Discussion 2.1 Gas-surface interactions and surface layer reactions
The principles and details of gas-phase and gas-surface transport (Jads,Jdes) and
sur-face layer reactions (Ls,Lss, Ps,Pss) have been discussed and illustrated in the PRA
framework (P ¨oschl et al., 2007; Ammann and P ¨oschl, 2007) and in the K2-SURF study of aerosol surface chemistry (Shiraiwa et al., 2009). Here we just briefly summarize the
5
key aspects and equations. The fluxes of surface collisions, adsorption and desorption of a volatile species Xi (Jcoll,Xi,Jads,Xi andJdes,Xi) are given by:
Jcoll,Xi=[Xi]gsωXi/4 (13)
Jads,Xi =αs,XiJcoll,Xi (14)
Jdes,Xi =kd,Xi[Xi]s (15)
10
αs,Xi=αs,0,Xi(1−θs) (16)
θs=
X
i
σs,Xi[Xi]s (17)
[Xi]gsis the near-surface gas phase concentration of Xi,ωXi is the mean thermal
veloc-ity,αs,Xi is the surface accommodation coefficient, andkd,Xi is the desorption rate
co-efficient or inverse desorption lifetime, respectivelykd,Xi=τ− 1 d,Xi
. αs,0,Xi is the surface
15
accommodation coefficient on an adsorbate-free surface,σs,Xi is the effective molecu-lar cross section of Xi in the sorption layer, andθsis the surface coverage by adsorbed
species.
For slow gas uptake and in the gas kinetic-regime (small uptake coefficient, large Knudsen number), [Xi]gs is practically the same as the average gas phase
concentra-20
tion of Xi in the investigated system, [Xi]g. For rapid gas uptake in the continuum or
ACPD
10, 281–326, 2010Kinetic multi-layer model of aerosol chemistry (KM-SUB)
M. Shiraiwa et al.
Title Page
Abstract Introduction
Conclusions References
Tables Figures
◭ ◮
◭ ◮
Back Close
Full Screen / Esc
Printer-friendly Version
Interactive Discussion
(P ¨oschl et al., 2007; Shiraiwa et al., 2009). The uptake coefficient (γXi) for Xi is given
by:
γXi=
Jads,Xi−Jdes,Xi Jcoll,Xi
+γgsr,Xi (18)
γgsr,Xi is the reaction probability for elementary gas-surface reactions (potentially
rele-vant for free radicals but assumed to be zero in the remainder of this study.
5
General rate equations of chemical production and loss by surface layer reactions (Ps,Xi,Pss,Yi,Ls,Xi,Lss,Yi) are specified in the PRA framework (Sect. 3.3, P ¨oschl et al.,
2007). Different types of surface layer reactions can proceed within the sorption layer (Ps,s,Xi−Ls,s,Xi), within the quasi-static surface layer (Pss,ss,Yj−Lss,ss,Yj), and between
sorption layer and quasi-static layer (Ps,ss,Xi−Ls,ss,Xi,Pss,s,Yj−Lss,s,Yj). The generalized
10
rate equations for reactions between volatile species Xi in the sorption layer and non-volatile species Yj in the quasi-static layer are given by:
Ps,ss,Xi−Ls,ss,Xi=
X
v
X
p
X
q
cSLRv,s,XikSLRv,Xp,Yq[Xp]s[Yq]ss (19)
Pss,ss,Yj−Lss,ss,Yj=
X
v
X
p
X
q
cSLRv,ss,YjkSLRv,Xp,Yq[Xp]s[Yq]ss (20)
Here cSLRv,s,Xi and cSLRv,ss,Yj stand for the stoichiometric coefficients (negative for
15
starting materials and positive for reaction products) of species Xi and Yj in reaction SLRv;v=1,...,vmaxin a system with a total number ofvmax(photo-)chemical reactions
occurring on the surface of the investigated aerosol particles. kSLRv,Xp,Yq is a
second-order reaction rate coefficient. In the exemplary simulations of the ozonolysis of oleic acid performed in this study and presented in Sect. 3, we consider only chemical loss
20
and a second-order surface layer reaction between O3(X) and oleic acid (Y) with the
following rate equation:
ACPD
10, 281–326, 2010Kinetic multi-layer model of aerosol chemistry (KM-SUB)
M. Shiraiwa et al.
Title Page
Abstract Introduction
Conclusions References
Tables Figures
◭ ◮
◭ ◮
Back Close
Full Screen / Esc
Printer-friendly Version
Interactive Discussion 2.2 Surface-bulk transport
The surface-bulk transport of volatile species Xi (Js,b,Xi and Jb,s,Xi) is defined as
ex-change between sorption layer and near-surface bulk, and the surface–bulk transport of non-volatile species Yj (Jss,b,Yj andJb,ss,Yj) is defined as exchange between
quasi-static surface layer and near-surface bulk. Based on the PRA framework, surface to
5
bulk transport can be described by:
Js,b,Xi =ks,b,Xi[Xi]s (22)
Jss,b,Yj=kss,b,Xj[Yj]ss (23)
ks,b,Xi and kss,b,Yj are first-order transport rate coefficients (s− 1
) of Xi and Yj, respec-tively. In the same way, bulk to surface transport (Jb,s,Xi and Jb,ss,Yj) can be described
10
as follows:
Jb,s,Xi =kb,s,Xi[Xi]b1 (24)
Jb,ss,Yj=kb,ss,Xj[Yj]b1 (25)
kb,s,Xi andkb,ss,Yj (cm s− 1
) are transport rate coefficients, which can be regarded as ef-fective transport velocities. Estimates for these effective transport velocities can be
15
derived from the corresponding bulk diffusion coefficients Db,Xi and Db,Yj (cm
2
s−1) by considering the average distance traveled by molecules diffusing in one direction:
x=(4Dbt/π)1/2 (Atkins, 1998; Pfrang et al., 2009). On average, a molecule Yj in the near-surface bulk layer (k=1) needs to travel a distance ofx≈(δ+δYj)/2 to move into the quasi-static surface layer. The average time required to travel over this distance
20
by diffusion ist=(δ+δYj) 2
π/(16Db,Yj). By division of travel distance over travel time we
obtain the following estimate for the effective transport velocity:
ACPD
10, 281–326, 2010Kinetic multi-layer model of aerosol chemistry (KM-SUB)
M. Shiraiwa et al.
Title Page
Abstract Introduction
Conclusions References
Tables Figures
◭ ◮
◭ ◮
Back Close
Full Screen / Esc
Printer-friendly Version
Interactive Discussion
For pure Yj under equilibrium conditions, mass conservation implies kb,ss,Yj[Yj]b1= kss,b,Yj[Yj]ss, and the surface and bulk concentrations are given by the inverse of the effective molecular cross section and of the effective molecular volume, respectively: [Yi]ss=δ−
2
Yj and [Yi]b1=δ− 3
Yj . Thus, we obtain
kss,b,Yj ≈kb,ss,Yj/δYj ≈8Db,Yj/((δ+δYj)δYjπ) (27)
5
In analogy, the bulk-to-surface transport velocity of Xi can be calculated for an average travel distance ofx≈(δ+δXi+2δYj)/2 from the near-surface bulk layer into the sorption
layer:
kb,s,Xi≈8Db,Xi/((δ+δXi+2δYj)π) (28)
An estimate for ks,b,Xi can be determined by matching the rate coefficients for
gas-10
surface and surface-bulk transport with a literature value or estimate for the gas-particle equilibrium partitioning coefficient (Ksol,cc,Xi) or Henry’s law coefficient, respectively
(P ¨oschl et al., 2007):
ks,b,Xi=
4kb,s,XiKsol,cc,Xikd,Xi αs,XiωXi
(29)
wherekd,Xi is the first-order rate coefficient of desorption. From the fluxes and rates
15
of gas-surface transport, surface-bulk transport and surface reaction follows the bulk accomodation coefficient of Xi:
αb,Xi =αs,Xi
Js,b,Xi
Jdes,Xi+Js,b,Xi+Ls,Xi
(30)
2.3 Bulk diffusion
Bulk diffusion is explicitly treated in the KM-SUB model as the mass transport (Jbk,bk+1)
20
ACPD
10, 281–326, 2010Kinetic multi-layer model of aerosol chemistry (KM-SUB)
M. Shiraiwa et al.
Title Page
Abstract Introduction
Conclusions References
Tables Figures
◭ ◮
◭ ◮
Back Close
Full Screen / Esc
Printer-friendly Version
Interactive Discussion
transport, we describe the mass transport fluxes between different layers of the bulk by first-order rate equations:
Jbk,bk+1,Xi=kb,b,Xi[Xi]bk (31)
Jbk,bk+1,Yj=kb,b,Yj[Yj]bk (32)
Estimates for the transport rate coefficients or effective velocities of Xi and Yj,kb,b,Xi
5
and kb,b,Yj (cm s
−1
), can be calculated from the corresponding diffusion coefficients. For this purpose we assume that each layer is homogeneously mixed (no concentration gradient within a layer) and that the average travel distance for molecules moving from one layer to the next is the layer thicknessδ:
kb,b,Xi =4Db,Xi/(πδ) (33)
10
kb,b,Yj=4Db,Yj/(πδ) (34)
This treatment of bulk diffusion yields practically the same results (concentration profiles) as the solving of partial differential equations (Smith et al. 2003), but it is more flexible and requires no assumptions about interfacial transport. As detailed in Appendix B, the ozone concentrations calculated for the near-surface bulk indicate that
15
the assumption of Henry’s law equilibrium is not a realistic boundary layer condition for the PDE method when applied to reactive systems.
2.4 Bulk reaction
Chemical reactions proceeding within the bulk of a particle are defined as bulk re-actions (BR). For simplicity, we assume that all relevant bulk rere-actions proceed via
20
ACPD
10, 281–326, 2010Kinetic multi-layer model of aerosol chemistry (KM-SUB)
M. Shiraiwa et al.
Title Page
Abstract Introduction
Conclusions References
Tables Figures
◭ ◮
◭ ◮
Back Close
Full Screen / Esc
Printer-friendly Version
Interactive Discussion
can be used to describe net chemical production (i.e. production minus loss) of bulk species Xi or Yj within the bulk layerk.
Pbk,Xi−Lbk,Xi = X
v
X
p
cBRv,Xi[Xp]bk
kBRv,Xp+ X
q
kBRv,Xp,Xq[Xq]bk+ X
r
kBRv,Xp,Yr[Yr]bk
(35)
Pbk,Yi−Lbk,Yi = X
v
X
p
cBRv,Yi[Yp]bk 5
kBRv,Yp+ X
q
kBRv,Yp,Yq[Yq]bk+ X
r
kBRv,Xr,Yp[Xr]bk
(36)
HerecBRv,Xi and cBRv,Yj stand for the stoichiometric coefficients (negative for starting
materials and positive for reaction products) of species Xi and Yj in reaction BRv;
v=1,...,vmax in a system with a total number of vmax chemical reactions occurring
in the bulk layer k. kBRv,Xp and kBRv,Yp are first-order reaction rate coefficients and
10
kBRv,Xp,Xq,kBRv,Xp,Yr andkBRv,Yp,Yqare second-order reaction rate coefficients. In
prin-ciple, higher-order reactions might also occur in real systems and could be flexibly included in the model. In the exemplary simulations of the ozonolysis of oleic acid performed in this study and presented in Sect. 3, we consider only chemical loss and a second-order bulk reaction between O3(X) and oleic acid (Y) with the following rate
15
equation:
Lbk,X=Lbk,Y=kBR,X,Y[X]bk[Y]bk (37)
3 Model application: oxidation of oleic acid by ozone
To test and demonstrate the applicability of the KM-SUB model, we have simulated the oxidation of oleic acid particles by ozone in comparison to experimental data from
ACPD
10, 281–326, 2010Kinetic multi-layer model of aerosol chemistry (KM-SUB)
M. Shiraiwa et al.
Title Page
Abstract Introduction
Conclusions References
Tables Figures
◭ ◮
◭ ◮
Back Close
Full Screen / Esc
Printer-friendly Version
Interactive Discussion
Ziemann (2005). The same data set has recently been used by Pfrang et al. (2009) for simulations with a kinetic double-layer model (K2-SUB). The gas phase ozone concen-tration was set to [X]g=[X]gs=7.0×10
13
cm−3 (corresponding to 2.8 ppm at 1013 hPa and 298 K). The initial surface and bulk concentrations of ozone (X) were set to [X]s,0=[X]bk,0=0, and the initial surface and bulk concentrations of oleic acid (Y) were
5
set to [Y]ss,0=9.7×10 13
cm−2and [Y]ss,0=1.2×10 21
cm−3, respectively. Accordingly, the initial value of the total number of oleic acid molecules in particles with a radius of 0.2 µm wasNY,0=4.1×10
7
.
We modeled the temporal evolution of the particle surface and bulk composition and of the ozone uptake coefficient by numerically solving the differential equations of mass
10
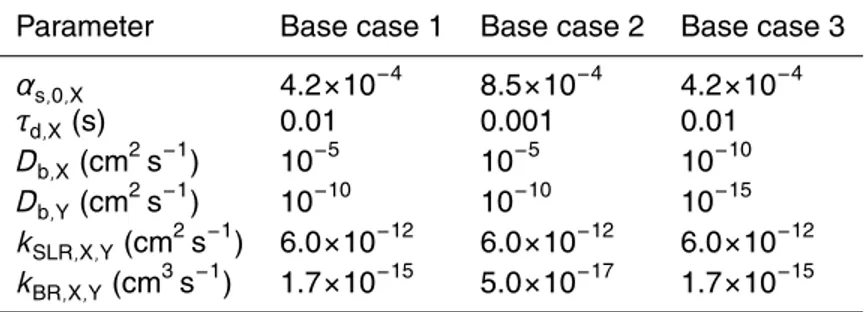
balance for each model compartment (Eqs. 1–8) with Matlab software (ode23tb solver with 999 time steps). The kinetic parameters required for the model simulations are summarized in Table 1: the surface accommodation coefficient of ozone (αs,0,X), the
desorption lifetime of ozone (τd,X), the bulk diffusion coefficients of ozone and oleic acid
(Db,X,Db,Y), the second-order surface layer reaction rate coefficient (kSLR,X,Y), and the
15
second-order bulk reaction rate coefficient (kBR,X,Y). Additional input parameters were
the mean thermal velocity of ozone (ωX=3.6×10 4
cm s−1) and the molecular diameters of oleic acid (δY=0.8 nm) and ozone (δX=0.4 nm).
We have investigated three different model scenarios (base cases) to characterize the influence of different parameters and conditions on the uptake of ozone and the
20
decay of oleic acid. In base case 1 (BC1) we assume fast bulk reaction leading to kinetic limitation by interfacial transport. In base case 2 (BC2) we assume slow bulk reaction (kinetic limitation by bulk reaction) and in base case 3 (BC3) we assume slow bulk diffusion (kinetic limitation by bulk diffusion). Unless mentioned otherwise, the simulations were performed withn=100 layers corresponding to a layer thickness of
25
ACPD
10, 281–326, 2010Kinetic multi-layer model of aerosol chemistry (KM-SUB)
M. Shiraiwa et al.
Title Page
Abstract Introduction
Conclusions References
Tables Figures
◭ ◮
◭ ◮
Back Close
Full Screen / Esc
Printer-friendly Version
Interactive Discussion 3.1 Base case 1: kinetic limitation by interfacial transport
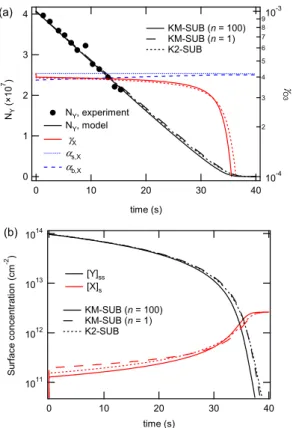
Figure 2 illustrates the model results of KM-SUB in base case 1 with the kinetic pa-rameters specified in Table 1. As shown in Fig. 2a, the simulated decay of oleic acid is in very good agreement with the experimentally observed decay. Through-out the experimental time scale of 1–15 s, the simulated ozone uptake coefficient
5
is nearly constant and identical to the surface and bulk accommodation coefficients (γX≈αb,X≈αs,X≈αs,0,X≈4×10
−4
), indicating that the gas uptake is limited by interfacial mass transport, i.e., by the process of bulk accommodation which is in turn limited by the process of surface accommodation. After ∼30 s the ozone uptake coefficient rapidly drops offwhen reaction partner oleic acid is used up by the rapid bulk reaction
10
(γX/γX,0≈NY/NY,0<1% after∼37 s).
As shown in Fig. 2b, the surface concentration of oleic acid also decreases grad-ually over the first ∼30 s and drops off rapidly afterwards. In contrast, the surface concentration of ozone exhibits a rapid initial increase from zero to a plateau level of [X]s≈10
11
cm−2, which is reached within less than a second (∼20 ms) and determined
15
by the combination of reversible adsorption, surface reaction, and surface-to-bulk trans-port driven by the chemical reaction in the bulk. Over the first 30 s, [X]s gradually
in-creases with the decay of oleic acid and the related decrease of chemical loss. As the chemical loss by reaction with oleic acid rapidly drops offafter ∼30 s, [X]s swiftly
increases by an order of magnitude to a steady-state-level of ∼1012cm−2, which is
20
governed by reversible adsorption.
To test how the number of model layers in the particle bulk affects the simulation results, we have run the model with n=1, 5 and 100 layers corresponding to layer thicknesses of δ=199.2, 39.8 and 1.99 nm, respectively. The results obtained with
n=100 and 5 were practically identical, demonstrating the robustness of the multi-layer
25
ACPD
10, 281–326, 2010Kinetic multi-layer model of aerosol chemistry (KM-SUB)
M. Shiraiwa et al.
Title Page
Abstract Introduction
Conclusions References
Tables Figures
◭ ◮
◭ ◮
Back Close
Full Screen / Esc
Printer-friendly Version
Interactive Discussion
under the conditions of base case 1. Similar deviations were obtained with the kinetic double-layer model K2-SUB, in which the bulk processes are not explicitly resolved but represented by a reacto-diffusive flux (Appendix C, Pfrang et al., 2009).
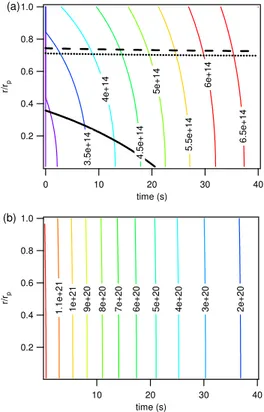
The KM-SUB model results for the bulk concentration profiles of ozone and oleic acid were also essentially the same withn=100 and 5. For high resolution and to avoid
5
congestion of the plot, however, only the profiles obtained 100 layers are shown in Fig. 3. They-axis indicates the radial distance from the particle center (r) normalized by the particle radius (rp), ranging from the particle core (δ/rp≈0) to the near-surface
bulk ((rp−δ)/rp≈1).
As shown in Fig. 3a, ozone rapidly diffuses into the particle bulk. A gradient between
10
the near-surface bulk and the core is established within less than a second (∼20 ms), and the concentration profile is determined by the interplay of interfacial mass transport (surface and bulk accommodation) with bulk diffusion and chemical reaction. During the first few seconds, the ozone concentration in the particle core is about a factor of ∼50 lower than in the near surface bulk. Up to ∼30 s, the ozone concentration
15
gradient decreases gradually with the decay of oleic acid and the related decrease of chemical loss. As the chemical loss by reaction with oleic acid rapidly drops off
after∼30 s, the ozone concentration gradient swiftly relaxes, and after∼37 s ozone is well mixed throughout the particle bulk at the concentration level of solubility saturation ([X]b,sat=8×1014cm−3=Ksol,CC,X[X]gswithKsol,CC,X=4.8×10
−4
mol cm−3atm−1).
20
As shown in Fig. 3b, the ozone gradient and the ozonolysis of oleic acid cause a re-verse gradient in the bulk concentration of oleic acid. Because the concentration of oleic acid is several orders of magnitude larger than that of ozone, however, the strong gradient of ozone induces only a small gradient in oleic acid. During the first few sec-onds, the oleic acid concentration in the near-surface bulk is∼5% lower than in the
25
particle core. As the ozone gradient relaxes after∼30 s, the small oleic acid gradient also disappears. Thus, oleic acid can effectively be regarded as well-mixed.
ACPD
10, 281–326, 2010Kinetic multi-layer model of aerosol chemistry (KM-SUB)
M. Shiraiwa et al.
Title Page
Abstract Introduction
Conclusions References
Tables Figures
◭ ◮
◭ ◮
Back Close
Full Screen / Esc
Printer-friendly Version
Interactive Discussion
and K2-SUB effectively averaged over the whole bulk volume. The averaged values ofLbcalculated by K2-SUB and KM-SUB are almost identical, demonstrating
consis-tency of KM-SUB with K2-SUB and with the underlying resistor model formulation of the reacto-diffusive fluxJb,rd. Due to the overall kinetic limitation by interfacial transport,
the volume-average loss rateLb remains near-constant up to∼30 s. During the first
5
few seconds, the loss rate in the near-surface bulk (Lb1,r/rp≈1) is more than a factor
of 2 higher than the volume-average loss rate, while the loss rates in layers around the particle core (Lb40toLb100,r/rp<0.6) are more than a factor of 2 lower. Lb1continually
decreases due to progressing consumption of oleic acid, whereasLb40toLb100exhibit
a pronounced increase up to∼35 s due to the penetration of ozone to the particle core
10
(see also Fig. 3a). After∼35 s all loss rates drop off rapidly and approach zero after ∼37 s as oleic acid is essentially used up.
Up to∼30 s, the strong radial gradient of loss ratesLb and the approximate
coinci-dence ofLb20(r/rp≈0.8) withLbindicate that the overall rate of conversion or absolute
loss rate of oleic acid and ozone molecules in the particle is strongly dominated by the
15
outer bulk layers atr/rp>0.8. Due to the spherical geometry the outer layers also have
much larger volumes, which further enhances their relative importance with regard to the absolute loss rate of molecules in each layer (L∗bk=LbkVbk) and in the entire particle
(L∗b=LbVb). Figure 4b illustrates this by displaying the values ofL∗bkandL
∗
b
correspond-ing to the values ofLbk and Lb displayed in Fig. 4a (note the linear scaling of Fig. 4a
20
and the logarithmic scaling of Fig. 4b). L∗b calculated by KM-SUB and K2-SUB are almost identical.
The black solid line in Fig. 3a represents the reacto-diffusive length for ozone nor-malized by the particle radius (1−lrd/rp), which can be regarded as the distance from
the surface up to which the chemical reaction proceeds effectively (Finlayson-Pitts and
25
Pitts, 2000; P ¨oschl et al., 2007). The initial value oflrd,X≈20 nm is consistent with the
values reported by Smith et al. (2003) and Katrib et al. (2004). Over the first ∼30 s of the model runlrd,X remains fairly constant, and the reacto-diffusive line (black solid)
ACPD
10, 281–326, 2010Kinetic multi-layer model of aerosol chemistry (KM-SUB)
M. Shiraiwa et al.
Title Page
Abstract Introduction
Conclusions References
Tables Figures
◭ ◮
◭ ◮
Back Close
Full Screen / Esc
Printer-friendly Version
Interactive Discussion
core and the near-surface bulk (black dotted), and with the 63% (=1−1/e) isoline ofL∗b
(black dashed). During this time 63% ofL∗b, i.e., 63% of the overall rate of conversion of oleic acid ozonolysis, occur in the outermost 10 bulk layers, i.e. at r/rp>0.9 (cor-responding to∼30% of the particle bulk volume). After ∼30 s, lrd,X increases steeply
as oleic acid is depleted and ozone can freely penetrate throughout the bulk of the
5
particle.
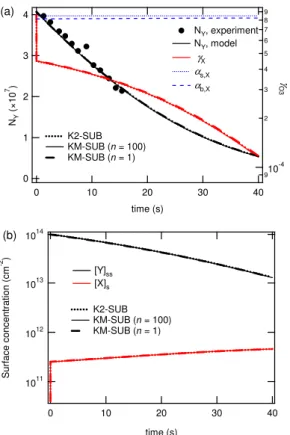
3.2 Base case 2: kinetic limitation by bulk reaction
In base case 2 the second-order bulk reaction rate coefficient was by a factor of∼30 smaller than in BC1, while the surface accommodation coefficient was by a factor of ∼2 higher (Table 1).
10
As shown in Fig. 5a, the simulation results of BC2 are also in very good agreement with the observed decay of oleic acid. The calculated ozone uptake coefficient, how-ever, behaves very differently than in BC1. The initial value ofγXin BC2 is by a factor of
∼2 higher than in BC1. It reflects rapid uptake into the initially ozone-free particle bulk, which is limited by the kinetics of interfacial transport, i.e., bulk accommodation and
15
surface accommodation, respectively. After less than one second (∼20 ms), however,
γXsteeply drops offto a level that is reaction-limited (γX≈10− 4
<αb,X≈8×10− 4
) and con-tinues to decrease gradually with decreasing abundance of the reaction partner oleic acid.
After a rapid initial increase (∼20 ms), the ozone surface concentration reaches
20
a plateau level which increases only slightly until the end of the simulation, while the oleic acid surface concentration decreases gradually. In contrast to BC1, none of the compositional and kinetic parameters exhibit abrupt changes after∼30 s. Instead, they all undergo a gradual evolution reflecting the kinetics of the rate-limiting bulk reaction.
The results of multi-layer model KM-SUB with both n=100 and 1 were practically
25
identical to the results of the double-layer model K2-SUB, indicating that the particle bulk can be regarded as well mixed under the conditions of BC 2.
concen-ACPD
10, 281–326, 2010Kinetic multi-layer model of aerosol chemistry (KM-SUB)
M. Shiraiwa et al.
Title Page
Abstract Introduction
Conclusions References
Tables Figures
◭ ◮
◭ ◮
Back Close
Full Screen / Esc
Printer-friendly Version
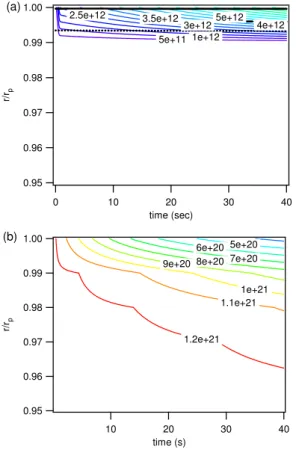
Interactive Discussion
tration in the bulk increases much faster than in BC1 (Fig. 6a vs. Fig. 3a). After less than one second (∼20 ms), the ozone concentration in the core of the particle is only ∼30% lower than in the near-surface bulk, and the gradient continues to decrease with decreasing abundance of oleic acid. Due to the slow decay of oleic acid, however, a small ozone gradient persists until the end of the simulation (Fig. 6a) and thus longer
5
than in BC1, where the initially very strong gradient essentially disappears after∼37 s when practically all oleic acid (>99%) has been consumed by the rapid bulk reaction (Fig. 3a). As illustrated in Fig. 6b, oleic acid can be regarded as well-mixed (concen-tration differences<1%).
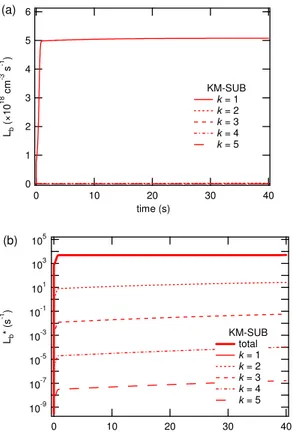
Figure 7a shows the loss rate of oleic acid and ozone by chemical reaction in the
10
particle bulk (Lb) as calculated with KM-SUB for different model layers and with
KM-SUB and K2-KM-SUB effectively averaged over the whole bulk volume. The average values of Lb calculated by K2-SUB and KM-SUB are almost identical. Due to the kinetic
limitation by bulk reaction, the volume-average loss rate Lb decreases continuously
due to consumption of oleic acid. Initially,Lb in the near-surface bulk (Lb1,r/rp≈1) is
15
∼40% higher than that in the core (Lb100) corresponding to the concentration gradient
of O3in the bulk. They become almost same in 20 s as concentration gradient becomes smaller. Figure 7b illustratesL∗bk(=LbkVbk) andL∗b(=LbVb) corresponding to the values
ofLbk andLbdisplayed in Fig. 7a (note the linear scaling of Fig. 7a and the logarithmic
scaling of Fig. 7b).L∗bcalculated by KM-SUB and K2-SUB are almost identical.
20
The black solid line in Fig. 6a represents again the reacto-diffusive length for ozone normalized by the particle radius (1 –lrd/rp). Due to the lower reaction rate coefficient,
the initial value oflrd,X≈120 nm is by a factor of∼6 larger than in BC1, and after ∼20 s
it is already larger than the particle radius (200 nm), indicating that the reaction eff ec-tively proceeds throughout the whole bulk. The 50% isoline (black dotted) for the ozone
25
ACPD
10, 281–326, 2010Kinetic multi-layer model of aerosol chemistry (KM-SUB)
M. Shiraiwa et al.
Title Page
Abstract Introduction
Conclusions References
Tables Figures
◭ ◮
◭ ◮
Back Close
Full Screen / Esc
Printer-friendly Version
Interactive Discussion
reaction and rapid diffusion.
3.3 Base case 3: kinetic limitation by bulk diffusion
Base case 3 is based on base case 1 but the bulk diffusion coefficients are lower by five orders of magnitude (Db,X=10
−10
cm2s−1, Db,Y=10
−15
cm2s−1, Table 1), correspond-ing to characteristic diffusivities of amorphous (semi-)solid matrices (Bird et al., 2007;
5
Swallen et al., 2007; Mikhailov et al., 2009).
As illustrated in Fig. 8a, the decay of oleic acid is very slow in BC3 because the low diffusivity effectively protects oleic acid in the particle bulk from oxidation. Within ∼1 s the calculated ozone uptake coefficient drops from the initial value of ∼4×10⁻³ to∼2×10⁻⁵, which is due to a rapid decrease of the oleic acid surface concentration
10
from∼1014cm−2 to∼1012cm−2. After∼1 s the ozone surface concentration remains practically constant at ∼1012cm−2 (adsorption equilibrium). The low levels of ozone uptake coefficient and oleic acid surface concentration are maintained by surface bulk exchange and decrease slowly as ozone increases and oleic acid decreases also in the near-surface bulk. In contrast to BC1, the bulk accommodation coefficient αb,X
15
(≈2×10⁻⁶) is much smaller thanαs,X and γX, reflecting the slow uptake of ozone into
the particle bulk, which is limited by the kinetics of surface-bulk exchange and bulk diffusion.
Compared to KM-SUB, the simulated decay of oleic acid is faster and the ozone uptake coefficient is higher in K2-SUB, because the latter does not resolve bulk diff
u-20
sion and the concentration profile of oleic acid. In fact, the diffusion coefficient of oleic acid (Db,Y) does not appear in the equation for the reacto-diffusive flux (Eq. C1), which
represents the effects of all bulk processes the resistor model approach.
Due to fast reaction and slow diffusion, both ozone and oleic acid exhibit steep con-centration gradients near the surface, whereas the inner particle bulk remains nearly
25
ACPD
10, 281–326, 2010Kinetic multi-layer model of aerosol chemistry (KM-SUB)
M. Shiraiwa et al.
Title Page
Abstract Introduction
Conclusions References
Tables Figures
◭ ◮
◭ ◮
Back Close
Full Screen / Esc
Printer-friendly Version
Interactive Discussion
(∼0.1 nm; black solid line in Fig. 9a), and the 50% isoline (black dotted) for the ozone concentration difference between particle core and near-surface bulk as well as the 63% (=1−1/e) isoline ofL∗b(black dashed) remain restricted to the near surface bulk (r/rp>0.99). This is also reflected in Fig. 10, showing that the values ofLbandL∗bare
essentially zero except fork=1 (near-surface bulk layer).
5
3.4 Chemical half-life of oleic acid and atmospheric implications
We showed how the KM-SUB model can be used to interpret and analyze experimental data from laboratory studies in the previous sections. Laboratory studies are often car-ried out with high O3concentration to reduce the reaction time. Now we demonstrate how the results can be extrapolated to atmospheric conditions.
10
We estimated the chemical half-life (t1/2) of pure oleic acid particles, when exposed
to ambient O3 mixing ratios (<150 ppb). The radii of oleic acid particles (rp) were set
to be 0.2 and 1.0 µm. The chemical half-life was defined as the time when number of oleic acid molecules was degraded to half of its initial value. The solid lines of Fig. 11 show the results of such calculations with BC1. At typical atmospheric O3
15
mixing ratios of 30 ppb, t1/2 was ∼25 min for rp=0.2 µm and ∼130 min forrp=1.0 µm.
The chemical half-life depended strongly on particle radius (i.e. number of oleic acid molecules contained in the particle). In the typical polluted air with 100 ppb O3,t1/2
was shortened to ∼8 min forrp=0.2 µm and ∼40 min for rp=1.0 µm. The calculations
were also made in BC2, which gave almost the same results forrp=0.2 µm and gave
20
∼20% smaller value forrp=1.0 µm compared to BC1.
The ozonolysis reaction of oleic acid leads to an increased oxygen content and wa-ter uptake increases with longer ozone exposure (Asad et al., 2004). Although pure oleic acid is CCN-inactive, ozonolysis reaction can make particles CCN-active. The modeling results suggest that the transformation of oleic acid particles will occur in the
25
timescale of∼1 h in the ambient atmosphere depending on the O3 concentration and
ACPD
10, 281–326, 2010Kinetic multi-layer model of aerosol chemistry (KM-SUB)
M. Shiraiwa et al.
Title Page
Abstract Introduction
Conclusions References
Tables Figures
◭ ◮
◭ ◮
Back Close
Full Screen / Esc
Printer-friendly Version
Interactive Discussion
However, oleic acid is detected also in aged atmospheric aerosol particles (Rogge et al., 1991; Morris et al., 2002). The possible explanations are: reduced concentration of O3(and other photo-oxidants) in the particle bulk by (a) chemical reaction with other
reactive species, self-reaction or catalytic decomposition or (b) slow mass transport because of low diffusion coefficients (semi-solid matrix, ultra-viscous, glassy, rubbery,
5
and gel-like) due to oligomer formation and/or low temperature. To demonstrate this effect, the sensitivity studies were conducted with lower diffusion coefficients, which correspond to diffusivities characteristic for diffusion in solid or semi-solid matrices (Bird et al., 2007; Swallen et al., 2007; Mikhailov et al., 2009). The dotted line in Fig. 11 shows the calculation results reducing diffusion coefficients of O3 and oleic
10
acid of three orders of magnitudes (Db,X=10
−8
cm2s−1, Db,Y=10
−13
cm2s−1), result-ing in∼30% longert1/2 for both diameters. The dashed line shows the results using Db,X=10−
10
cm2s−1andDb,Y=10− 15
cm2s−1, showing the big increase oft1/2.t1/2was
∼170 min (∼3 h) forrp=0.2 µm and∼4100 min (∼2.8 d) forrp=1.0 µm, almost
indepen-dent on O3mixing ratios.
15
4 Conclusions
We present a novel kinetic multi-layer model (KM-SUB) that explicitly resolves all steps of mass transport and chemical reaction at the surface and in the bulk of aerosol par-ticles. It includes adsorption and desorption, surface reactions and surface-bulk ex-change as well as bulk diffusion and reaction.
20
Unlike earlier models of aerosol chemistry (e.g. resistor model), the KM-SUB model approach does not require any simplifying assumptions about steady-state and mixing conditions. The temporal evolution of concentration profiles of volatile and non-volatile species in the particle bulk can be modeled along with surface concentrations and uptake coefficients.
25
ACPD
10, 281–326, 2010Kinetic multi-layer model of aerosol chemistry (KM-SUB)
M. Shiraiwa et al.
Title Page
Abstract Introduction
Conclusions References
Tables Figures
◭ ◮
◭ ◮
Back Close
Full Screen / Esc
Printer-friendly Version
Interactive Discussion
comparison to experimental data and earlier model studies. The effect of bulk diffusion on the rate of uptake and chemical reaction explored for a reference reaction (ozonoly-sis of oleic acid particles) with different sets of kinetic parameters (surface accommoda-tion coefficients, diffusion coefficients, etc.) and particle size. The KM-SUB model was compared with the K2-SUB model and the partial differential equation method, which
5
resulted in fairly good agreement. We show how the KM-SUB model can be used to in-terpret and analyze experimental data from laboratory studies, and how the results can be extrapolated to atmospheric conditions. For liquid oleic acid particles, the chemical half-life of oleic acid molecules with regard to oxidation by ozone is estimated to be ∼1 h. In (semi-)solid particles with low bulk diffusivity, however, the chemical half-life
10
of can increase dramatically (up to hours and days). The results of sensitivity stud-ies with different bulk diffusion coefficients confirm that the phase state of atmospheric particles is highly relevant for chemical transformation and aging (McNeill et al., 2007, 2008; Griffiths et al., 2009; Mikhailov et al., 2009).
Depending on the complexity of the investigated system, unlimited numbers of
15
ACPD
10, 281–326, 2010Kinetic multi-layer model of aerosol chemistry (KM-SUB)
M. Shiraiwa et al.
Title Page
Abstract Introduction
Conclusions References
Tables Figures
◭ ◮
◭ ◮
Back Close
Full Screen / Esc
Printer-friendly Version
Interactive Discussion Appendix A
List of Symbols
Symbol Meaning Unit
αb,Xi bulk accommodation coefficient of Xi
αs,0,Xi surface accommodation coefficient of Xi on an
adsorbate-free surface
αs,Xi surface accommodation coefficient of Xi
δ thickness of bulk layers cm
δXi,δYj effective molecular diameter of Xi and Yj cm
θs sorption layer surface coverage
σs,Xi molecular cross section of Xi in the sorption layer cm2
γXi uptake coefficient of Xi (normalized by gas kinetic
flux of surface collisions)
τd,Xi desorption lifetime of Xi s
ωXi mean thermal velocity of Xi in the gas phase cm s
−1
A(k) outer surface area of bulk layerk cm2
Ass surface area of particle (quasi-static layer) Cb,rd,Xi reacto-diffusive geometry correction factor for Xi
Cg,Xi gas phase diffusion correction factor for Xi
Jads,Xi,Jdes,Xi flux of adsorption and desorption of Xi cm−2s−1
Jcoll,Xi flux of surface collisions of Xi cm
−2
s−1
Jb,rd,Xi reacto-diffusive flux of Xi cm−
2
s−1
Jb,s,Xi,Jb,ss,Yj flux of bulk-to-surface transport of Xi (sorption
layer) and Yj (quasi-static layer)
cm−2s−1
Js,b,Xi,Jss,b,Yj flux of surface-to-bulk transport of Xi (sorption
layer) and Yj (quasi-static layer)
ACPD
10, 281–326, 2010Kinetic multi-layer model of aerosol chemistry (KM-SUB)
M. Shiraiwa et al.
Title Page
Abstract Introduction
Conclusions References
Tables Figures
◭ ◮
◭ ◮
Back Close
Full Screen / Esc
Printer-friendly Version
Interactive Discussion Jbk,bk−1,Xi,Jbk,bk−1,Yj flux of transport from bulk layerk to bulk layer
k−1 for Xi and Yj
cm−2s−1
kb,b,Xi,kb,b,Yj rate coefficient (velocity) of bulk transport of Xi
and Yj
cm s−1
kb,s,Xi rate coefficient (velocity) of bulk-to-surface transport of Xi
cm s−1
kBR,Xi,Yj second-order rate coefficients for bulk reac-tions of Xi with Yj
cm3s−1
kb,ss,Yi rate coefficient (velocity) of bulk-to-surface
transport of Yj
cm s−1
kd,Xi first-order desorption rate coefficient of Xi s−
1
ks,b,Xi first-order rate coefficient for surface-to-bulk
transport of Xi
s−1
kss,b,Yj first-order rate coefficients for surface-bulk
transport of Yj
s−1
kSLR,Xp,Yq second-order rate coefficients for surface layer
reactions of Xpwith Yq
cm2s−1
Ksol,cc,Xi gas-particle partitioning coefficient of Xi
lrd,Xi reacto-diffusive lenght oss rate of Xi and Yj by
reaction in the particle bulk
cm−3s−1
Lb,Xi,Lb,Yj loss rate of Xi and Yj by reaction in the particle bulk
cm−3s−1
Lbk,Xi,Lbk,Yj loss rate of Xi and Yj by reaction in bulk layer
k
cm−3s−1
Ls,Xi,Lss,Yj loss rate of Xi and Yj by surface layer reaction cm
−2
ACPD
10, 281–326, 2010Kinetic multi-layer model of aerosol chemistry (KM-SUB)
M. Shiraiwa et al.
Title Page
Abstract Introduction
Conclusions References
Tables Figures
◭ ◮
◭ ◮
Back Close
Full Screen / Esc
Printer-friendly Version
Interactive Discussion L∗b,X
i,L
∗
b,Yj absolute loss rate of Xi and Yj by reaction in the
particle bulk
s−1
L∗bk,X
i,L
∗
bk,Yj absolute loss rate of Xi and Yj by reaction in bulk
layerk
s−1
L∗s,X
i,L
∗
ss,Yj absolute loss rate of Xi and Yj by surface layer re-action
s−1
n number of bulk layers
Pb,Xi,Pb,Yj production rate of Xi and Yj by reaction in the par-ticle bulk
cm−3s−1
Pbk,Xi,Pbk,Yj production rate of Xi and Yj by reaction in bulk layerk
cm−3s−1
Ps,Xi,Pss,Yj production rate of Xi and Yj by surface layer reac-tion
cm−2s−1
rb particle bulk radius cm
rp particle radius cm
[Xi]g gas phase number concentration of Xi cm−3 [Xi]gs near-surface gas phase number concentration of
Xi
cm−3
[Xi]s surface number concentration of Xi (sorption layer) cm−
2
[Yj]ss surface number concentration of Yj (quasi-static layer)
cm−2
[Xi]bk, [Yj]bk Bulk number concentration of Xi and Yj in the bulk layerk
cm−3
Vb volume of particle bulk
ACPD
10, 281–326, 2010Kinetic multi-layer model of aerosol chemistry (KM-SUB)
M. Shiraiwa et al.
Title Page
Abstract Introduction
Conclusions References
Tables Figures
◭ ◮
◭ ◮
Back Close
Full Screen / Esc
Printer-friendly Version
Interactive Discussion Appendix B
Partial differential equation model (PDE)
Smith et al. (2003) demonstrated that the diffusion and reaction in the bulk can be described by the following partial differential equations:
5
∂[X]b
∂t =
Db,X r2
∂ ∂r
r2∂[X]b ∂r
−kBR,X,Y[X]b[Y]b (B1)
∂[Y]b
∂t =
Db,Y r2
∂ ∂r
r2∂[Y]b ∂r
−kBR,X,Y[X]b[Y]b (B2)
where X=O3and Y=oleic acid. The first term describes diffusion based on the Fick’s
law and the second term describes chemical reaction in the bulk. Note that this par-tial differential equation (PDE) method can only simulate the processes in the bulk
10
and not coupled with surface processes. In solving these PDE equations, several assumptions are required as boundary conditions (Smith et al., 2003): 1) the con-centration of the near-surface bulk is fixed over time, 2) the flux of X at the core is zero (∂[X]b/∂r|r=0=0), 3) the flux of Y at both near-surface bulk and core is zero
(∂[X]b/∂r|r=rp=∂[X]b/∂r|r=0=0). PDE model simulations were performed by numeri-15
cally solving the partial differential equations with Matlab software (PDEPE solver). We investigate large particles with a radius of 1.0 µm as investigated by Smith et al. (2003), and we compare the KM-SUB results (n=200) to the results of the PDE model. The gas phase ozone concentration was set to [X]g=[X]gs=7.0×10
13
cm−3 (cor-responding to 2.8 ppm at 1013 hPa and 298 K). The initial surface and bulk
concentra-20
tions of ozone (X) were set to [X]s,0=[X]bk,0=0, and the initial surface and bulk
ACPD
10, 281–326, 2010Kinetic multi-layer model of aerosol chemistry (KM-SUB)
M. Shiraiwa et al.
Title Page
Abstract Introduction
Conclusions References
Tables Figures
◭ ◮
◭ ◮
Back Close
Full Screen / Esc
Printer-friendly Version
Interactive Discussion
KM-SUB, the PDE model depends on the assumption of a fixed ozone concentration in the near surface bulk. Smith et al. (2003) had assumed solubility saturation according to Henry’s law. In case of fast reaction, however, chemical loss leads to a substantial decrease and lower value of the actual ozone concentration. For comparability, the concentration of ozone in the near-surface bulk of the PDE model was set to a value of
5
5.0×1013cm−3, which is similar to the value calculated by KM-SUB.
Figure A1 shows the concentration profiles of ozone (top) and oleic acid (bottom) ob-tained by simulations with KM-SUB (left) and with the PDE model (right). The diffusion of O3into the bulk was very slow due to the large particle diameter, so that there was
a large concentration gradient of O3. The concentration of O3at the core remains small
10
(<103cm−3) over the reaction time considered. Oleic acid showed also a concentration gradient, which was due to the O3 concentration gradient and a slow diffusion coeffi
-cient of oleic acid (Db,Y=10
−10
cm2s−1). If a larger Db,Y of 10
−7
cm2s−1 was used in the simulation, the concentration of oleic acid was homogeneous throughout the bulk, which was consistent with the results reported by Smith et al. (2003).
15
The KM-SUB and PDE methods yield very similar results, but the concentration gra-dients for both O3 and oleic acid were slightly steeper in the PDE model. A possible
reason for the difference may be that the PDE model requires the assumption of a fixed ozone concentration in the near surface bulk and zero flux values at the surface and at center of the particles as specified above (boundary conditions). Another possible
20
reason for deviations is the estimation of bulk transport velocities (kb,b). If we assume kb,b=Db/δinstead of Eqs. (35) and (36), the KM-SUB results become nearly identical