Eurasian Journal of Business and Management, 4(4), 2016, 71-80 DOI: 10.15604/ejbm.2016.04.04.007
EURASIAN JOURNAL OF BUSINESS AND
MANAGEMENT
www.eurasianpublications.com
P
ERFORMANCE
A
NALYSIS OF
M
AJOR
A
IRLINE
C
OMPANIES IN
UAE
WITH
R
EFERENCE TO
P
ROFITABILITY
,
L
IQUIDITY
,
E
FFICIENCY
,
E
MPLOYEE
S
TRENGTH AND
P
RODUCTIVITY
Indrani Hazarika
Dubai Women’s College, United Arab Emirates Corresponding author: Email: indrani.hazarika@hct.ac.ae
Bistra Boukareva
Dubai Women’s College, United Arab Emirates Email: bboukareva@hct.ac.ae
Abstract
The demand for air transport has been consistently increasing in UAE and has made significant growth in the aviation sector in terms of expansion and modernization. Within Dubai’s services sector, transport ranks first accounting for 14.8% of Dubai’s GDP in 2014.As per the Economics Report commissioned by Emirates and Dubai Airports, aviation sector is expected to contribute $53.1 billion to Dubai’s economy, 37.5 per cent to its GDP and will support over 750,000 jobs by 2020. The present study makes a comparative analysis of the top airline companies in UAE – Emirate Airlines and Air Arabia in terms of profitability, liquidity, efficiency and also Etihad Airways on employee strength and productivity from 2010 to 2014.Dubai’s aviation sector is projected to support over 1,194,700 jobs by 2030 and the total economic impact on UAE is expected to increase to $88.1 billion. The financial performance indicators of Emirates Airlines and Air Arabia has been compared and further analyzed to see if there is any significant impact of the macroeconomic indicators on the financial performance of the airline companies. Companies can create wealth either by increasing profit per employee or by increasing the number of employees earning such profits, or both.
Keywords: Financial Performance, Aviation Sector, Employee Strength, Productivity, Liquidity, Efficiency
1. Introduction
Hazarika and Boukareva / Eurasian Journal of Business and Management, 4(4), 2016, 71-80
72
The aviation industry in the UAE has been recording an impressive growth over the years and is expected to grow significantly in the run up to EXPO 2020.Oil prices crashed by 40 per cent in the second half of 2014 and the downward trend is still continuing which brings to an end the four year period of relative price stability. Lower oil prices will lead to contraction in the oil-related sector but it will have a positive boost in retail, tourism and the transportation sectors. The growth in international passengers at Dubai’s main airport over the past decade has also given other industries from supply chain to hospitality and trade a boost, and the economy is likely to rely on the aviation sector’s expansion this year even after the recent plunge in oil price.
2. Aviation in UAE
In a highly competitive aviation industry, UAE aviation sector has been recognized for prioritizing innovation, safety, airspace management, human skills, and infrastructure and customer satisfaction. The country’s air navigation system is based on the pillars of safety, reliability and efficiency. Significant growth and improvements have been observed in UAE aviation sector in terms of fleet addition or network expansion by collaboration with major airline companies either through acquisition of stakes or code sharing agreements. Emirates has signed a 10 year partnership agreement with Qantas and Etihad is intending to expand its international collaboration by purchasing minority shares in airlines from countries stretching from Germany to Australia and entering into code sharing agreements. UAE aviation sector has signed an air services agreement with Italy to improve bilateral air relations, provide growing opportunities to the national airlines and promote economic cooperation and international trade exchange between the countries (Ameinfo, 2016). UAE occupies the second position in terms of open skies agreement signed with other countries of the world, improving the overall connectivity of the country. In 2013, the aviation sector provided 21 percent of the emirate’s total employment by supporting 416,500 jobs and contributed US$26.7 billion to Dubai’s GDP. Dubai is one of the world’s busiest airports with increasing number of visitors. In 2015, 78 million passengers passed through Dubai International Airport Terminals and 23 million passengers in Abu Dhabi International Airport; passenger traffic is expected to stand at 103.5 million by 2020 at Dubai according to Dubai Airports Authority (Kassem, 2015).
3. Literature Review
Hazarika and Boukareva / Eurasian Journal of Business and Management, 4(4), 2016, 71-80
73
Dubai Airports, Dubai Duty Free, governing authorities and other aviation partnerships, generated $16.5 billion in terms of gross value added (GVA) in 2013. As per the Economics Report commissioned by Emirates and Dubai Airports, aviation will contribute $53.1 billion to Dubai’s economy, 37.5 per cent to its GDP and will aid over 754,000 jobs by 2020.It is estimated that Dubai’s aviation sector will sustain over 1,194,700 jobs by 2030, while the total economic impact on the emirate is expected to grow to $88.1 billion. Air Arabia, a Sharjah based aviation company; also recorded a strong increase in passenger traffic and reported a 12 percent growth carrying over 6.8 million customers in 2014 (Air Arabia, 2014).
4. Employee Strength in Emirates Group, Etihad Airways and Air Arabia 4.1. Employee Strength in Emirates Group
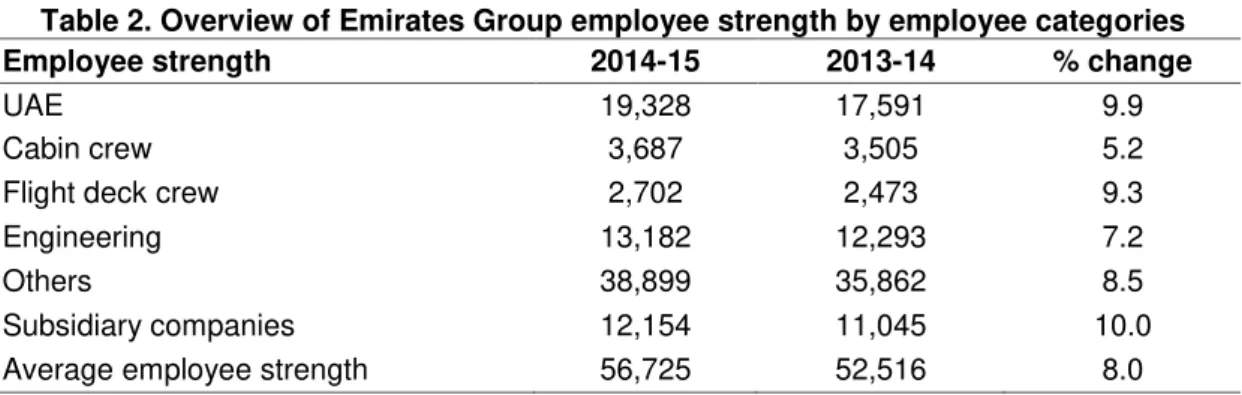
The Emirates Group is one of the major employers in Middle East with a turnover of approximately US$18.4 billion in 2014. The airlines employ more than 62,000 employees across all its 50 business units and associated firms with 8,600 new staff joined to the Group in 2014, increasing the staff strength to 84,000(Table1)(Emirates Group, 2015). The airline reported 9 per cent increase in capacity from 2014 to 2015. As a result, the average employee strength in Emirates Airlines increased by 8 percent and in Dnata by 19.4 percent. The airline’s employee productivity related key performance indicators were persistently steady in line with growth, demonstrating the impact the industry growth had on other business areas. The Emirates Group subsidiaries such as Emirates Cargo, Alpha Flight Group Ltd., Emirates Joint Ventures, Marhaba, Congress Solutions International, Arabian adventures and Emirates One & Only Wolgan Valley, to name a few, recorded the biggest employee strength growth of 10 per cent for the same period (Table 2).
Table 1. Emirates Airlines employee strength (2006 - 2015)
Key ratios 2015 2014 2013 2012 2011 2010 2009 2008 2007 2006
Average employee strength-EK
56,725 52,516 47,678 42,422 38,797 36,652 35,812 30,177 26,228 22,125
Average employee strength-airline
44,571 41,471 38,067 33,634 30,258 28,686 28,037 23,650 20,273 17,296
Source: The Emirates Group (2014, 2015)
Table 2. Overview of Emirates Group employee strength by employee categories
Employee strength 2014-15 2013-14 % change
UAE 19,328 17,591 9.9
Cabin crew 3,687 3,505 5.2
Flight deck crew 2,702 2,473 9.3
Engineering 13,182 12,293 7.2
Others 38,899 35,862 8.5
Subsidiary companies 12,154 11,045 10.0
Average employee strength 56,725 52,516 8.0
Hazarika and Boukareva / Eurasian Journal of Business and Management, 4(4), 2016, 71-80
74
Figure 1. Emirates Airlines Revenue per Airline Employee ('000') (2006 - 2015)
Source: The Emirates Group (2014, 2015)
To support the group’s planned growth, Emirates Group expects to hire 11,000 new employees for all business divisions, including Emirates Airlines and Dnata’s, in 2015-16 (Emirates Group, 2015).Revenue per airline employee ratio is a fundamental indicator for company’s productivity. The ratio is derived by dividing cumulative revenues received in the last twelve months, by the number of employees. Revenue per employee displays how much is the contribution a single employee generates during the twelve months period to the total sales of the company (Figure1).
4.2. Employee Strength in Etihad Airways
Etihad Airways reported impressive 27 per cent increase in employee strength from 2012 to 2013. In addition, the organization has dedicated its efforts to supporting exponential growth in its Emirati talent since 2007, and has witnessed a 30 per cent year-on-year increase in headcount to date (Etihad Airways, 2013). The core economic growth contributions are classified into a number of key areas: direct (within Etihad), indirect (company’s purveyors), impelled (referring to spending of direct and indirect employees) and catalytic (impacts on other industries). Etihad Airways made an indirect economic contribution of US$1.7 billion and established an additional 23,373 jobs in 2013. An induced GDP contribution of US$2.6 billion and 22,296 additional jobs were attributed to money spent during 2013 by Etihad Airways staff and its partners. Etihad Airways played an important role in improving the air networks joining Abu Dhabi to other major and emerging economies around the world. The airline’s expanding network was a key factor in encouraging businesses to participate in the Emirate’s and the UAE industries. These accomplishments provided an immense participation to the economy growth of nearly US$9 billion, and buoyed close to 118,484 jobs (Etihad Airways, 2013).In addition 1,468 Emirati employees were hired by Etihad airline in 2013 representing a 17 per cent increase in comparison to 1,254 employed in 2012. The number of Emirati employees at the end of 2014 increased by more than 37 per cent to 2,017, recording a best ever year for hiring UAE nationals. In 2014, Etihad Airways’ core operations and capital expenditure contributed a total of US$ 6.4 billion to Abu Dhabi’s economy and abetted in creating over 67,000 new jobs in total (Hogan, 2015). Etihad Airways employed 24,206 people comprised of 144 nationalities by end of 2014. Etihad has 24, 206 employees from 144 Nationalities, servicing 110 aircrafts, flying to 111 destinations (Jones, 2015).
1,285
1,431
1,625
1,492 1,459
1,738 1,796
1,868 1,938 1,939
0 500 1,000 1,500 2,000 2,500
Hazarika and Boukareva / Eurasian Journal of Business and Management, 4(4), 2016, 71-80
75
Table 3. Etihad Airways Operational and Performance Highlights
Etihad 2013 2012 % change
Revenue Passenger Km 47.7 billion 55.5 billion 16
Passengers 11.5 million 10.3 million 12
Aircraft 89 70 27
Core Airline Employees 13,535 10,656 27
Net Profit 62 million (US$) 42 million (US$) 48
Source: Etihad Airways (2013)
4.3. Employee Strength in Air Arabia
Launched in October 2003, Air Arabia is the first and largest cost effective airlines in MENA (Middle East and North Africa) region and most recently is operating a total fleet of 42 (owned & leased) Airbus 320s. Air Arabia had 2,302 employees in 2013 which number has grown during the following years. The airline has reported an industry record for average head count number servicing single aircraft: 49 employees / 1 Aircraft (Air Arabia, 2015).
4.4. Development Opportunities
Hazarika and Boukareva / Eurasian Journal of Business and Management, 4(4), 2016, 71-80
76 5. Objective of the Study
The present study compares the financial performance of two major airline companies in UAE; Emirates Airlines and Air Arabia with reference to profitability, liquidity and efficiency. The study has been also extended to Etihad Airways along with Emirates Airlines & Air Arabia in terms of employee strength and productivity. The present study also examines the impact of revenue of the major airline companies on GDP of UAE.
5.1. Financial Analysis
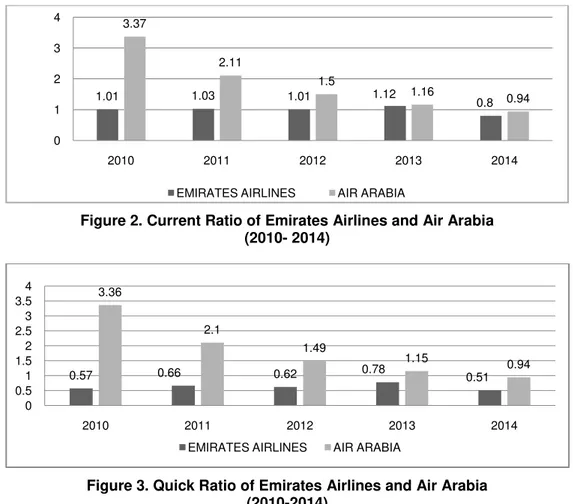
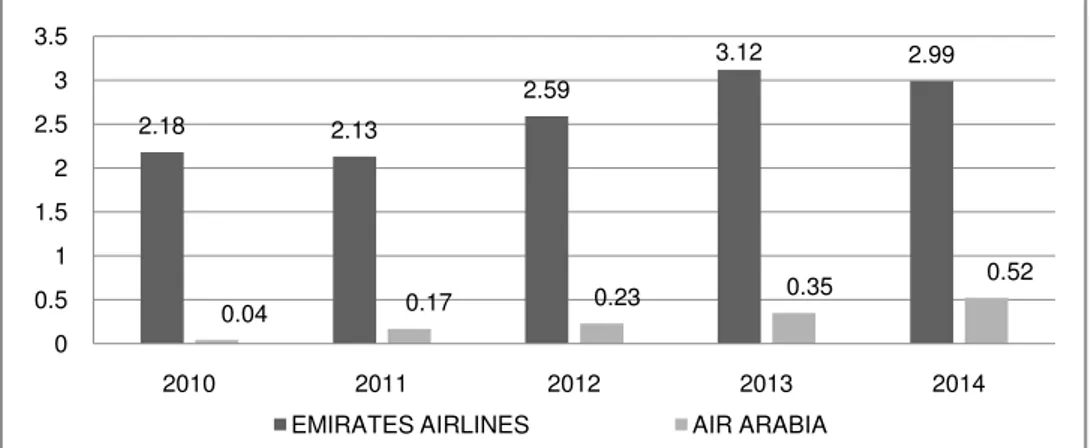
The study reveals the financial health and liquidity position of Emirates Airlines and Air Arabia from 2010 to 2014 in terms of debt equity, current ratio and quick ratio. Current ratio measures a company's ability to meet short-term and long-term financial commitments with its current assets whereas Quick ratio measures a company’s ability to meet its short-term liabilities with its most liquid assets and is an indicator of a company’s short-term liquidity. Air Arabia is relatively in a better position in terms of current and quick ratio (Figure 2and 3).Debt/Equity Ratio (D/E Ratio) measures a company's financial leverage and is computed by dividing a company’s total liabilities by its stockholders' equity. The ratio indicates how much debt a company is using to finance its assets. The amount of debt finance utilized by Air Arabia in comparison to Emirates Airlines is relatively low (Figure 4).
Figure 2. Current Ratio of Emirates Airlines and Air Arabia (2010- 2014)
Figure 3. Quick Ratio of Emirates Airlines and Air Arabia (2010-2014)
1.01 1.03 1.01 1.12
0.8 3.37
2.11
1.5
1.16
0.94
0 1 2 3 4
2010 2011 2012 2013 2014
EMIRATES AIRLINES AIR ARABIA
0.57 0.66 0.62 0.78 0.51
3.36
2.1
1.49
1.15
0.94
0 0.5 1 1.5 2 2.5 3 3.5 4
2010 2011 2012 2013 2014
Hazarika and Boukareva / Eurasian Journal of Business and Management, 4(4), 2016, 71-80
77
Figure 4. Debt Equity Ratio of Emirates Airlines and Air Arabia (2010-2014)
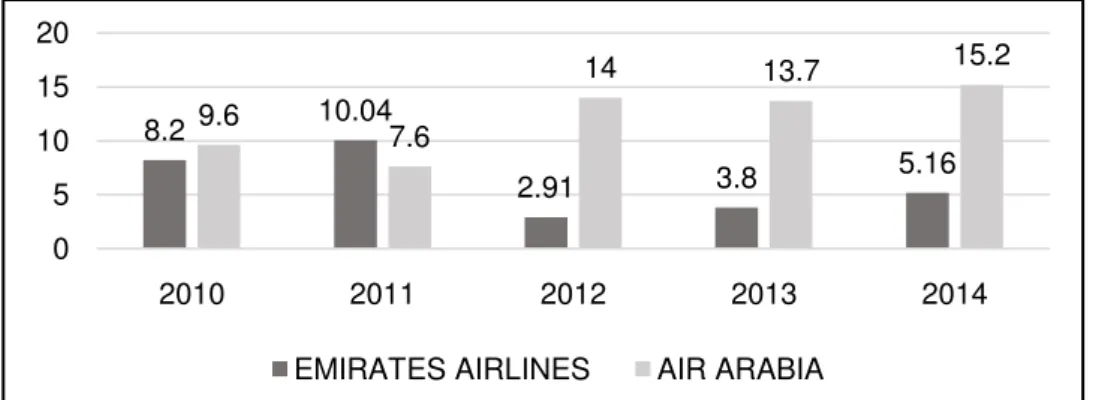
5.2. Profitability Analysis
Profitability ratios are used to gauge the company’s financial performance and ability to generate earnings as compared to its expenses. The operating margin ratio is a profitability ratio that measures what percentage of total revenues is made up by operating income. Air Arabia records a higher Net Profit Margin (Figure 5) and Operating Margin ratio (Figure 6) when compared to Emirates Airlines. In 2014, 15.20 % of Air Arabia’s total revenues have been made up by operating income against 5.16% of Emirates Airlines. The return on assets ratio or ROA indicates how efficiently a company can manage its assets to generate profits during a period. The return on equity ratio or ROE is a profitability ratio that measures the ability of a firm to generate profits from its shareholders investments in the company. Air Arabia has efficiently managed its assets and could generate more profit from shareholders’ investment in comparison to Emirates Airlines. The return on assets of Air Arabia stands at 5.54% whereas ROA of Emirates Airlines in 2014 was 3.20% (Figure 7)and Return on Equity of Air Arabia was higher by 3% and stands at 13% at the end of 2014 (Figure 8).
Figure 5. Net Profit Margin of Emirates Airlines and Air Arabia in percentage (2010-2014)
2.18 2.13
2.59
3.12 2.99
0.04 0.17 0.23
0.35 0.52
0 0.5 1 1.5 2 2.5 3 3.5
2010 2011 2012 2013 2014
EMIRATES AIRLINES AIR ARABIA
8.14 9.91
2.41 3.12 3.94
14.7
11.05
14.26 13.21 14.83
0 5 10 15 20
2010 2011 2012 2013 2014
Hazarika and Boukareva / Eurasian Journal of Business and Management, 4(4), 2016, 71-80
78
Figure 6. Operating Margin of Emirates Airlines and Air Arabia in percentage (2010-2014)
Figure 7. Return on Assets of Emirates Airlines and Air Arabia in percentage (2010-2014)
Figure 8. Return on Equity of Emirates Airlines and Air Arabia in percentage (2010-2014)
6. Research Methodology
The study is based on the financial data from the annual reports of the two airline companies from 2010 to 2014. In the present study the impact of the revenue of Emirates Airlines and Air Arabia on the macroeconomic factors of UAE was tested through simple regression analysis.
8.2 10.04
2.91 3.8 5.16
9.6
7.6
14 13.7 15.2
0 5 10 15 20
2010 2011 2012 2013 2014
EMIRATES AIRLINES AIR ARABIA
6.37
8.26
1.95 2.41 3.2
4.92 3.99 5.54 4.83 5.54
0 2 4 6 8 10
2010 2011 2012 2013 2014
EMIRATES AIRLINES AIR ARABIA
20
26
7 10
13
6 5 8 8 10
0 5 10 15 20 25 30
2010 2011 2012 2013 2014
Hazarika and Boukareva / Eurasian Journal of Business and Management, 4(4), 2016, 71-80
79 6.1. Research Questions
The first research question analyzed: Whether the revenue of Emirate Airlines and Air Arabia has an impact on the GDP of UAE. The second research question addressed: Whether UAE population has an influence on the revenue of Emirates Airlines and Air Arabia.
6.2. Research Design
The study is based on the secondary data available in the annual reports of Emirates Airlines and Etihad Airways and growth and profitability ratios of Air Arabia.
6.3. Data Analysis
The data has been analyzed with the help of Data Analysis in Excel using Significance F and R square in simple regression analysis. The independent variables for the first research question are revenue generated by the airline companies and the dependent variable is the UAE GDP. For the second research question which addresses whether UAE population has an influence on the revenue of Emirates Airlines and Air Arabia; the independent variable is the UAE population from 2010 to 2014 and the dependent variable is the revenue generated by the airline companies followed by 9 observations.
6.4. Findings
According to its financial results released recently, Emirates Airline, which posted a profit of $1.25 billion, revenue rose 7% to $24.2 billion - employs 56,725 members of staff, a rise of 8% year-on-year. There is a very close correlation between the employee strength and the revenue per employee. Aviation services firm Dnata, which recorded a profit of $247 million, on the back of a 36% rise in revenue to $2.8 billion, employs a total of 27,428 staff, a year-on-year increase of 19.4%.Dnata reported profit earned by increasing the number of employees almost double than the number of staff increased. By increasing the workforce by 37.5% between 2013 and 2014, Etihad airways recorded 52.1% profit growth. 92% of employees indicated they were willing to go beyond the normal requirements in order to help Etihad Airways succeed, no doubt a key measure in the airline's overall winning performance in the market. Employee engagement was measured at 18% above the global average which is considered as a benchmark measure and key indicator of employees’ commitment (Etihad Airways, 2013).Findings reveal that there is a statistically significant relationship between the revenue of the major airline companies in UAE and GDP. As per the regression output R is squared at 90 percent which is a very good fit and significance F is 0.005 at 95% confidence level. The correlation coefficient between the independent variable: revenue of Airline Companies and dependent variable UAE GDP is 0.939 for Emirates Airlines, 0.936 for Air Arabia and 0.946 for Etihad Airways. The correlation coefficient between UAE population and GDP is 0.855.The correlation coefficient between UAE population and the revenue of Airline Companies stands at 0.906 for Emirates Airlines, 0.908 for Air Arabia and 0.87 for Etihad Airways. The statistical analysis show that UAE population has a significant influence on the revenue generated by the airline companies
7. Conclusion
Hazarika and Boukareva / Eurasian Journal of Business and Management, 4(4), 2016, 71-80
80
Within transportation sector worldwide, airline Industry has achieved highest revenue per employee and currently stands at 34. There are four factors that contributed to establishing the aviation companies as employer of choice in UAE: Organizational Culture, Financial Benefits, Development Opportunities and Corporate Social Responsibility.
References
Abbas, W., 2015. Dubai set for next cycle of growth: 5 sectors will drive economy. Emirates 24/7, Business, Monday, March 30, 2015 [online]. Available at: <http://www.emirates247.com/business/economy-finance/dubai-set-for-next-cycle-of-growth-5-sectors-will-drive-economy-2015-03-30> [Accessed 20.10.2015].
Air Arabia, 2014. Annual report 2014 [online]. Available at: <www.airarabia.com> [Accessed 6.10.2015].
Air Arabia, 2015. Investor Presentation 1st quarter 2015 [online]. Available at: <http://www.airarabia.com/sites/airarabia/files/Air%20Arabia%20IR%20Presentation%2 0Q1%202015.pdf> [Accessed 5.10.2015].
Ame Info, 2016. UAE aviation sector makes quantum leap [online]. Available at: <http://ameinfo.com/transportation/uae-aviation-sector-makes-quantum-leap>
[Accessed 30.6.2016].
Emirates Group, 2015. Keeping a steady compass, UAE: The Emirates Group annual report 2014 - 2015. [online]. Available at: <http://www.theemiratesgroup.com/english/facts-figures/annual-report.aspx> [Accessed 6.10.2015].
Etihad Airways, 2013. Building the future, UAE: Etihad Airways annual report 2013 [online]. Available at:
<http://resources.etihadairways.com/etihadairways/images/E_Book/HTML/AnnualRepor t2013>[Accessed 6.10.2015].
Gulf Business, 2014.Dubai's aviation sector to support over one million jobs by 2030 [online]. Available at: <http://www.gulfbusiness.com/articles/industry/dubais-aviation-sector-to-support-over-one-million-jobs-by-2030/> [Accessed 15.10.2015]
Jones, D., 2015. Sky’s the limit: Etihad’s emiratisation journey [online]. Available at: <http://www.changeboard.ae/content/5157/skys-the-limit-etihads-emiratisation-journey/> [Accessed 11.10.2015].
Hogan, J., 2015. Fourth consecutive year of net profit, Up 52 per cent to US$ 73 Million [online]. Available at: <http://www.etihad.com/en-ae/about-us/etihad-news/archive/2015/etihad-airways-posts-fourth-consecutive-year-of-net-profit/> [Accessed 10.10.2015].
Kassem, M., 2015. Aviation expansion to give some lift to UAE economic growth [online]. Available at: <www.thenational.ae/business/aviation/aviation-expansion-to-give-some-lift-to-uae-economic-growth> [Accessed 11.10. 2015].
Oxford Economics Report, 2014. Quantifying the Economic Impact of Aviation in Dubai [online]. Available