PORTUGUESE JOURNAL OF MANAGEMENT STUDIES, VOL. XII/, NO. 1, 2008
School of Economics and Management
TECHNICAL UNIVERSITY OF LISBON
G
EFFICIENCY ANALYSIS OF MAINTENANCE AND OUTAGE REPAIR
IN ELECTRICITY DISTRIBUTION
Thomas Weyman-Janes
Department of Economics, Loughborough University, UK
Julia Boucinha
EDP Distribuil$aO, Lisboa, Portugal
Catarina Feteira lmkio
EDP Distribuil$iiO, Lisboa, Portugal
Abstract
For several years electricity distribution companies have been using efficiency and productivity analysis in the form of data envelopment analysis and stochastic frontier analysis to analyse their operations. This reflects both market forces and responses to regulatory incentives. However we show that there is a significant difference in purpose and implementation between public regulatory benchmarking and internal company benchmarking. In this paper we use a variety of data envelopment analysis models to examine data on maintenance and outage repair on the electricity distribution system during 2004 -2005 in Portu-gal. In particular we examine the relationship between orientated and non-orientated models, and radial and non-radial analysis. We develop performance measures for the regional electricity networks operated in Portugal by EDP Distribui'<ao, and we discover very close relationships among the performance ran kings under different models, fulfilling widely-used consistency conditions for performance modeling. The paper uses the experience of this company example to draw some lessons about how performance measurement can be implemented within a company, in contrast to the usual objective of regulatory benchmarking procedures.
Keywords: data envelopment analysis, electricity distribution, performance measurement
PORTUGUESE JOURNAL OF MANAGEMENT STUDIES, VOL. XII/, NO. 1, 2008
THE MOTIVATION FOR INTERNAL COMPANY BENCHMARKING {ICB) WITH DATA ENVELOPMENT ANALYSIS
Data envelopment analysis is both a management benchmarking tool and a procedure for estimation of the relative technical and cost efficiency of production units. While most of the academic and journal literature on data envelopment analysis emphasizes its role in estimation of economic models for both theoretical and policy purposes, in this paper we shall emphasize the role of data envelop-ment analysis as a manageenvelop-ment benchmarking tool in part of a large national corporation.
Benchmarking companies and their branches or divisions, not-for-profit agen-cies, government organizations, even whole regions and nations has become a major activity in economic and management consultancy, and in the direction of corporate and national policy. The objective is to carry out performance measure-ment of the activities of different service providers and producers. Why do we carry out Performance Measurement? Owners of companies, senior managers, Regulators, Government ministers, and citizens and voters often need a service which can only be provided by contracting or paying someone else to do it. This is different from buying a competitively priced product in a market. Each of us occu-pies the position of a principal who needs the service of an agent to complete the task in question. However the agent's performance may be open to doubt be-cause:
• The agent is better informed
• The agent has his/her own objectives, • The agent may be risk averse.
• The agent's actions may be unobservable.
• The measured outputs or costs of the organization are the result of both the agent's efforts and random factors, but the principal is unable to dis-tinguish amongst these.
This is an idea strongly associated with the work of Harvey Leibenstein on X-efficiency. Leibenstein, and writers such as Mancur Olson, also identified other impor-tant factors in under-performance such as lack of constraint concern by managers, missing markets, poorly organized national policies towards markets, the failure of collective action, excessive bureaucracy, corruption and protection of privileged posi-tions. In these circumstances, it is essential to develop ways of measuring the comparative performance using real world data on inputs, outputs, values and costs. Performance measurement is the study of such methods and two of the dominant and most successful approaches to the rigorous analysis of comparative performance are data envelopment analysis and stochastic frontier analysis.
PORTUGUESE JOURNAL OF MANAGEMENT STUDIES, VOL. X/11, NO. 1, 2008
Data envelopment analysis has been developed and refined over 50 years of sustained research since the pioneering study of Michael Farrell, first published in 1957. It is a data-intensive procedure using the analytical tools of mathematical programming and econometrics. When data envelopment analysis is applied as a benchmarking tool in a large national corporation, several distinct features arise.
1. the operating environment is partly endogenous because it reflects a com-mon company approach to management
2. incentives are important, both implicit or latent incentives reflecting the status quo and nascent explicit incentives arising out of responses to the capital market and regulatory controls on performance
3. modeling is an iterative part of the management process, since the deep-est knowledge of the company's operating environment lies within the company itself
4. the choice of modeling strategy is different from that in regulated or policy orientated environments, particularly the necessity to maximize the dis-cretionary power of the estimators in order to detect potential weak per-formance
5. data are consistent and internally audited and may be cleaner in some respects than normal public domain data.
DATA ENVELOPMENT ANALYSIS APPLICATIONS IN EDP DISTRIBUI<;AO
The specific example we use is EDP Distribui<;ao, the network operator in Portugal. The company was state-owned until the late 1990s and then privatized in a gradual process. EDP Distribui<;ao is part of the single European market in energy and therefore is responsive to developments in the wider EU market for electricity services. The company is also subject to regulation by ERSE, the latory authority in Portugal -for an analysis of regulatory benchmarking in regu-lated companies, see Weyman-Jones et al (2006).The regulatory framework has evolved from a very close tariff specification to an incentive based mechanism related to CPI-X price capping1, but with a considerable residual oversight by the regulatory authority. EDP Distribui<;ao forms part of a publicly quoted company that is now partly owned by government and partly by private investors with shares traded on the Stock Exchange in Portugal. EDP Distribui<;ao has around 5. 7 mil-lion customers, of whom about 22,000 are on the medium to high voltage
distri-1 CPI-X price capping confines the company's revenue charges to a maximum rate of increase determined by the
PORTUGUESE JOURNAL OF MANAGEMENT STUDIES, VOL. XII/, NO. 1, 2008
bution network. It has shed almost half its workforce since the privatization pro-cess began, while the customer base and electricity demand have both been growing steadily.
EDP Distribui<;ao has been using efficiency and productivity analysis in the form of data envelopment analysis (DEA) and stochastic frontier analysis (SFA) to analyse its operations for a number of years. This reflects both market forces and responses to regulatory incentives. The incentive regulation of ERSE and the de-mands of the equity owners are the two driving forces behind the desire to use internal company benchmarking, suggesting that both Government policy and the capital market are able to work together into implementing performance measure-ment and enhancemeasure-ment. The managemeasure-ment model for the use of data envelopmeasure-ment analysis in EDP Distribui<;ao suggests useful lessons for other regulated companies. For international benchmarking purposes, it carries out comparisons between Euro-pean distribution network operators (DNOs). Within the company, efficiency benchmarking is used to improve performance in response to regulatory decisions.
To implement internal company benchmarking (ICB) in EDP Distribui<;ao a small group of company economists with some external consultancy expertise began the modeling exercise in 2002-3. Initially the objective was to understand the benchmarking process behind incentive regulation adopted by ERSE between 2002 and 2005. This led to studies at the whole company level in comparison with other European regulated utilities which had also been through a regulatory benchmarking process, and these studies comprised both data envelopment analysis and stochastic frontier analysis. Following this initial work and the impact of the first ERSE regulatory review, the company's attention turned to ICB to enhance performance in between regulatory reviews. For this purpose, comparisons of per-formance are made between different network regions across the Portuguese main-land; these comprisel4 network areas and 40 regions within those network areas.The structure of the process is described in chart 1. This is an interactive and iterative process which depends heavily on sharing best practice and, in par-ticular, noting where performance has been exceptional, especially in cases where some branches have perceived that there are incentives to improve performance which have not been noticed by other branches. Three features of the model selection process are important. A key aspect of this part of the modeling process is that maximum discriminatory power in assessing performance is helpful to the senior management, and consequently there is a desirable bias towards convex rather than non-convex models. It is also the case that some branches may have greater scope than others for economizing on certain inputs or expanding certain outputs; this leads to a desirable bias towards slack-based measures of perfor-mance rather than radial measures. Finally, discretionary control over inputs or outputs may not be identical for different branches, and this may give a desirable bias towards non-orientated or directional distance measures of efficiency.
PORTUGUESE JOURNAL OF MANAGEMENT STUDIES, VOL. XII/, NO. 1, 2008
CHART 1
Snapshot of an iterative internal company benchmarking (ICB) procedure
Senior management constructs ICB project
DEA team collects preliminary data Check with engineering branches to confirm variables by the Model
Network Analysis (MNA)
DEA team presents initial results to senior management as measures of performance. Incentive mechanisms and company structure
reviewed
Engineering branches suggest relevant variables. If not already
part of the company database, they are investigated and audited
Engineering branches participate to provide commentary on the estimates.
Responses to incentives by peer groups and comparators are noted
and strategies evolve.
An important consequence of introducing these biases into the efficiency measures, which are helpful to senior management in understanding the flexibility of the company, is that they might have an offsetting undesirable bias in ranking the different branches' performances, and therefore great care needs to be exer-cised if ex-post reward and incentive mechanisms are based on the relative perfor-mances. To put this another way, we can argue that finding the maximal differ-ences in performance by using least close envelopment of the data rather than closest envelopment of the data will help senior management to discover the ex-ante incen-tives that exist in the current management structure. These should not be blindly implemented as ex-post incentives after the performance has been measured.
PORTUGUESE JOURNAL OF MANAGEMENT STUDIES, VOL. XII/, NO. 1, 2008
EDP DISTRIBUI~Ao DATA ON MAINTENANCE AND OUTAGE REPAIR.
The sample which is used in this paper to exemplify the ICB process in EDP Distribuic;ao covers 40 network areas within the 14 separate EDP Distribuic;ao regions, observed over the years 2004 and 2005. The inputs reflect the resources used
• Maintenance and Outage Repairing Costs (OPEX) • Quality of Supply Indices:
1. Supply Interruptions (Minutes of lost load) 2. Complaints per Client
3. Number of Incidents (LV and Clients' Installations)
The outputs reflect the activity level of the company in each network and apply to both the low voltage (LV) and medium voltage (MV) networks.
• Clients (LV+MV)
• Network Lines Length (LV+MV)
Negative outputs could be incorporated into the model by considering Qual-ity of Supply variables as negative outputs instead of inputs.
An input orientation is adopted because it is recognised that the networks will be constrained to minimise input usage subject to meeting exogenous output targets. One output is customer services, which are proxied by the numbers of customers served in each area by each distribution network. Network line length is an exogenous operating characteristic variable reflecting the maintenance and repair load on the network. In the input orientation it is treated as an additional output. This reflects the approach used in the United Kingdom and elsewhere in benchmarking the performance of electricity utilities, see Jamasb and Pollitt (2003). Strictly, Length of network is a measure of the production unit's capital input. For example the production correspondence in electricity distribution can be modelled generally as:
Inputs: labour, materials, length of network, transformer capacity Costs: labour and materials expenditure, capital expenditure Outputs: energy delivered, customers served
Revenues: tariff income, charges for connections, and customer services.
PORTUGUESE JOURNAL OF MANAGEMENT STUDIES, VOL. XII/, NO. 1, 2008
function analysis has been treated in many regulatory studies as an exogenous variable in the short run where the focus is on operating expenditures, in the same way as output is treated as an exogenous variable. Consequently it has come to be widely regarded, perhaps wrongly, as an output.
SOME THEORETICAL ISSUES IN DEA
In this section of the paper, we review some of the modeling choices that are possible for internal company benchmarking. Recall our discussion of the motiva-tion for the benchmarking exercise. This is to aid the formamotiva-tion of management information and it is explicitly not designed for allocation of ex-post rewards. Con-sequently, there is less concern with finding the true production set and frontier and more concern with discovering different possibilities within the data. Among some of the problems that can be found in DEA modelling at the level of a particu-lar company and its branches for ICB purposes are:
o Convex or non-convex production structure o Directions of improvement;
o Undesirable outputs and inputs, and negative data;
o Efficiency measures which are dependent on units of measurement in-stead of % scores
We review these different models of performance measurement before apply-ing them to the case of EDP Distribuigao2• A basic alternative to the conventional DEA methodology is the free disposal hull FDH method suggested by, among others, Desprins, Simar and Tulkens (1984). DEA assumes the convexity of the observed production set and consequently that the efficient frontier is the bound-ary of a convex set. This assumption is fundamental of course because DEA is based on the argument that the efficient frontier should be constructed from com-binations of the observations even where such points represent hypothetical rather than actual firms. It is the FDH model which restricts the frontier to be drawn only from actual observations. As a result the FDH estimating set is not necessarily convex.
How serious is this assumption of convexity imposed by DEA? Opinion is divided. Consider the danger of assuming the true production possibility set is convex. DEA will assume the feasibility of unobserved technological choices which
2 A wide range of software applications is available for DEA. These include Warwick DEA, EMS (by Holger
PORTUGUESE JOURNAL OF MANAGEMENT STUDIES, VOL. XII/, NO. 1, 2008
may not be justified if the theoretical production possibility set takes the non-convex rather than non-convex form.
Strictly therefore theory does not require convexity of the theoretical produc-tion possibility set, although it is assumed by DEA methods for the empirical production possibility set. This method imposes a binary constraint on each of the elements of the intensity vector which is used to combine the different observa-tions into a piecewise linear representation of the true production set. Therefore in FDH, each element is either zero or unity. This turns the conventional LP problem of DEA into a mixed integer programming problem (MIP). However a simple algo-rithm of complete enumeration can be used instead. Desprins, Simar and Tulkens (1984, p.264) put the case for this approach on two grounds:
1. it rests on the weakest assumptions regarding the production set
2. identification of dominating observations reveals an information set of direct use for managers
Two contrasting views illustrate the issue of identifying potential efficiency gains:
0 We should seek the frontier which shows the production unit in the best light: this suggests the tightest envelopment surface is to be preferred, and this is the FDH frontier.
0 We should seek potential efficiency gains for production units that permit management to design new production structures based on hypothetical improvements on existing structures. This suggests that convexity is an important comparator property for identifying potential efficiency gains, hence the DEA frontier is preferred from this point of view.
By ignoring potential combinations of efficient production units the FDH frontier implies performance is not feasible at that combination. However, in the context of a group of regional networks in a single company, this limits greatly the potential for identifying potential improvements in performance. Recall our earlier argu-ment that maximum discriminatory power in assessing performance is helpful to the senior management so long as ex-post rewards are not based on these find-ings. (Of course in public regulatory benchmarking, the objective may be to im-pose ex-post rewards and therefore the bias away from non-convexity may be optimal.) Consequently the argument for the choice of model is based on the company's managerial purpose rather than criteria of hypothesis testing error.
In the input orientated approach with constant returns to scale, efficiency is the solution to the linear programme:
PORTUGUESE JOURNAL OF MANAGEMENT STUDIES, VOL. XII/, NO. 1, 2008
. eCCR
mm
A.,BCCR
s.t.
XA-+
s
ccR- - XoBccR=
0y A-s CCR+
=
y 0A,SCCR-,SCCR+ ::::: 0
A firm is CCR efficient if the radial efficiency eccR
=
1 and the CCR slacks are zero: sfcR-=
s(cR+=
o .
Notice that although the slack variables adjustment is required to find the efficient projection of the observed production unit, these slack variable values do not affect the measured percentage efficiency score.Vari-i=J
able returns to scale adds the constraint on the intensity vector:
L
A-j = 1 , andj=l
this produces the BCC model.
A units-invariant form of slacks-based measurement is also suggested by Tone (2001) and this has a dual programme which is weight-restricted with a useful profitability interpretation. By contrast the Tone-SBM primal envelopment model defines a radial efficiency measure that directs attention to the input and output slacks.
1-~
~(s;
/x
10 )m
m
P
_--...!.i:c=-=1 _ _ _p,J. 1 +
t
~
(s:
jy
rO )s.t.
XA.+S-=Xo
YA.-s+ =Yo
A.,s- ,s+;;:: 0
r=!
PORTUGUESE JOURNAL OF MANAGEMENT STUDIES, VOL. X/1/, NO.1, 2008
p ::;_ ()CCR
so that in general the model is more discriminating than the CCR model. The difference can be expressed in terms of the CCR slacks:
We see that the SBM percentage efficiency score adjusts the CCR efficiency score downwards by including the effect of the slack variables into the measured CCR efficiency score.
Other ways of expressing the SBM model are also informative.
Therefore, we see that the SBM percentage efficiency score can be inter-preted for each production unit as follows.
The [ average proportionate reduction in inputs ] to achieve 1 OO%
average proportionate expansion in outputs
efficiency
Consequently, we can also write.
(1/m)L:((eccRxiO -s(cR- )/xiO)
i
p
=
--:-(1/-k
)'=L=-r((r-y r-o +-s--:::c;c::-::-R+""')/,---y r"-"To )-r
This has the interpretation:
[
average proportionate reduction in the DEA efficient inputs] toachieve
average proportionate expansion in outputs
100% efficiency.
So far the models considered in the EDP Distribui~ao ICB process have all demonstrated a radial efficiency score. This requires either a oriented approach, or
PORTUGUESE JOURNAL OF MANAGEMENT STUDIES, VOL. X/11, NO. 1, 2008 in the case of the Tone model a particular expression for the non-oriented
ap-•
proach. These models are units invariant as we noted. EDP Distribuigao also considered non-radial and non-units invariant approaches. These have the advan-tage of allowing a greater range of modelling options but need very careful inter-pretation and application in particular benchmarking processes.
The directional distance function measure of efficiency, introduced by Cham-bers Chung and Fare (1996), see also Fare and Grosskopf, (2006), does not specify radial contractions. Instead it is written more generally to represent the resultant of two different directional changes. These are represented in figure 1. The resultant is a direction vector which can be chosen to lie anywhere between the contraction of the input and the expansion of the output. The directional mea-sures are useful for dealing with undesirable outputs and negative data, and other non-orientated models.
FIGURE 1
Directional measures
y
CRS
fJg
0 Inputs ', L X
In figure 1, a producer is observed with the input and output combination: Z0
=
[x0, y0] which lies below the efficient production frontier, represented here by either of the CRS or VRS frontiers. Moving this producer to the more efficient point: Z1
=
[xl' y1] requires that the producer moves along the line L connecting the vectorsz
0 andz
1. The direction of this line is the vectorPORTUGUESE JOURNAL OF MANAGEMENT STUDIES, VOL. XII/, NO. 1, 2008
-
-
-OZ
1=
OZ0 +Z
0Z
1i.e.
zl
=
zo
+
gand so the vector equation of this line is
zl
=
zo
+
j3(g)i.e.
where again the subscripts refer to the (x, y) co-ordinates, and j3 is a scalar real number representing the extension of the line L. The more inefficient is the original observation, the further below the frontier is the production point Z0
=
[x0, y0].
Consequently j3 is larger the greater the inefficiency of the original observation. The objective of the efficiency measurement is to project
z
0 onto the frontier, which requires finding the largest feasible value for the scalar multiple j3. Feasibility is given by the piecewise linear representation of the production set under constant or variable returns to scale.The constant returns to scale, CRS, problem is written therefore as:
max/]
s.t.
XA-
s
x0 - fJgxYA-zy0 +/Jgy
A-20
The researcher chooses the components of the direction vector. For example if we choose:
then the problem becomes one which Fare and Grosskopf, (2006) describe as being the traditional efficiency measurement problem:
PORTUGUESE JOURNAL OF MANAGEMENT STUDIES, VOL. XII/, NO. 1, 2008
max/]
s.t.
XA-:::;
x
0(1-fJ)
YA-;:::y0(l+fJ)
A,;:::Q
This is the non-orientated radial efficiency model. The usual percentage effi-ciency score is recovered as3
: {3/(1 -{3). The radial efficiency score is units
invari-ant in this model. Orientated models are selected by:
and
If instead we choose the unit vector:
then the problem becomes:
max/]
s.t.
XA-:::; x0 -
fJ
YA-;:::yo+fJ
A,;:::Q
This problem solves for the feasible increase in desirable outputs and fea-sible decrease in inputs. The objective value is zero for efficient frontier networks and is positive for inefficient networks. The efficiency adjustment is additive and takes the form of a slack variable, consequently it is not units invariant.
An interesting suggestion by Silva Portela, Thanassoulis and Simpson (2004) addresses the issue of negative data, usually disallowed in DEA. These authors
PORTUGUESE JOURNAL OF MANAGEMENT STUDIES, VOL. XII/, NO. 1, 2008
suggest, in the case of
m
inputs ands
outputs used by j producers, the following range directional measures in a VRS model:X10 - minxlj
- gxl j
-gxm
gyl
Xmo -minXmj
j
maxY1j- Y10
j
maxYsj- Yso
j
Even in the presence of negative data, RiO= xiO -minxij and
j
R,o
=
maxYrj- Y,o
will take non-negative values. The resulting range directionalmodel is units-invariant and translation invariant with efficiency score: ( 1 - {3) E ( 0, 1]. It has the drawback that efficiency is computed with reference to a possibly infeasible ideal point which may lie beyond the production frontier:
I= minxij•maxYrj,i
=
l. .. m,r=
l...s. This is not the only approach to thej
issue of negative data and an alternative is discussed in Pastor and Ruiz (2007)
COMPARISON OF DEA MODELS IN EDP DISTRIBUU;Ao
In this study, EDP Distribuigao began by adopting the FDH approach, allow-ing for different characteristics of the regional networks. The results showed very poor discrimination amongst the different production units, with an average effi-ciency of 98 percent over the entire country. This suggests strongly that the com-pany can be regarded as performing at a very high level of efficiency but it pro-vided very little information for management about the scope for the type of per-formance related re-structuring which may be at the core of company -wide stra-tegic decisions. However, the five out of 40 inefficient units which were identified as dominated by others provided a minimal set of targets for management perfor-mance discussions.
Consequently, for the managerial reasons described earlier, the ICB process then turned from non-convex FDH models to impose convexity as part of the maintained hypotheses about the production structure. We begin with basic CRS and VRS models in order to understand the variation in performance over the sample by
PORTUGUESE JOURNAL OF MANAGEMENT STUDIES, VOL. XII/, NO. 1, 2008
combining data for 2004 and 2005. The results from a variety of the different data envelopment analysis models are shown in figures 2-5. In figures 2 and 3 we illustrate the spread of performances in a one input and one output model with input orientation under CRS and VRS assumptions; these graphs are simply illustrations, as the models are too simple in the sense that they do not include enough variables for the results to be meaningful -quality of supply variables play a very important role in the full analysis used in EDP. In figure 2, the scale assumption is critical to the efficiency of only a small minority of the networks, and the majority are clustered in the CRS region of the production space.
FIGURE 2
Frontier for one input and one output
16,---~
14
.r:: 12
c, c
~
..
10CIJ
:§ 8
~
0 6 !
CIJ
z 4
2
/ " " ' ' " ' ' ' ' '
~
"
•
•
1 000 2 000 3 000 4 000 5 000 6 000 7 000 8 000 9 000
Opex
In Figure 3, we examine the basic radial CCR model with CRS again but this time allowing for two outputs and one input. Again we can see that few networks are more efficient than most of the others, and such results indicate that a wider range of variables and performance measures need to be considered. The same network re-gions are measured as 100% efficient in each of these basic models.
PORTUGUESE JOURNAL OF MANAGEMENT STUDIES, VOL. XII/, NO. 1, 2008
FIGURE 3
Frontier for two outputs and one input
~4.5~---~
:!!:
g 4,0 _ OO<«oo»»W<<»<m«<»»<<<»<o»»««>"""""~
8.
3,5E
~3.0
)(
41
g
2.5...
=5, 2,0
"
41
-:: 1,5
41
"
~ 1.0
0
! 0,5
41 z
•
•
•••
••••
# •• • <
.
,
....
•
•
••
...
,
••
.
•
•
•
•
•
0,0 +---,---,---,---r---.---.---1
0,0 20,0 40,0 60,0 800 100,0 1200 140,0
cnenl/ Opex (clients per 1000€)
regulator's ability to make commitments, and reduces the incentive for the firm to participate fully in the regulatory process. The opposite considerations can apply at the internal company benchmarking if ex-post rewards are not at stake.
For further development of the models, we find that the following selection of inputs and outputs gives the most consistent results both in terms of the data envelopment analysis and the expert engineering input on network configuration.
• Input: Costs, together with the Quality of supply variables: Interruptions (Minutes of lost load), Complaints per customer and number of incidents • Ouputs: Number of customers, length of network (Lines)
In figure 4, we report the radial data envelopment analysis efficiency scores for the networks under VRS assumptions, but treating the two years 2004 and 2005 separately. In each year separately average efficiency, indicated by the ver-tical arrow lines in the figure, is around 90 %, and for each of the efficient net-works, i.e. those with 100% efficiency, slack variables are zero at the optimum so that a Pareto-Koopmans optimum is achieved. In analyzing the slack variables, it is very clear that different regional networks excel in different dimensions. The important managerial implication of this finding is that it can be used to set up internal markets in performance related variables. For example, regional networks which are particularly efficient at maintaining quality of supply could be allocated tradable quality permits which can be purchased in a internal market arrangement by networks which are more efficient at reducing operating costs, and conversely. There is anecdotal evidence that elementary forms of this sort of internal market trading are already happening in electricity networks in the UK for example.
PoRTUGUESE JouRNAL oF MANAGEMENT STUotEs, voL. XIII, NO. 1, 2008
FIGURE 4
Results - DEA - VRS
02004 .2005
100% ,---'---., 2005
9 0 %
-80%
70%
)o. 60%
u
1:
~ 50%
iE
.. 40%
30%
20%
10%
2004
1 2 3 4 5 6 7 8 9 1011 12131415 161718192021 22232425 26272829 3031 323334353637 3839 40
Networks
In Figure 5, we report the results from combining the two sample years, but we identify as separate production units the 2004 and 2005 versions of each of the networks. This has the effect of identifying whether efficiency change has occurred. We can see that in this configuration there has been an improvement in overall efficiency from 84% to 91% between the two years.
FIGURE 5
Results - DEA-VRS - Combining 2004-2005 data
02004 .2005
100% , . .
-90%
80%
70%
)o. 60%
u
1:
.~ 50%
u
ffi 40%
30%
20%
10%
2005
2004
----
- -
---
- -
-1 2 3 4 5 6 7 8 9 -1 0 -1-1 -12 -1 3 -14 -15 -1 6 -17 -18 -19 20 2-1 22 23 24 25 26 27 28 29 30 3-1 32 33 34 35 36 37 38 39 40
Networks
PORTUGUESE JOURNAL OF MANAGEMENT STUDIES, VOL. XII/, NO. 1, 2008
This finding has a relationship with the overall regulatory environment. In a country like Portugal where there is a single network operator and owner with disaggregated branches, regulatory benchmarking is particularly difficult to imple-ment. Consequently, it is important for both regulator and company to monitor and observe whether performance is in fact changing over time. This finding of performance improvement at a rate about six times greater than the national aver-age at the level of the whole economy is an important piece of evidence that the incentive regulatory regime is working.
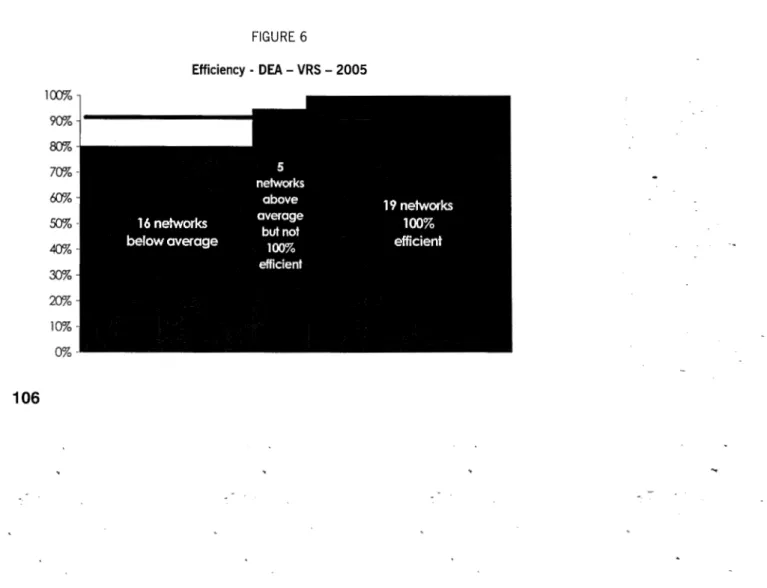
In figure 6, we focus on the radial DEA scores under VRS in 2005, and report the distribution of performance across the networks. The management of EDP
Distribui~ao is able to use these results to offer incentives to network managers to
improve performance, and to investigate in more detail the operating environment characteristics which may lead to the dispersion in results. The company uses the results of these and similar studies to set a context for dialogue with network managers on the reasons why performance may differ across the different net-works. This brings in performance benchmarking but also helps to identify engi-neering related causes such as geography and terrain, which could explain differ-ences in performance. In EDP Distribui~ao the preliminary Data Envelopment Analysis findings become the subject evolving model network analysis (MNA) in which the engineering personnel of the company can develop criteria for identify-ing significant and strategically important variables for further efficiency studies at the company level. Particularly important issues have related to the role of num-bers of connections as an area for further study in measuring relevant outputs.
FIGURE 6
Efficiency - DEA - VRS - 2005
100%
90%
80%
70%
60%
50%
40%
30%
20%
10%
0%
PORTUGUESE JOURNAL OF MANAGEMENT STUDIES, VOL. XII/, NO. 1, 2008
So far the analysis has concentrated on the application in EDP Distribuic;ao of standard radial input orientated DEA models of the BCC type. However, re-search in the company is progressing on the application of other types of models as described earlier in the paper. Attention has been directed initially at slacks based models, Tone (2001). Slacks based models (SBM), which have a dual interpretation as weight-restricted models, may have orientations which are input based, output based or may be non-orientated. However it is important that con-sistency of rankings across different DEA models is maintained for the results to be meaningful. Figure 7 reports the efficiency scores in the 2005 sample for the networks under three different models: input orientated radial DEA, input orien-tated SBM, and non-orienorien-tated SBM. The 19 best performers (1 00% efficient) are the same in all of the measurements.
80% 70%
>-60% u
1:
-~ 50%
!i'l 40% 30% 20% 10% 0%
FIGURE 7
Results from different measures (2005)
D Input Oriented-Radial •Input Oriented-SBM !Ill Nan Oriented-SBM
(, @
1 2 3 4 5 6 7 8 9 1011 12131415161718 192021 22 23242526272829 3031 323334353637 3839 40 Networks
The close relationship in the results indicates that the orientation is not criti-cal to the ranking of efficient performance. This is confirmed in figure 8 which reports the correlation between SBM models with different orientations.
PORTUGUESE JOURNAL OF MANAGEMENT STUDIES, VOL. XII/, NO. 1, 2008
FIGURE 8
Comparison of results from different SBM models
100%~---o
:e
90%*
al
~
V)
"C
Q)
'E80%
¢ ¢Q)
~··
·;::
0 9
*
s:::
~
0
¢*
Z70%
¢> ¢ 0
¢>
C:JJ%
C:JJ% 70% 80% 90% 100%
Input Oriented • SBM
INTERPRETATIONS AND CONCLUSIONS FROM THE DEA STUDIES
This paper has used a variety of directional distance function measures to apply DEA models to the efficiency of maintenance and outage repair expenditure in the electricity distribution networks operated by EDP Distribui<;ao. There are strong positive correlations between the rankings on all of the different measures used; this gives confidence in the consistency of the results across different mod-elling approaches. The results are very similar in all models in identifying the efficient networks, and confirming a high level of average efficiency. The average level of efficiency has improved between 2004 and 2005.
This use of DEA models to evaluate the efficiency of different network regions has helped management in two principal ways. The first is to enable it to set targets for less efficient regions; in this context, the use of a variety of non-orien-tated, and slacks based models is important to ensure consistency across different modelling approaches and to ensure that the efficiency targets are not simply the consequence of a single modelling approach. The second benefit for the manage-ment of the company is that the DEA helps to find benchmarks for each network region, in order to identify best practices. A critical issue here is the role of exog-enous operating characteristics and environmental variables. These also play an important role in the regulatory oversight of the company, and one of the main consequences of the regulatory benchmarking has been the company's
PORTUGUESE JOURNAL OF MANAGEMENT STUDIES, VOL. XII/, NO. 1, 2008 ment of the DEA modelling approach within company decision making. However, as we have tried to demonstrate, there are important differences between regula-tory benchmarking and internal company benchmarking as describe for EDP Distribuigao. In particular, these differences arise from the relationship between the results of the benchmarking exercise and the nature of incentives and rewards. More generally, the difference lies in the structure and timeline of the underlying game theoretic analysis.
PORTUGUESE JOURNAL OF MANAGEMENT STUDIES, VOL. X/1/, NO. 1, 2008
References
Chambers, Robert, Yangho Chung, and Rolf Fare (1996) Benefit and Distance Functions, Journal of Economic Theory, 70,407-19
Desprins, D., L. Simar and H. Tulkens (1984) Measuring Labor-Efficiency in Post Offices, in M. Marchand, P.Pestieau and H. Tulkens (eds) The Performance of Public Enterprises: Concepts and Measurements, Amsterdam, North Holland.
Fare, Rolf, and Shawna Grosskopf, (2006) Modeling undesirable factors in efficiency evaluation,
European Journal of Operational Research, (forthcoming)
Jamasb, Tooraj and Michael Pollitt (2003) International Benchmarking and Regulation: an applica-tion to European electricity distribuapplica-tion utilities, Energy Policy, 31,15, 1609-1622 Pastor, J.T. and A. Ruiz (2007) Variables with Negative Values in DEA in Wade Cook and Joe Zhu
(eds) Modeling data irregularities and structural complexities in Data Envelopment Analysis,
Berlin, Springer-Verlag.
Silva Portela, M.C.A., E. Thanassoulis, and G. Simpson (2004) Negative data in DEA: a directional distance approach applied to bank branches, Journal of the Operational Research Society,
55, 1111-1121
Tone, Kaoru (2001) A Slacks Based Measure of Efficiency in Data Envelopment Analysis, European Journal of Operational Research, 130, 498-509
Weyman-Janes, Thomas, Julia Boucinha, Celia Godinho, Catarina Feteira lnacio, Pedro Martins and Jon Latore (2006) Efficiency Analysis for Incentive Regulation, in Tim Coelli and Dennis Lawrence (eds) Performance Measurement and Regulation of Network Industries, Cheltenham, Edward Elgar
Resumo
As empresas de distribui~ao de energia eh~ctrica tern vindo a analisar a eficiencia e a produtividade das suas actividades atraves dos metodos "Data Envelopment Analysis" (DEAl e "Stochastic Frontier Analysis" (SFA). Esta pratica reflecte as novos desenvolvimentos do mercado, bern como a necessidade de responder aos incentives dados pela regula~ao. Contudo, demonstra-se aqui que ha uma diferen~a significativa na avalia~ao do desempenho para efeitos de regula~ao ou para compara~ao interna das diferentes unidades organizativas da empresa, quer ao nfvel de objectives quer ao nfvel da implementa~ao. No presente traba-lho sao utilizados diferentes modelos DEA para analisar a actividade de manuten~ao e avarias na distribui-~ao de electricidade em Portugal, em 2004-2005. Concretamente, e analisada a rela~ao entre modelos com e sem orienta~ao, e entre analises radiais e nao-radiais. Sao desenvolvidas medidas de desempenho para as diferentes unidades organizativas da EDP Distribui~ao, e conclui-se par uma rela~ao muito forte entre os posicionamentos relativos dados pelos diferentes modelos, satisfazendo assim as condi~6es de consistencia habitual mente utilizadas na modeliza~ao do desempenho. 0 presente artigo permite, atraves da experiencia desta empresa, tirar algumas li~6es sabre como a avalia~ao do desempenho pode ser implementada dentro de uma empresa, em contraste como habitual objective de benchmarking para fins de regula~ao.
Palavras-chave: "data envelopment analysis", distribui~ao de electricidade, avalia~ao do desempe-nho