Latitudinal Range Influences the Seasonal Variation in
the Foraging Behavior of Marine Top Predators
Stella Villegas-Amtmann1*, Samantha E. Simmons1¤a, Carey E. Kuhn1¤b, Luis A. Huckstadt2, Daniel P. Costa1
1Department of Ecology and Evolutionary Biology, University of California Santa Cruz, Santa Cruz, California, United States of America,2Department of Ocean Sciences, University of California Santa Cruz, Santa Cruz, California, United States of America
Abstract
Non-migratory resident species should be capable of modifying their foraging behavior to accommodate changes in prey abundance and availability associated with a changing environment. Populations that are better adapted to change will have higher foraging success and greater potential for survival in the face of climate change. We studied two species of resident central place foragers from temperate and equatorial regions with differing population trends and prey availability associated to season, the California sea lion (Zalophus californianus) (CSL) whose population is increasing and the endangered Galapagos sea lion (Zalophus wollebaeki) (GSL) whose population is declining. To determine their response to environmental change, we studied and compared their diving behavior using time-depth recorders and satellite location tags and their diet by measuring C and N isotope ratios during a warm and a cold season. Based on latitudinal differences in oceanographic productivity, we hypothesized that the seasonal variation in foraging behavior would differ for these two species. CSL exhibited greater seasonal variability in their foraging behavior as seen in changes to their diving behavior, foraging areas and diet between seasons. Conversely, GSL did not change their diving behavior between seasons, presenting three foraging strategies (shallow, deep and bottom divers) during both. GSL exhibited greater dive and foraging effort than CSL. We suggest that during the warm and less productive season a greater range of foraging behaviors in CSL was associated with greater competition for prey, which relaxed during the cold season when resource availability was greater. GSL foraging specialization suggests that resources are limited throughout the year due to lower primary production and lower seasonal variation in productivity compared to CSL. These latitudinal differences influence their foraging success, pup survival and population growth reflected in contrasting population trends in which CSL are more successful and potentially more resilient to climate change.
Citation:Villegas-Amtmann S, Simmons SE, Kuhn CE, Huckstadt LA, Costa DP (2011) Latitudinal Range Influences the Seasonal Variation in the Foraging Behavior of Marine Top Predators. PLoS ONE 6(8): e23166. doi:10.1371/journal.pone.0023166
Editor:Yan Ropert-Coudert, Institut Pluridisciplinaire Hubert Curien, France ReceivedFebruary 8, 2011;AcceptedJuly 13, 2011;PublishedAugust 10, 2011
Copyright:ß2011 Villegas-Amtmann et al. This is an open-access article distributed under the terms of the Creative Commons Attribution License, which
permits unrestricted use, distribution, and reproduction in any medium, provided the original author and source are credited.
Funding:This work was part of the TOPP (Tagging of Pacific Predators) Program supported by the Sloan, Packard and Moore Foundations, the Office of Naval Research, UC MEXUS, CONACYT, NSF Office of Polar Programs, CRS (Center for Remote Sensing) and the Ecology and Evolutionary Biology Department at UCSC. The funders had no role in study design, data collection and analysis, decision to publish, or preparation of the manuscript.
Competing Interests:The authors have declared that no competing interests exist. * E-mail: [email protected]
¤a Current address: Marine Mammal Commission, Bethesda, Maryland, United States of America
¤b Current address: National Marine Mammal Laboratory, Alaska Fisheries Science Center/National Marine Fisheries Service/National Oceanic and Atmospheric Administration, Seattle, Washington, United States of America
Introduction
As Darwin [1] stated: ‘‘It is not the strongest of the species that survive, nor the most intelligent, but the one most responsive to change’’, thus species that are more capable of adapting to changing environmental conditions will have a greater capability of responding to long term changes in climate. The physical environment changes at different scales; over centuries, decades, years and seasonally within a year. Seasonal changes in temperature and light level, affect primary production and the abundance, distribution and behavior of higher trophic levels. Many taxa have evolved behavioral and physiological responses to avoid unsuitable seasonal change by migrating (whales and birds) [2,3] or by means of hibernation and aestivation (bears, badgers and frogs) [4–6]. Life history patterns of other animals such as penguins, albatrosses, seals and sea lions; described as central place foragers [7,8], respond to seasonal change by shifting their diet and/or foraging behavior.
The magnitude of seasonal change differs with latitude; it is more pronounced at higher latitudes than in equatorial regions, where there are typically only two seasons: a wet and a dry one. In equatorial regions environmental temperature remains high year round, there is a constant 12 hr period of daylight throughout the year and oceanic primary productivity is lower [9] (http://www. marine.rutgers.edu). At higher latitudes, colder marine systems are typically more productive and thus have a greater abundance of prey [9]. These latitudinal differences influence animal popula-tions in many ways, e.g. foraging efficiency of Australian forest mammals is lower in tropical than in temperate ecosystems [10], tropical island terns reduce clutch investment at lower latitudes [11] and pinnipeds (seals, fur seals and sea lions) living in equatorial and temperate environments are more at risk of extinction than species living at higher latitudes [12]. These studies conclude that latitudinal differences in population size result from lower food availability and lower oceanic primary productivity,
and prey depletion associated with resident-central place foraging behavior along with the reduced seasonality at lower latitudes.
Of the 15 Otariidae (fur seals and sea lions) species, population size declines with decreasing latitude with only two species in equatorial regions, a fur seal and a sea lion. Here we study the foraging behavior of two species of year round resident central place foragers, the temperate California sea lion (Zalophus californianus) (CSL), whose population is increasing (237–244,000 indiv.) [13,14]; and the equatorial Galapagos sea lion (Zalophus wollebaeki) (GSL), whose population is endangered and declining (16–18,000 indiv.) [15,16]. Given that CSL forage at higher latitudes where productivity and seasonality are greater, we hypothesized that CSL would exhibit a greater variability in their foraging behavior that is associated with the greater range of oceanic productivity they encounter.
Foraging behavior has been studied in an array of air breathing diving vertebrates such as penguins, seals [17] and all extant sea lion species [18–25]. However, all of these studies were conducted during one season, mostly summer. Seasonal dive behavior has only been studied in New Zealand (Arctocephalus forsteri), [26] and Subantarctic (Arctocephalus tropicalis) fur seals [27,28], and in Steller (Eumetopias jubatus) and Australian (Neophoca cinerea) sea lions [18,25], all of these showing greater effort during winter than summer. Villegas-Amtmann et al. [22] and Villegas-Amtmann & Costa [29] described 3 diving strategies in GSL that persisted over both a warm and cold season. The 3 groups from the cold season were classified in the same manner as the warm season with a minor modification in group 2 as follows: (1) shallow divers, sea lions that exhibited the shortest dive duration and shallowest dive depth, (2) deep bottom divers, individuals with the deepest dive depths, longest time at the bottom of a dive and mostly benthic (only ‘‘deep divers’’ during warm season as they were diving mesopelagically) and (3) bottom divers, sea lions with the highest percentage of benthic dives [29].
To determine how temperate and equatorial diving vertebrates with contrasting population status, respond to environmental change we compared CSL (Granito Island, Gulf of California, Mexico) and GSL (Caaman˜o Islet, Galapagos, Ecuador) diving behavior during two contrasting seasons, a warm and a cold one. Sea surface temperature (SST) around Granito Island ranges from 15–31uC and chlorophyll-a ranges from 0.3–6.0 mg/m3 , while around Caaman˜o Islet SST ranges from 19–28uC and chloro-phyll-a from 0.3–0.8 mg/m3 during different seasons each year (http://coastwatch.pfeg.noaa.gov/). Additionally, we studied the differences in their diet by measuring carbon (13C/12C) and nitrogen (15N/14N) isotope ratios.
Methods
Ethics Statement
This research was approved by the CARC (Chancellor’s Animal Research Committee) at University of California, Santa Cruz. Permission to import and collect samples was granted through National Marine Fisheries Service Permit No. 960-1528-00/PRT-017891 and No. 87-1593-06, Parque Nacional Galapagos autho-rization No. 084/06 PNG and SEMARNAT authoautho-rization No. SGPA/DGVS/06537 and 08736 and No. 09/FS-1837/01/07.
Field site and tagging procedures
California sea lions (CSL).Research was carried out during a warm season- Jul-Aug 2005 and a cold one- Feb-Mar 2007 (seasons were defined as the contrasting ambient and water temperatures that occur each year) at Granito Island (29.55uN, 113.54uW) in the Gulf of California, Mexico. During the warm
season (pupping season) we captured 10 lactating female CSL, which were suckling small pups, 1 to 2 months after peak pupping season. During the cold season (non-pupping season) we captured 11 lactating female CSL, with older pups (8 to 9 months after peak pupping season). Sea lions were captured with hoop nets and anesthetized with isoflurane gas (0.5–2.5%) with oxygen via a portable field vaporizer, administered initially through a cone shaped mask and afterwards with an endotracheal tube [30]. Once under anesthesia, instruments were attached and physiological samples taken for analysis of oxygen stores [29].
For large-scale tracking we instrumented 10 animals with SPOT5 satellite platform terminal transmitters (PTT) during the warm season (2005), and a total of 8 animals during the cold season (2007), 4 of them with SPOT5 (Wildlife Computers, Richmond, WA, USA) and 4 with Kiwisat 101 PTTs (Sirtrack, Havelock North, New Zealand). To obtain diving behavior data we instrumented sea lions with time-depth recorders (TDR) that sampled every 2 sec, 2 Mk8 and 8 Mk9 models in 2005 and 8 Mk9 in 2007 (Wildlife Computers, Richmond, WA, USA). Sea surface temperature data was also measured and obtained from the TDRs. To locate the animals for instrument recovery when on land we instrumented them with radio transmitters (VHF) (Sirtrack, Havelock North New Zealand).
We mounted instruments on mesh netting and glued them to the dorsal pelage of the lower back and between the shoulders of the animals using 5 minute quick set Loctite epoxy. The total weight of the instruments attached was approximately 230 g (,0.23%of the animal’s mass). We weighed animals in a sling
using a tripod and a 250 kg (+/20.1 kg precision) capacity digital scale and took standard length measurements by using a standard measuring tape. We obtained data from all PTTs and recovered 7 of the 10 TDRs after 15 to 27 days during the warm season (2005), and 5 out of the 8 TDRs after 22 to 89 days during the cold season (2007). Instruments were removed by either physically restraining the animals without anesthesia or had been found on the rookery after molting off. Epoxy mounts fall off within a few months during the animals’ annual molt.
Galapagos sea lions (GSL). The same methodology was applied to study the diving behavior of GSL. Research was carried out during a warm season- March 2005 and a cold one- August-September 2006 at Caaman˜o Islet (0.759uS, 90.278uW) in the Galapagos Islands. During the warm season we captured 11 GSL, which were suckling small pups, 4 to 5 months after peak pupping season. During the cold season we captured 12 GSL, most of them with bigger and possibly older pups (10 to 11 months after peak pupping season) than the ones from the previous season. Details are presented in Villegas-Amtmann and Costa [29].
Tracking analyses
Habitat utilization and foraging range were determined from ARGOS location data filtered and interpolated using software written in Matlab 7.4.0 (MathWorks Inc, USA) (IKNOS toolbox). The algorithm uses several criteria to remove unlikely locations: (1) realistic travel speeds of a subject between two fixes (#10 km h21), (2) change in azimuth between successive fixes, (3) Argos location class and (4) time lapse between two consecutive fixes. We plotted filtered locations using Matlab (The MathWorks Inc, USA). Filtered locations were interpolated every 60 min using a Bezier curve to further perform a Gaussian Kernel analysis with a 5 km grid size [3].
Diving behavior analyses
unpublished) that allows for a zero offset correction at the surface and the identification of dives based on a minimum depth and duration. Diving data were analyzed following the same methods as in Villegas-Amtmannet al. [22]. All Mk8 and Mk9 recorders in both seasons had a 0.5 m depth resolution; except one recorder during the cold season had a 1 m depth resolution and all recorders sampled every 2 sec. The minimum depth considered for a dive was 3 m and the minimum duration was 12 sec.
We discarded ‘porpoising’ or shallow dives (restricted to the upper 5 m) typically exhibited by sea lions when travelling [22] to limit our analysis to foraging (i.e. feeding or search) dives. Data were tested for normality using Kolmogorov-Smirnov one sample tests for homogeneity of variance and log transformed as needed. We compared means using t-tests when the data were normally distributed otherwise we used a Kruskal-Wallis test (K–W). We also compared their mass (kg) and body condition index by dividing mass/standard length [31] by using t-tests.
To explore CSL individual diving behavior variability within each season we performed hierarchical cluster analyses (HCA) using Euclidean distance and average linkage method as described in Villegas-Amtmann et al. (2008). Variables used were: dive depth (m), dive duration (sec), bottom time (sec), descent and ascent rate (m/s), dive rate (dives/hr), post dive interval (PDI) (sec), intra depth zone (IDZ) (provides an index of the tendency to repeatedly dive to a given depth, considering 5 m was the minimum detectable depth for a dive, we applied a user defined zone of 610 m of the maximum depth of the previous dive, i.e. 5 m above and below the previous depth to calculate IDZ, evidence of benthic diving) [32], number of ‘‘wiggles’’ at the bottom of a dive (number of ascent and descent movements at the bottom of the dive, which can imply foraging behavior) [24], max. dive depth (m), max. dive duration (sec), max. distance traveled from the rookery (km), % time spent on land, % time spent at sea and mass (kg). Hierarchical clustering is ideal for small data sets as in this study [33].
To compare diving behavior between species during each season, we reduced the number of variables with a Principal Component Analysis (PCA) using variables from both species and seasons, using latent root criterion, a correlation matrix of extraction, a minimum Eigen-value of 1.0 and a varimax rotation. This analysis is suitable for these data because the diving variables are strongly correlated [33]. Standardized PCA factor scores were then input as dependent variables in a General Linear Model (GLM), independent variables used were species, season and the interaction term: species-season. All means are presented with a61 standard deviation (SD).
Isotope analyses
To further analyze and compare foraging behavior and differences in diet [34] between species and seasons we measured carbon (13C/12C) and nitrogen (15N/14N) isotope ratios by collecting blood samples from the caudo-gluteal vein into serum collection tubes. Stable isotopes measured from serum reflect diet incorporated over a time period of days before sampling [35,36]. Serum was separated by centrifugation and stored at 220uC. Serum samples were freeze-dried; and homogenized after lipid extraction. Samples were analyzed using a Carlo Erba 1108 Elemental Analyzer coupled to a Thermo Finnigan Delta Plus XP isotope ratio mass spectrometer (Stable Isotope Laboratory, University of California Santa Cruz). Stable isotopes values are given in delta notation (d) as parts per thousand (%). Data were tested for normality using Kolmogorov-Smirnov one sample tests for homogeneity of variance and log transformed as needed. We
compared foraging behavior of each species between seasons by running an ANOVA.
Significance was tested at the 95% confidence. All statistical analyses were performed in SYSTAT 10.2 and/or 11.
Results
California sea lion seasonal diving behavior
CSL exhibited changes in their dive behavior between seasons, during the warm season CSL dived significantly deeper (t-test,
t=22.24, df =9.7, P= 0.05), longer (t-test, t=24.31, df= 9.9,
P,0.01), spent significantly longer time at the bottom of a dive (t-test,t=23.95,df= 8.9,P,0.01), presented significantly greater maximum dive durations (t-test, t=22.86, df= 7.7, P= 0.02), percentage of intra-depth zone (IDZ) dives (t-test, t=24.39,
df= 10.0, P= 0.001), and significantly lower percentage of time spent at sea (t-test,t= 4.80, df= 8.2,P= 0.001) compared to the cold season (Table 1). Maximum distance traveled, maximum dive depth, descent and ascent rate, dive rate and post-dive interval (PDI) were not significantly different between seasons (Table 1).
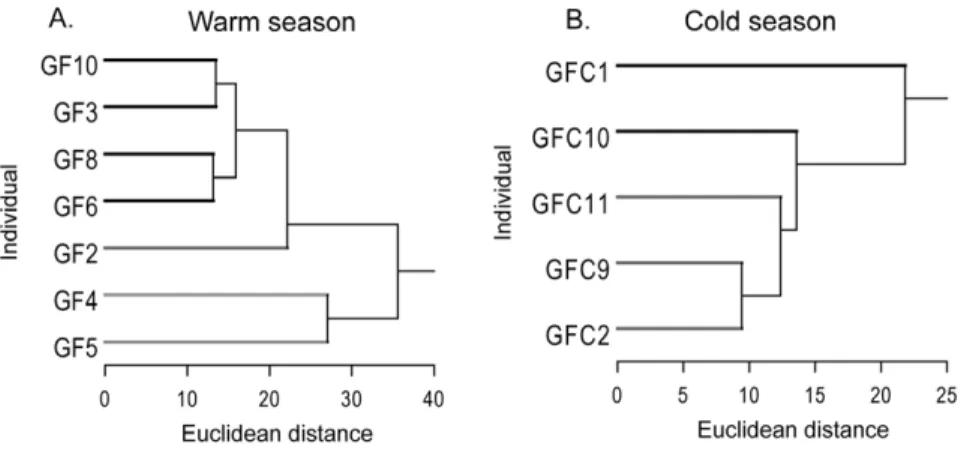
CSL dive behavior exhibited greater variability during the warm season compared to the cold one as observed in the three groups or foraging strategies identified in the cluster tree for the warm season compared to no groups observed during the cold season (Fig. 1). The maximum Euclidean distance for a group to be considered was 27 based on the cluster tree produced by the HCA (Fig. 1). Due to our small sample size we ran a cluster analysis with data combined from both seasons. The cluster tree obtained produced 3 groups with all individuals from the cold season in one and individuals from the warm season in the 3 different groups, confirming our previous findings.
Gulf of California environmental conditions. SST encountered by sea lions was significantly greater during the warm (mean SST for each individual sea lion, 28.861.1uC) than the cold season (17.560.9uC, K–W test,x2
= 6.82,df= 1,P= 0.01).
California and Galapagos sea lion seasonal diving behavior comparison
Principal Component Analysis (PCA). Four factors or principal components (PC) explained 86% of the variance. The variables driving the 4 PC were: PC1- dive rate, dive depth, max. dive depth and PDI; PC2- Bottom time, % IDZ dives, bottom wiggles (number of ascent and descent movements at the bottom of the dive, which can imply foraging behavior) [24] and dive duration; PC3- percent time spent on land and at sea and PC4-mass and body condition index (Table 2).
General Linear Model (GLM). GLM results showed that dive depth, dive rate, maximum dive depth & PDI (PC1) were not significantly different between species, seasons or species-season (interaction term). This result remained even after eliminating the interaction term from the model. Dive duration, bottom time, bottom wiggles & IDZ (PC2), were significantly greater for GSL than CSL (df= 1, F-ratio= 34.65, P,0.001) and significantly greater during the warm season compared to the cold one in CSL (interaction term: species-season) (df= 1, F-ratio= 10.69,
P,0.001). GSL exhibited no change in these dive parameters between seasons (Table 3 & Fig. 2). Percent time on land and at sea was significantly different between seasons (df =1, F-ratio= 15.17, P,0.01) and between seasons and species (interaction term) (PC3)) (df= 1, F-ratio= 12.34, P,0.01). During the warm season CSL spent more time on land (52.868.5%), conversely GSL spent more time at sea (59.265.1%) (Table 3). Mass and body condition index (PC4)
Latitudinal Influence on Foraging Behavior
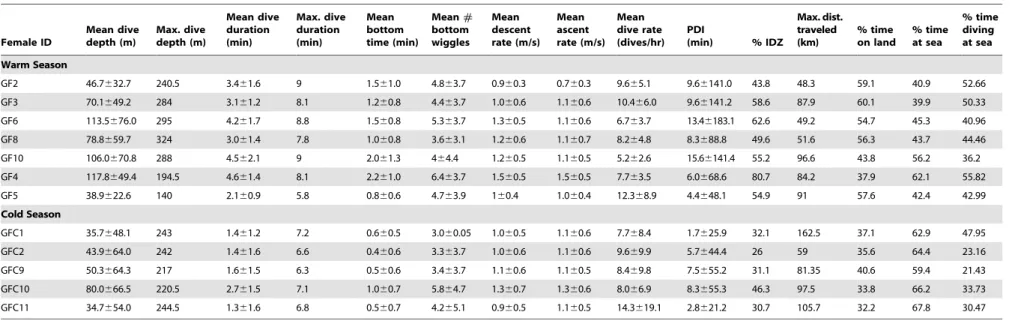
Table 1.California sea lion dive parameters.
Female ID
Mean dive depth (m)
Max. dive depth (m)
Mean dive duration (min)
Max. dive duration (min)
Mean bottom time (min)
Mean# bottom wiggles
Mean descent rate (m/s)
Mean ascent rate (m/s)
Mean dive rate (dives/hr)
PDI
(min) % IDZ
Max. dist. traveled (km)
% time on land
% time at sea
% time diving at sea
Warm Season
GF2 46.7632.7 240.5 3.461.6 9 1.561.0 4.863.7 0.960.3 0.760.3 9.665.1 9.66141.0 43.8 48.3 59.1 40.9 52.66
GF3 70.1649.2 284 3.161.2 8.1 1.260.8 4.463.7 1.060.6 1.160.6 10.466.0 9.66141.2 58.6 87.9 60.1 39.9 50.33
GF6 113.5676.0 295 4.261.7 8.8 1.560.8 5.363.7 1.360.5 1.160.6 6.763.7 13.46183.1 62.6 49.2 54.7 45.3 40.96
GF8 78.8659.7 324 3.061.4 7.8 1.060.8 3.663.1 1.260.6 1.160.7 8.264.8 8.3688.8 49.6 51.6 56.3 43.7 44.46
GF10 106.0670.8 288 4.562.1 9 2.061.3 464.4 1.260.5 1.160.5 5.262.6 15.66141.4 55.2 96.6 43.8 56.2 36.2
GF4 117.8649.4 194.5 4.661.4 8.1 2.261.0 6.463.7 1.560.5 1.560.5 7.763.5 6.0668.6 80.7 84.2 37.9 62.1 55.82
GF5 38.9622.6 140 2.160.9 5.8 0.860.6 4.763.9 160.4 1.060.4 12.368.9 4.4648.1 54.9 91 57.6 42.4 42.99
Cold Season
GFC1 35.7648.1 243 1.461.2 7.2 0.660.5 3.060.05 1.060.5 1.160.6 7.768.4 1.7625.9 32.1 162.5 37.1 62.9 47.95
GFC2 43.9664.0 242 1.461.6 6.6 0.460.6 3.363.7 1.060.6 1.160.6 9.669.9 5.7644.4 26 59 35.6 64.4 23.16
GFC9 50.3664.3 217 1.661.5 6.3 0.560.6 3.463.7 1.160.6 1.160.5 8.469.8 7.5655.2 31.1 81.35 40.6 59.4 21.43
GFC10 80.0666.5 220.5 2.761.5 7.1 1.060.7 5.864.7 1.360.7 1.360.6 8.066.9 8.3655.3 46.3 97.5 33.8 66.2 33.73
GFC11 34.7654.0 244.5 1.361.6 6.8 0.560.7 4.265.1 0.960.5 1.160.5 14.3619.1 2.8621.2 30.7 105.7 32.2 67.8 30.47
PDI = post-dive interval, IDZ = intra-depth zone dives.
Mean (6SD) and maximum dive parameters of individual female California sea lions (Zalophus californianus) from Granito Island, Mexico recorded for 15–27 days during a warm season (Jul–Aug 2005) (mean no. dives 20686655) and for 22–89 days during a cold season (Feb–Mar 2007) (mean no. dives 832269511). Female IDs organized by groups produced by the cluster analysis.
doi:10.1371/journal.pone.0023166.t001
Latitudina
l
Influence
on
Foragin
g
Behavior
ONE
|
www.plos
one.org
4
August
2011
|
Volume
6
|
Issue
8
|
were not significantly different in the GLM. Therefore, we excluded the interaction term (seasons-species) from the model and found that CSL mass and body condition index were significantly greater than GSL (df= 1,F-ratio= 4.32,P= 0.05).
Gulf of California and Galapagos environmental conditions. During the warm season, SST (mean SST for each sea lion) encountered by CSL (29.260.6uC, n= 5, t-test,
t= 8.13, df= 8, P,0.001) was significantly higher than that encountered by GSL (26.760.4uC, n= 5). During the cold season, SST encountered by CSL (17.560.9uC, n= 5, t-test,
t=28.68, df= 12, P,0.001) was significantly lower than that encountered by GSL (23.361.3uC,n= 9). During the cold season GSL encountered mild El Nin˜o conditions (http://coastwatch. pfeg.noaa.gov/).
California and Galapagos sea lions foraging areas The kernel analysis revealed that CSL utilized a greater diversity of foraging areas during the warm season (n= 10 females)
compared to the cold one (n= 8 females). GSL exploited the same foraging areas during both seasons (n= 9 & 10 females respectively) (Fig. 3).
Isotope analyses
ANOVA tests on sea lionsd13C andd15N isotope ratios showed that CSL d13C values were significantly different (df= 1, F-ratio= 77.43, P,0.001) between seasons, while d15N values were not (df =1,F-ratio= 0.001,P= 0.97). GSLd13C andd15N values were not significantly different between seasons (df= 1, F-ratio= 2.61,
P =0.12 anddf= 1,F-ratio= 1.97,P= 0.17 respectively) (Fig. 4).
Discussion
CSL foraging behavior
CSL exhibited changes in their dive behavior between seasons. As hypothesized, CSL showed greater effort during the warm and less productive season [37] as reflected in significantly greater dive Figure 1. California sea lions diving behavior cluster analyses.California sea lion females (Zalophus californianus) from Granito Island, Mexico, cluster analyses for dive parameters during a warm season (Jul–Aug. 2005) and a cold season (Feb–Mar. 2007).
doi:10.1371/journal.pone.0023166.g001
Table 2.Galapagos and California sea lions dive parameters PCA loading matrix.
Dive Parameter PC1 (29.06%) PC2 (26.73%) PC3 (15.67%) PC4 (14.53%)
Dive depth 0.858 0.36 0.142 20.06
Dive duration 0.645 0.741 0.083 0.005
Bottom time 0.283 0.909 0.155 0.057
Max. dive depth 0.866 20.271 0 20.053
Max. dive duration 0.689 0.441 0.115 20.128
Max. distance traveled 0.231 20.669 0.297 0.24
Dive rate 20.894 20.11 20.071 0.11
PDI (Post dive interval) 0.829 0.105 20.201 20.137
%IDZ (Intra-depth zone dives) 0.09 0.886 0.043 0.148
Bottom wiggles 0.13 0.829 0.305 0.008
% time on land 20.008 20.11 20.965 0.167
% time at sea 0.001 0.11 0.968 20.104
Mass 20.144 0.037 20.139 0.961
Body condition index 20.164 0.021 20.121 0.967
PCA rotated loading matrix for Galapagos and California sea lion dive parameters from Granito Island, Mexico and Caaman˜o Islet, Galapagos for a warm (GSL, Mar.2005 and CSL, Jul–Aug.2005) and cold season (GSL, Feb–Mar.2006 and CSL, Feb–Mar.2007). In bold are loadings from the diving variables that contributed the most for Principal components (PC) 1–4.
doi:10.1371/journal.pone.0023166.t002
Latitudinal Influence on Foraging Behavior
duration, bottom time and bottom wiggles compared to the cold season (Table 1 & Fig.2). During the warm season, CSL diving parameters, foraging areas and stable isotopes results (i.e. diet) showed greater individual variability and foraging specialization [37] possibly caused by increased intra-specific competition in less productive waters (Fig.1 & 3). This intra-specific competition during the warm and less productive season, appears to relax during the cold season when resource availability increases [37], as observed in their reduced foraging effort and variability during this season.
Species comparison
CSL and GSL respond differently to environmental variabil-ity. CSL exhibit greater variability in their diving behavior during the warm season (Table 1, Fig.2 & 3) when resources are limited compared to the cold and more productive season [37]. This diving behavior variability is confirmed by the results obtained from the stable isotope analysis. The high predictability in d15
N’s fractionation between trophic levels (, +3% per trophic step in marine ecosystems) makes it a good indicator of
Figure 2. California (CSL) and Galapagos (GSL) sea lions dive durations.Dive duration frequency distribution plots for California (CSL,Z. californianus) and Galapagos (GSL,Z. wollebaeki) sea lion females during a warm (CSL, Jul–Aug. 2005; GSL, Mar. 2005) and a cold (CSL, Feb–Mar. 2007; GSL, Aug–Sep. 2006) season.
doi:10.1371/journal.pone.0023166.g002
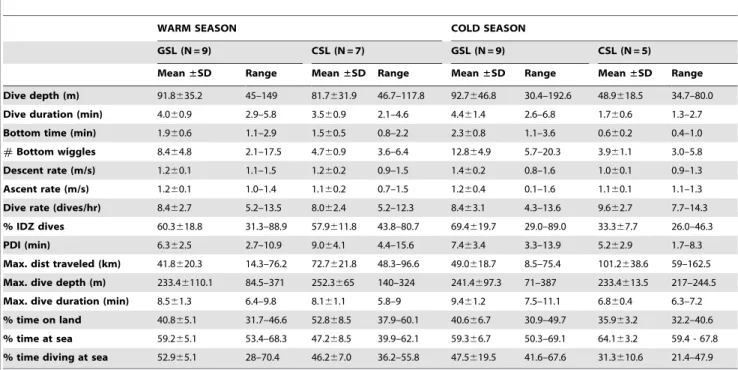
Table 3.Galapagos and California sea lions dive parameters.
WARM SEASON COLD SEASON
GSL (N = 9) CSL (N = 7) GSL (N = 9) CSL (N = 5)
Mean±SD Range Mean±SD Range Mean±SD Range Mean±SD Range
Dive depth (m) 91.8635.2 45–149 81.7631.9 46.7–117.8 92.7646.8 30.4–192.6 48.9618.5 34.7–80.0 Dive duration (min) 4.060.9 2.9–5.8 3.560.9 2.1–4.6 4.461.4 2.6–6.8 1.760.6 1.3–2.7
Bottom time (min) 1.960.6 1.1–2.9 1.560.5 0.8–2.2 2.360.8 1.1–3.6 0.660.2 0.4–1.0
#Bottom wiggles 8.464.8 2.1–17.5 4.760.9 3.6–6.4 12.864.9 5.7–20.3 3.961.1 3.0–5.8 Descent rate (m/s) 1.260.1 1.1–1.5 1.260.2 0.9–1.5 1.460.2 0.8–1.6 1.060.1 0.9–1.3
Ascent rate (m/s) 1.260.1 1.0–1.4 1.160.2 0.7–1.5 1.260.4 0.1–1.6 1.160.1 1.1–1.3
Dive rate (dives/hr) 8.462.7 5.2–13.5 8.062.4 5.2–12.3 8.463.1 4.3–13.6 9.662.7 7.7–14.3 % IDZ dives 60.3618.8 31.3–88.9 57.9611.8 43.8–80.7 69.4619.7 29.0–89.0 33.367.7 26.0–46.3
PDI (min) 6.362.5 2.7–10.9 9.064.1 4.4–15.6 7.463.4 3.3–13.9 5.262.9 1.7–8.3
Max. dist traveled (km) 41.8620.3 14.3–76.2 72.7621.8 48.3–96.6 49.0618.7 8.5–75.4 101.2638.6 59–162.5 Max. dive depth (m) 233.46110.1 84.5–371 252.3665 140–324 241.4697.3 71–387 233.4613.5 217–244.5 Max. dive duration (min) 8.561.3 6.4–9.8 8.161.1 5.8–9 9.461.2 7.5–11.1 6.860.4 6.3–7.2 % time on land 40.865.1 31.7–46.6 52.868.5 37.9–60.1 40.666.7 30.9–49.7 35.963.2 32.2–40.6 % time at sea 59.265.1 53.4–68.3 47.268.5 39.9–62.1 59.366.7 50.3–69.1 64.163.2 59.4 - 67.8 % time diving at sea 52.965.1 28–70.4 46.267.0 36.2–55.8 47.5619.5 41.6–67.6 31.3610.6 21.4–47.9 Dive parameters of Galapagos (GSL) and California (CSL) sea lions from Granito Island, Mexico and Caaman˜o Islet, Galapagos for a warm (GSL, Mar.2005 and CSL, Jul– Aug.2005) and cold season (GSL, Feb–Mar.2006 and CSL, Feb–Mar.2007).
the trophic position of consumers, whiled13
C, despite being less useful to indicate trophic level, is largely recognized to be a very good indicator of the food sources (i.e. prey items) and habitats utilized by the consumer [34,38]. Accordingly, we did not find seasonal differences ind15
N of CSL, showing that they feed on the same trophic level between seasons but with greater trophic diversity during the cold season. These results are supported by Garcia-Rodriguez and Aurioles (2004) findings [39]. However, their d13C signatures show variability in their feeding sources (prey items), which is supported by their spatial distribution and diving behavior during both seasons (i.e. pelagic vs. benthic or pelagic vs. coastal during the warm and cold season respectively)
[40] (Fig. 4). Correspondingly the diet of CSL at Granito Island has been shown to differ temporally; feeding primarily on Pacific cutlassfish (Trichiurus lepturus) in September and on sardine (Sardinops caeruleus), sanddab (Citharichthys sp.) and mictophids in January [39].
In contrast, GSL do not exhibit a change in dive behavior between seasons [29] presenting great individual variability reflected in 3 foraging strategies observed during both seasons. This persistence in foraging behavior between seasons is also revealed in theird15
N andd13
C isotopic signatures as no change was observed between seasons. GSL are likely feeding on the same trophic level between seasons (Fig. 4). GSL diet changes Figure 3. Galapagos and California sea lions’ foraging areas. Kernel analyses of Galapagos (GSL,Z. wollebaeki) and California (CSL, Z. californianus) sea lion females’ foraging areas during a warm (CSL, Jul–Aug. 2005, n = 10; GSL, Mar. 2005, n = 9) and a cold (CSL, Feb–Mar. 2007, n = 8; GSL, Aug–Sep. 2006, n = 10) season. Black arrow shows colony location.
doi:10.1371/journal.pone.0023166.g003
Latitudinal Influence on Foraging Behavior
temporally as expected from changes in primary productivity, during the warm season they feed primarily on snake eels (Ophichthus sp.), herring (Opisthonema sp.) and fish from the family Sciae-nidae, and during the cold season they feed on myctophids, sardines (Sardinops sp.) and fish from the family Ophididae [41]. Although primary productivity changes seasonally in the Galapagos
Archipelago, GSL individual specialization suggests the persistence of intra-specific competition throughout seasons as reflected in the diversity of foraging areas utilized (Fig. 3). This competition indicates that resources might be limited year-round in this area of the Galapagos, which has been described as a low produc-tivity system [42,43]. These results are consistent with foraging Figure 4. Galapagos and California sea lionsd13C andd15N values.d13
C andd15N values of Galapagos (GSL,Z. wollebaeki) and California (CSL,Z. californianus) sea lion females for a warm (CSL, Jul–Aug. 2005, n = 10; GSL, Mar. 2005, n = 11) and a cold (CSL, Feb–Mar. 2007, n = 11; GSL, Aug– Sep. 2006, n = 11) season.
observation on sea otters that suggests that intra-specific competi-tion for limited resources is an ecological prerequisite for foraging specializations [44].
Latitudinal range implications
Sea lions living in equatorial regions face a more unpredictable oceanic system with lower productivity and lower range of variation than sea lions living at higher latitudes. Hence GSL do not express plasticity in diving behavior between seasons suggesting that when living in a system with low productivity year round individuals are always competing. Additionally, GSL encounter stronger El Nin˜o events that lead to even lower productivity. In contrast, CSL encounter greater but predictable environmental change (SST and chl-a) in the form of seasonal variation. Therefore, while CSL can adjust their behavior to predictable seasonal changes in productivity, the overall lower productivity and environmental unpredictability faced by GSL makes adjustments in their behavior challenging, favoring individual prey specialization and probably making them more vulnerable to climate change [45].
CSL spent significantly more time on land than at sea with greater dive effort during the warm season when their pups are young, when rearing demands are greatest. In contrast, GSL exhibited no change in the percent of time they spent on land and at sea. Body condition was significantly lower in GSL than CSL especially during the warm season when mean SST encountered by CSL was greater, ruling out a possible cause of greater insulation due to colder temperatures. These data suggest that compared to CSL, GSL are limited in their ability to invest resources in pup rearing because although productivity is seasonally variable, it is absolutely lower in the Galapagos. This constraint generates higher nutritional stress in GSL pups reflected in a pup survival difference between the two species. CSL pup survival rates range from 0.556 to 0.998 between different years [46] while GSL pup survival rate is estimated to be between 0.55 and 0.91, with females successfully rearing pups only every other year and on average for the population at Caaman˜o Islet only one pup every three years (Mu¨ller,personal communication).
As seen in other terrestrial and marine species [10–12], GSL living in equatorial, less variable and less productive environments [37,47,48], exhibit greater foraging effort, lower foraging success (lower body condition index), and their pups face higher nutritional stress compared to CSL living in temperate regions. These differences likely influence population growth and are likely to be contributing factors in the different population status of the 2
species: GSL population being smaller, endangered and possibly with a greater risk of extinction [12] compared to CSL population that is larger, increasing and more widely distributed.
Conservation implications
While the total population of CSL is increasing [13], the population at the Gulf of California is decreasing [49] and as a consequence problems with fisheries interactions become more critical. California sea lions in the upper region of the Gulf of California obtain the main portion of their diet from a relatively small number of species and the decrease in abundance of any of these food resources can seriously affect their population [39].
The GSL population is endangered and declining [16] and is greatly affected by El Nin˜o events [50]. There has been a 50% population decline over the last 30 years [51] and one of its main conservation concerns is also the interaction with fisheries [52]. Furthermore, recent studies have shown thatZ. wollebaeki
is an important vector for the transport of marine nutrients to the terrestrial ecosystem [53]. Therefore its conservation is vital.
As these issues become more evident, knowledge of these sea lions critical habitat is crucial. Data presented here provides information of their habitat utilization, diving behavior, and foraging areas, and could potentially facilitate the creation of protected areas with regulated fishing activities for their future protection and conservation.
Acknowledgments
We thank The Charles Darwin Research Station, Parque Nacional Galapagos and CONANP (especially C.Godinez) for their logistics and fieldwork support. We thank P. Howorth and volunteers from the Marine Mammal Center in Santa Barbara for their help with fieldwork. Special thanks to F. Trillmich, S. Salazar, E. Stetson, A. Para´s, K. Gilardi, B. McDonald, D. Pa´ez, C. Martı´nez, D. Casper, M. Zavanelli, V. Michuy, M. Rutishauser, P. DalFerro, Y. Tremblay, J. Kibele, N. Stebor, P. Robinson, D. Croll, K. Newton, S. Clabuesch, F. Elorriaga, S. Barberan, R. Beas and S. Tavoni for their help in the field. Thanks to the Costa lab at UCSC for their help and support in making this work possible.
Author Contributions
Conceived and designed the experiments: SV-A. Analyzed the data: SV-A LAH. Contributed reagents/materials/analysis tools: DPC. Wrote the paper: SV-A. Participated in the field work and data collection: SV-A SES CEK LAH DPC.
References
1. Darwin C (1859) On the Origin of Species by Means of Natural Selection or the Preservation of Favoured Races in the Struggle for Life; Murray J, ed. London. 2. Mate BR, Lagerquist BA, Calambokidis J (1999) Movements of North Pacific blue whales during the feeding season off southern California and their southern fall migration. Mar Mamm Sci 15: 1246–1257.
3. Tremblay Y, Shaffer SA, Fowler SL, Kuhn CE, McDonald BI, et al. (2006) Interpolation of animal tracking data in a fluid environment. J Exp Biol 209: 128–140. 4. Schooley RL, McLaughlin CR, Matula GJ, Krohn WB (1994) Denning Chronology of Female Black Bears - Effects of Food, Weather, and Reproduction. J Mammal 75: 466–477.
5. Tanaka H (2006) Winter hibernation and body temperature fluctuation in the Japanese badger, Meles meles anakuma. Zool Sci 23: 991–997.
6. Tracy CR, Reynolds SJ, McArthur L, Tracy CR, Christian KA (2007) Ecology of aestivation in a cocoon-forming frog, Cyclorana australis (Hylidae). Copeia. pp 901–912.
7. Costa DP (1991) Reproductive and Foraging Energetics of High-Latitude Penguins, Albatrosses and Pinnipeds - Implications for Life-History Patterns. Am Zool 31: 111–130.
8. Orians GH, Pearson NE (1979) On the theory of central place foraging; Horn DJ, Mitchell RD, Stairs GR, eds. Columbus: Ohio State University Press. pp 154–177.
9. Longhurst A, Sathyendranath S, Platt T, Caverhill C (1995) An Estimate of Global Primary Production in the Ocean from Satellite Radiometer Data. J Plankton Res 17: 1245–1271.
10. Johnson CN (1998) Rarity in the tropics: latitudinal gradients in distribution and abundance in Australian mammals. J Anim Ecol 67: 689–698.
11. Hockey PAR, Wilson WA (2003) Reproductive traits of marine terns (Sternidae): evidence for food limitation in the tropics? Ostrich 74: 110–116.
12. Ferguson SH, Higdon JW (2006) How seals divide up the world: environment, life history, and conservation. Oecologia 150: 318–329.
13. Costa DP, Weise MJ, Arnould JPY (2006) Potential Influences of Whaling on the Status and Trends of Pinniped populations; Estes JA, deMaster DP, Doak DF, Williams TM, Rownell RLJ, eds. Berkeley, Los Angeles, London: University of California Press. pp 344–359.
14. Aurioles D, Trillmich F (2008) Zalophus californianus. IUCN: 2008 IUCN Red List of Threatened Species website. Available: http://www.iucnredlist.org/. Accessed 2011 Jul 20.
15. Salazar SK (2005) Variacio´n temporal y espacial del espectro tro´fico del lobo marino de Gala´pagos. La Paz, BCS, Me´xico: Instituto Polite´cnico Nacional (IPN). 16. Aurioles D, Trillmich F (2008)Zalophus wollebaeki. IUCN 2008 IUCN Red List of Threatened Species website. Available: http://www.iucnredlist.org/. Accessed 2011 Jul 20.
Latitudinal Influence on Foraging Behavior
17. Halsey LG, Blackburn TM, Butler PJ (2006) A comparative analysis of the diving behaviour of birds and mammals. Funct Ecol 20: 889–899.
18. Costa DP, Gales NJ (2003) Energetics of a benthic diver: seasonal foraging ecology of the Australian sea lion,Neophoca cinerea.Ecol Monogr 73: 27–43. 19. Costa DP, Gales NJ (2000) Foraging energetics and diving behavior of lactating
New Zealand sea lions,Phocarctos hookeri. J Exp Biol 203: 3655–3665. 20. Campagna C, Werner R, Karesh W, Marin MR, Koontz F, et al. (2001)
Movements and location at sea of South American sea lions (Otaria flavescens). J Zool 257: 205–220.
21. Kooyman GL, Trillmich F (1986) Diving Behavior of Galapagos Sea Lions ;Gentry RL, Kooyman GL, eds. New Jersey: Princeton University Press. pp 209–219. 22. Villegas-Amtmann S, Costa DP, Tremblay Y, Salazar S, Aurioles-Gamboa D (2008) Multiple foraging strategies in a marine apex predator, the Galapagos sea lion Zalophus wollebaeki. Mar Ecol Prog Ser 363: 299–309.
23. Feldkamp SD, DeLong RL, Antonelis GA (1989) Diving patterns of California sea lions,Zalophus californianus. Can J Zool 67: 872–883.
24. Kuhn CE (2006) Measuring feeding rates to understand the foraging behavior of pinnipeds. Santa Cruz: University of California Santa Cruz.
25. Merrick RL, Loughlin TR (1997) Foraging behavior of adult female and young-of-the-year Steller sea lions in Alaska waters. Can J Zool 75: 776–786. 26. Mattlin RH, Gales NJ, Costa DP (1998) Seasonal dive behavior of lactating New
Zealand fur seals (Arctocephalus forsteri). Can J Zool 76: 350–360.
27. Georges JY, Tremblay Y, Guinet C (2000) Seasonal diving behavior in lactating subantarctic fur seals on Amsterdam Island. Polar Biol 23: 59–69.
28. Beauplet G, Dubroca L, Guinet C, Cherel Y, Dabin W, et al. (2004) Foraging ecology of subantarctic fur sealsArctocephalus tropicalisbreeding on Amsterdam Island: seasonal changes in relation to maternal characteristics and pup growth. Mar Ecol Prog Ser 273: 211–225.
29. Villegas-Amtmann S, Costa DP (2010) Oxygen stores plasticity linked to foraging behaviour and pregnancy in a diving predator, the Galapagos sea lion. Funct Ecol 24: 785–795.
30. Gales NJ, Mattlin RH (1997) Summer diving behavior of lactating New Zealand sea lions,Phocarctos hookeri.Can J Zool 75: 1695–1706.
31. Kotiaho JS (1999) Estimating fitness: comparison of body condition indices revisited. Oikos 87: 399–400.
32. Tremblay Y, Cherel Y (2003) Geographic variation in the foraging behavior, diet and chick growth of rockhopper penguins. Mar Ecol Prog Ser 251: 279–297. 33. McGarigal K, Cushman S, Stafford S (2000) Multivariate Statistics for Wildlife
and Ecology Research. New York: Springer-Verlag.
34. Gannes LZ, Obrien DM, delRio CM (1997) Stable isotopes in animal ecology: Assump-tions, caveats, and a call for more laboratory experiments. Ecology 78: 1271–1276. 35. Tieszen LL, Boutton TW, Tesdahl KG, Slade NA (1983) Fractionation and
Turnover of Stable Carbon Isotopes in Animal-Tissues - Implications for Delta-C-13 Analysis of Diet. Oecologia 57: 32–37.
36. Dalerum F, Angerbjorn A (2005) Resolving temporal variation in vertebrate diets using naturally occurring stable isotopes. Oecologia 144: 647–658. 37. Zeitzsch B (1969) Primary Productivity in Gulf of California. Mar Biol 3:
201–207.
38. Kelly JF (2000) Stable isotopes of carbon and nitrogen in the study of avian and mammalian trophic ecology. Can J Zool/Rev Can Zool 78: 1–27.
39. Garcia-Rodriguez FJ, Aurioles-Gamboa D (2004) Spatial and temporal variation in the diet of the California sea lion (Zalophus californianus) in the Gulf of California, Mexico.R102: 47–62.
40. Huckstadt LA, Rojas CP, Antezana T (2007) Stable isotope analysis reveals pelagic foraging by the Southern sea lion in central Chile. J Exp Mar Biol Ecol 347: 123–133.
41. Salazar-Alda´s D (2007) Ecologia alimentaria del lobo marino de Galapagos (Zalophus wollebaeki) en el islote Caaman˜o. Quito, Ecuador: Universidad Central del Ecuador. 122 p.
42. Martin JH, Coale KH, Johnson KS, Fitzwater SE, Gordon RM, et al. (1994) Testing the Iron Hypothesis in Ecosystems of the Equatorial Pacific-Ocean. Nature 371: 123–129.
43. Sakamoto CM, Millero FJ, Yao WS, Friederich GE, Chavez FP (1998) Surface seawater distributions of inorganic carbon and nutrients around the Galapagos Islands: results from the PlumEx experiment using automated chemical mapping. Deep Sea Res 45: 1055–1071.
44. Estes JA, Riedman ML, Staedler MM, Tinker MT, Lyon BE (2003) Individual variation in prey selection by sea otters: patterns, causes and implications. J Anim Ecol 72: 144–155.
45. Tinker MT, Costa DP, Estes JA, Wieringa N (2007) Individual dietary specialization and dive behaviour in the California sea otter: Using archival time-depth data to detect alternative foraging strategies. Deep Sea Res 54: 330–342.
46. Hernandez-Camacho CJ, Aurioles-Gamboa D, Laake J, Gerber LR (2008) Survival rates of the California sea lion, Zalophus californianus, in Mexico. J Mammal 89: 1059–1066.
47. Pak H, Zanveld JRV (1973) The Cromwell Current on the east side of the Galapagos Islands. J Geophys Res 78: 4845–7859.
48. Feldman GC (1986) Patterns of phytoplankton production around the Galapagos islands. Bowman J, Yentsch M, W TP, eds. Berlin, Germany: Springer-Verlag. pp 77–106.
49. Szteren D, Aurioles D, Gerber L (2006) Population status and trends of the California Sea lion in the Gulf of California, Mexico ; Trites A, Atkinson S, DeMaster DP, Fritz LW, Gelatt TS, et al., eds. Alaska: University of Alaska Fairbanks. pp 369–384.
50. Trillmich F, Limberger D (1985) Drastic effects of El Nin˜o on Galapagos pinnipeds. Oecologia 67: 19–22.
51. Alava JJ, Salazar S (2006) Status and conservation of Otariids in Ecuador and the Galapagos Islands. In: Trites AW, Atkinson SK, DeMaster DP, Fritz LW, Gelatt TS et al., eds. Sea Lions of the World. Fairbanks: Alaska Sea Grant College Program. pp 495–520.