Mammalian Niche Conservation through Deep Time
Larisa R. G. DeSantis1*, Rachel A. Beavins Tracy1, Cassandra S. Koontz2, John C. Roseberry1,
Matthew C. Velasco2
1Department of Earth and Environmental Sciences, Vanderbilt University, Nashville, Tennessee, United States of America,2Department of Anthropology, Vanderbilt University, Nashville, Tennessee, United States of America
Abstract
Climate change alters species distributions, causing plants and animals to move north or to higher elevations with current warming. Bioclimatic models predict species distributions based on extant realized niches and assume niche conservation. Here, we evaluate if proxies for niches (i.e., range areas) are conserved at the family level through deep time, from the Eocene to the Pleistocene. We analyze the occurrence of all mammalian families in the continental USA, calculating range area, percent range area occupied, range area rank, and range polygon centroids during each epoch. Percent range area occupied significantly increases from the Oligocene to the Miocene and again from the Pliocene to the Pleistocene; however, mammalian families maintain statistical concordance between rank orders across time. Families with greater taxonomic diversity occupy a greater percent of available range area during each epoch and net changes in taxonomic diversity are significantly positively related to changes in percent range area occupied from the Eocene to the Pleistocene. Furthermore, gains and losses in generic and species diversity are remarkably consistent with,2.3 species gained per generic increase. Centroids demonstrate southeastern shifts from the Eocene through the Pleistocene that may correspond to major environmental events and/or climate changes during the Cenozoic. These results demonstrate range conservation at the family level and support the idea that niche conservation at higher taxonomic levels operates over deep time and may be controlled by life history traits. Furthermore, families containing megafauna and/or terminal Pleistocene extinction victims do not incur significantly greater declines in range area rank than families containing only smaller taxa and/or only survivors, from the Pliocene to Pleistocene. Collectively, these data evince the resilience of families to climate and/or environmental change in deep time, the absence of terminal Pleistocene ‘‘extinction prone’’ families, and provide valuable insights to understanding mammalian responses to current climate change.
Citation:DeSantis LRG, Beavins Tracy RA, Koontz CS, Roseberry JC, Velasco MC (2012) Mammalian Niche Conservation through Deep Time. PLoS ONE 7(4): e35624. doi:10.1371/journal.pone.0035624
Editor:David Nogues-Bravo, University of Copenhagen, Denmark
ReceivedAugust 30, 2011;AcceptedMarch 22, 2012;PublishedApril 23, 2012
Copyright:ß2012 DeSantis et al. This is an open-access article distributed under the terms of the Creative Commons Attribution License, which permits unrestricted use, distribution, and reproduction in any medium, provided the original author and source are credited.
Funding:Funding was provided by Vanderbilt University. The funders had no role in study design, data collection and analysis, decision to publish, or preparation of the manuscript.
Competing Interests:The authors have declared that no competing interests exist. * E-mail: [email protected]
Introduction
Understanding mammalian responses to climate change both today and in the past is critical to predicting potential responses to future climate change. Currently, mammals change their distri-butions, abundances, and phenology in response to ongoing climate change (e.g., [1–4]). Mammals have also demonstrated dramatic dietary responses to interglacial warming during the Pleistocene [5]. This dietary plasticity documents the adaptability of mammals to change their dietary behavior in response to available resources and falsifies the idea that dietary niches are conserved over time. However, there is also evidence that the niches of mammals based on temperature and precipitation are conserved during the last glacial to interglacial transition [6]. Similarly, the conservation of niches, as determined by relative range size, occurs above the species level during the late Pleistocene to late Holocene [7]. As the majority of bioclimatic envelope models predict future species distributions based on the assumption that niches are conserved over time, it is critical to further test if niche conservation occurs at higher taxonomic levels through deep time.
Niche conservatism can be defined as the capacity of a species to retain components of their fundamental niche over time [8] or the
phenomenon that enables species to persist in ecological environ-ments over time [7]. Thus, niche conservatism promotes the maintenance of species distributions over time; however, controls on niche conservatism vary from the species to higher taxonomic levels [7]. Recent reviews on the prevalence of niche conservatism reveal that ‘niche conservatism’ is generally widespread, although it is often defined and assessed using diverse methods (e.g., [8–10]). In many cases range area is used as a proxy for an organism’s niche, and compared through time (e.g., [6], [7]). Although range area is likely reflecting an organism’s realized niche, it is often the best proxy available for assessing ecological and/or climatic niches as species ranges encompass habitats, dietary resources, and thermal conditions that allow for their survival. Range areas can also be assessed at multiple taxonomic scales (e.g., species to family) today and compared through time via historic and fossil records. For example, Hadly et al. [7] found that at the genus and family levels, range sizes were relatively consistent between the late Pleistocene and late Holocene, suggesting that niche conservatism occurs above the species level.Conversely, species within a genus may divide up niche space based on the availability of resources and subsequently be more susceptible to fluctuating climates and environmental resources [7].
While much debate has focused on whether or not niches are conserved, there is a need to better understand the temporal dimensions of ecological niche conservation [10]. Furthermore, Wiens and Graham [8] suggest focusing on the effects of niche conservatism. For example, does niche conservatism affect a taxon’s vulnerability to extinction? This perspective may clarify potential causal factors behind the terminal Pleistocene extinction. As human activities have directly and indirectly impacted biodiversity through time and space via habitat fragmentation, hunting/fishing, the introduction of invasive species, global warming, and the synergistic effects of multiple factors [11–15], many [16–19] argue that human activity, rather than climate change, was the primary cause of Pleistocene megafaunal extinctions. In order to elucidate the variety of causal factors (human and non-human) which may have contributed to species extinction during the Pleistocene, we must first understand how mammals altered their niches through time and if families that went locally extinct in North America were already declining in range size. Similar work examining range shifts during the late Pleistocene demonstrates that Pleistocene survivors and victims responded similarly [20]; however, little is known about how families alter their niches over deep time including prior to the Pleistocene.
Through a meta-analysis of North American mammalian range changes from the Eocene through the Pleistocene, we build on previous work [7], [20–21] to determine whether relative range size is conserved at the family level for North American mammals, including those that did not survive the terminal Pleistocene extinction. We add to the families studied by Hadly et al. [7], in the contiguous United States, and extend their work in deep time to include epoch-scale time bins for the Eocene through the Pleistocene. Herein, we use the mammalian fossil record (via the Paleobiology Database [22]) to determine absolute and relative range sizes (a proxy for an organism’s realized ecological niche) that allow us to ask the following principal questions: (i) are mammalian ranges conserved at higher taxonomic levels through deep time, (ii) do environmental and/or climatic changes affect relative and/or absolute range sizes differently at higher taxonomic levels, and (iii) how does taxonomic diversity within a family (e.g., the number of genera and/or species) affect relative range size? Furthermore, we quantify changes in the centroids of range area polygons over time to assess if centroid locations shifted south through time, possibly in response to post-Eocene cooling. The analysis of mammalian range changes through deep time can clarify how climate and environmental changes affect mammalian families and the potential influence of these variables on range conservation.
We also examine if particular niche characteristics influence range changes at the family level from the Pliocene to the Pleistocene. Specifically, we ask the following: (i) were families that went locally extinct in North America during the Pleistocene already on the decline, (ii) did maximum body size of family members affect changes in range size, and (iii) were particular orders and/or functional groups (e.g., ungulates, carnivorans) more successful at increasing their ranges since the Pliocene? If body size or other intrinsic life history characteristics are more susceptible to climate change, we expect that families containing megafauna would respond similarly. Likewise, higher level categorizations such as taxonomic orders or functional groups may also reflect similar responses to climatic changes.
Similar to previous studies that focused on the Pleistocene and Holocene [7], [20–21] we examined absolute range size (additionally standardizing ranges by using percent range area occupied, see Methods) and centroids of mammalian taxa;
however, we also analyzed relative range sizes in accordance with Hadly et al. [7] to control for sampling biases (including taphonomy and varying continental land areas) across epochs. Furthermore, to examine range conservatism over deep time it was necessary to both examine taxa at the family level and compare across epochs. Although not all family groupings are monophy-letic, mammals present less disagreement than other animals and plants, reflect evolutionary relationships, and share similar life history traits (e.g., equids, camelids, felids). Additionally, families persist over deep time (in contrast to genus and species groups) and fossils can typically be identified to both the family level and attributed to a given epoch.
Results
Geographic Range Size and Taxonomic Diversity
In order to assess overall trends in range expansion and contraction, we analyzed the absolute change in percent range area occupied from each epoch to the next consecutive epoch (see Methods; Table 1, S1, S2). There is no significant increase in percent range area occupied from the Eocene to the Oligocene
(55% increased,n= 11, average change of+5.9%; Table S2). In
contrast, from the Oligocene to the Miocene there was a
significant increase in percent range area occupied (n= 18, average
change of+31.6%;p,0.001 for all families and those with 10 or
more localities, and p= 0.027 for families with 25 or more
localities); 13 families increased while only 3 (Aplodontidae, Geomyidae, and Leporidae) decreased (net loss of 16.4, 7.4, and 2.3 percent range area occupied, respectively). Conversely, from the Miocene to Pliocene, there is no clear pattern with 13 of 25 families declining in percent range area occupied (average change
of 24.0; Table S2). Of the families spanning the Pliocene to
Pleistocene transition (n= 28), all except Antilocapridae (net loss of
6.2 percent range area occupied) increased their ranges (average
change of+19.3%;p,0.0001 for all comparisons, regardless of
number of localities, Table S2).
During the Pleistocene, latitudinal and longitudinal extents are
strongly correlated with log range size (R2= 0.84, p,0.0001;
R2= 0.92,p,0.0001; respectively). Latitudinal extent and
longi-tudinal extent independently account for 70% and 84% of the
variance in range size (R2= 0.70, p,0.0001; R2= 0.84,
p,0.0001). Together, latitudinal and longitudinal extent account
for 90% of the variance in range size (R2= 0.90,p,0.0001). The
lowest maximum latitudinal and longitudinal extents (decimal degrees) occur during the Eocene (17.4 and 17.8, respectively), while the greatest latitudinal and longitudinal extents occur during the Pleistocene and Miocene (22.3 and 51.7, respectively), all demonstrated by the family Equidae. Some minor discrepancies exist between family range size and latitudinal/longitudinal extent. For example, Camelidae had the largest latitudinal extent in the Pleistocene (tied with Equidae), but was only ranked 21 in range size. Similarly, Tapiridae had the largest longitudinal extent in this epoch but fell below the median range size. However, as latitudinal and longitudinal extents of mammalian families are highly correlated with range size, we do not comprehensively discuss longitudinal and latitudinal extents of mammalian families as these metrics similarly quantify the same underlying patterns of family distributions.
At any given epoch, there is a significant positive relationship between generic diversity (minimum number of genera per family, see Methods) and percent range area occupied (Table 2). The same relationship is true at the species level during each epoch, with the exception of the Pliocene where the relationship
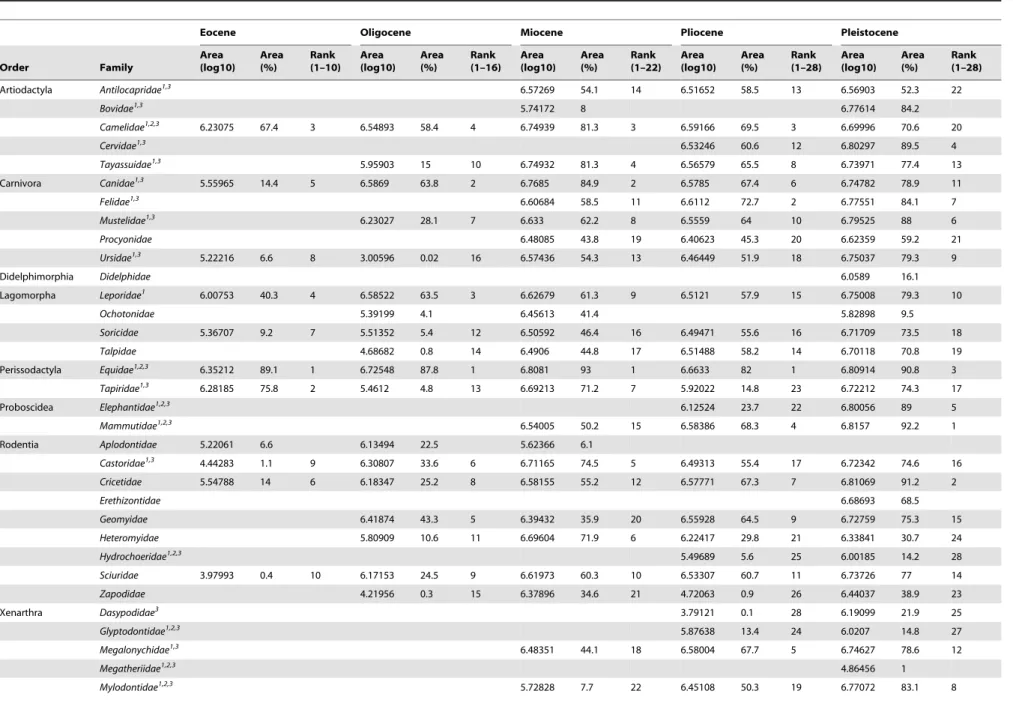
Table 1.Range size and rank of North American families from the Eocene to Pleistocene.
Eocene Oligocene Miocene Pliocene Pleistocene
Order Family
Area (log10)
Area (%)
Rank (1–10)
Area (log10)
Area (%)
Rank (1–16)
Area (log10)
Area (%)
Rank (1–22)
Area (log10)
Area (%)
Rank (1–28)
Area (log10)
Area (%)
Rank (1–28)
Artiodactyla Antilocapridae1,3 6.57269 54.1 14 6.51652 58.5 13 6.56903 52.3 22
Bovidae1,3 5.74172 8 6.77614 84.2
Camelidae1,2,3
6.23075 67.4 3 6.54893 58.4 4 6.74939 81.3 3 6.59166 69.5 3 6.69996 70.6 20
Cervidae1,3
6.53246 60.6 12 6.80297 89.5 4
Tayassuidae1,3 5.95903 15 10 6.74932 81.3 4 6.56579 65.5 8 6.73971 77.4 13 Carnivora Canidae1,3
5.55965 14.4 5 6.5869 63.8 2 6.7685 84.9 2 6.5785 67.4 6 6.74782 78.9 11
Felidae1,3
6.60684 58.5 11 6.6112 72.7 2 6.77551 84.1 7
Mustelidae1,3 6.23027 28.1 7 6.633 62.2 8 6.5559 64 10 6.79525 88 6
Procyonidae 6.48085 43.8 19 6.40623 45.3 20 6.62359 59.2 21
Ursidae1,3
5.22216 6.6 8 3.00596 0.02 16 6.57436 54.3 13 6.46449 51.9 18 6.75037 79.3 9
Didelphimorphia Didelphidae 6.0589 16.1
Lagomorpha Leporidae1
6.00753 40.3 4 6.58522 63.5 3 6.62679 61.3 9 6.5121 57.9 15 6.75008 79.3 10
Ochotonidae 5.39199 4.1 6.45613 41.4 5.82898 9.5
Soricidae 5.36707 9.2 7 5.51352 5.4 12 6.50592 46.4 16 6.49471 55.6 16 6.71709 73.5 18
Talpidae 4.68682 0.8 14 6.4906 44.8 17 6.51488 58.2 14 6.70118 70.8 19 Perissodactyla Equidae1,2,3
6.35212 89.1 1 6.72548 87.8 1 6.8081 93 1 6.6633 82 1 6.80914 90.8 3
Tapiridae1,3 6.28185 75.8 2 5.4612 4.8 13 6.69213 71.2 7 5.92022 14.8 23 6.72212 74.3 17
Proboscidea Elephantidae1,2,3 6.12524 23.7 22 6.80056 89 5
Mammutidae1,2,3
6.54005 50.2 15 6.58386 68.3 4 6.8157 92.2 1 Rodentia Aplodontidae 5.22061 6.6 6.13494 22.5 5.62366 6.1
Castoridae1,3 4.44283 1.1 9 6.30807 33.6 6 6.71165 74.5 5 6.49313 55.4 17 6.72342 74.6 16
Cricetidae 5.54788 14 6 6.18347 25.2 8 6.58155 55.2 12 6.57771 67.3 7 6.81069 91.2 2
Erethizontidae 6.68693 68.5
Geomyidae 6.41874 43.3 5 6.39432 35.9 20 6.55928 64.5 9 6.72759 75.3 15
Heteromyidae 5.80909 10.6 11 6.69604 71.9 6 6.22417 29.8 21 6.33841 30.7 24
Hydrochoeridae1,2,3
5.49689 5.6 25 6.00185 14.2 28
Sciuridae 3.97993 0.4 10 6.17153 24.5 9 6.61973 60.3 10 6.53307 60.7 11 6.73726 77 14
Zapodidae 4.21956 0.3 15 6.37896 34.6 21 4.72063 0.9 26 6.44037 38.9 23 Xenarthra Dasypodidae3
3.79121 0.1 28 6.19099 21.9 25
Glyptodontidae1,2,3 5.87638 13.4 24 6.0207 14.8 27
Megalonychidae1,3
6.48351 44.1 18 6.58004 67.7 5 6.74627 78.6 12
Megatheriidae1,2,3
4.86456 1
Mylodontidae1,2,3 5.72828 7.7 22 6.45108 50.3 19 6.77072 83.1 8
Mammal
ian
Niche
Conservation
through
Deep
Time
PLoS
ONE
|
www.plos
one.org
3
April
2012
|
Volume
7
|
Issue
4
|
these relationships are greatest during the Eocene-Miocene
(R2= 0.42 to 0.73), in contrast to the Pliocene and Pleistocene
(R2,0.20 during the Pliocene and Pleistocene; Table 2). Similarly,
taxonomic diversity (e.g., a net increase in minimum number of genera or species) is significantly positively related to net changes in percent range area occupied, when including all changes between consecutive epochs of all families from the Eocene to the Pleistocene (Figure 1, Table S3). However, changes between any two consecutive epochs in taxonomic diversity and percent range area occupied are not significantly related, with the exception of changes in net species diversity during the Eocene to the
Oligocene (p= 0.037, R2= 0.40; Table S3).
Changes in minimum number of genera and species per family between consecutive epochs follow similar patterns to range area percent changes. Specifically, generic and species diversity on
average increase from the Eocene to the Oligocene (n= 11, net
changes of+3.3 and+5.3, respectively, although only significant at
the generic level when all families are included,p= 0.036, Table
S2). From the Oligocene to the Miocene significant gains in diversity occur at both the generic and species levels (all families with the exception of Aplodontidae increase in both generic and
species diversity; n = 18, average net changes of+7.6 and+16.9,
respectively;p#0.01 for all comparisons, Table S2). In contrast to
the lack of a clear pattern in percent range area occupied from the Miocene to the Pliocene, significant declines in generic and species diversity are observed (all families exhibit either zero change or net
losses in species diversity, with the exception of Cricetidae;n= 25,
average net changes of26.0 and213.1, respectively;p#0.01 for
all comparisons, Table S2). During the Pliocene to Pleistocene average net changes in generic and species diversity are positive,
but only significantly so at the species level (n= 28, average net
changes +0.6 and +4.7, respectively; p,0.01 for all species
comparisons). Furthermore, there is a highly significant relation-ship between net changes in genera and net changes in species
between consecutive epochs (p,0.001, R2$0.56 for all
compar-isons) and between all consecutive epochs from the Eocene to the
Pleistocene, collectively (p,0.0001, R2= 0.79; Figure 1C, Table
S4). During the Miocene to the Pliocene increases in generic diversity can and do occur with zero net changes or losses in species diversity (Felidae and Mylodontidae yield zero change in species diversity while Leporidae increases in 4 genera and declines in one species). In contrast, losses in generic diversity and zero losses or gains in species diversity occur in 18% of all families (Camelidae, Equidae, Felidae, Leporidae, and Soricidae) while 50% of all families yield zero change in generic diversity (with 6 of these 14 families also exhibiting zero change in species diversity) from the Pliocene to the Pleistocene.
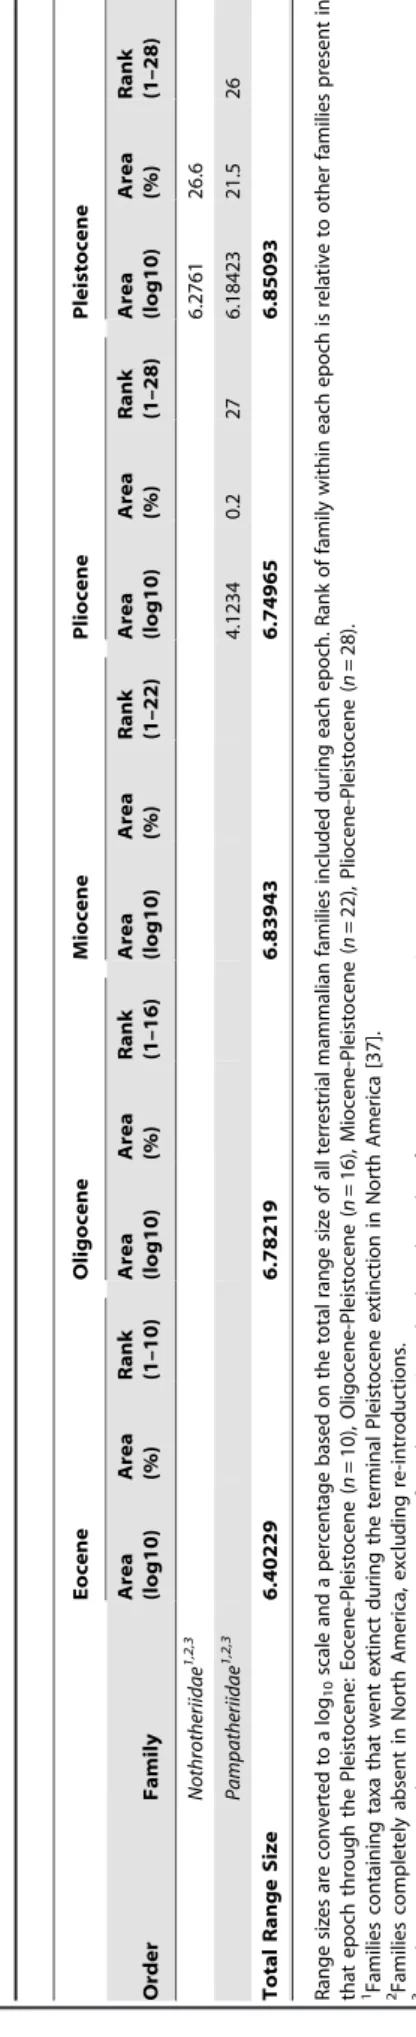
Table 1. Cont. Eocene Oligocene Miocene Pliocene Pleistocene Order Family Area (log10) Area (%) Rank (1–10) Area (log10) Area (%) Rank (1–16) Area (log10) Area (%) Rank (1–22) Area (log10) Area (%) Rank (1–28) Area (log10) Area (%) Rank (1–28) Nothrotheriidae 1,2,3 6.2761 26.6 Pampatheriidae 1,2,3 4.1234 0.2 27 6.18423 21.5 26 Total Range Size 6.40229 6.78219 6.83943 6.74965 6.85093 Range sizes are converted to a log 10 scale and a percentage b ased on the total range size of all terrestrial mammalian families included during each epoch. Rank of family within each epoch is relative to o ther families present in that epoch through the P leistocene: Eocene-Pleistocene ( n = 10), O ligocene-Pleistocene ( n = 1 6), Miocene-Pleistocene ( n = 2 2), Pliocene-Pleistocene ( n = 28). 1Families containing taxa that went extinct during the terminal Pleistocene extinction in North America [37]. 2Families completely absent in North America, excluding re-introductions. 3Families containing at least one extinct or extant megafaunal taxon ( $ 45 kg; b ased on data from [22], [33], [39–42]). doi:10.1371/journal.pone. 0035624.t001
Table 2.Relationship between minimum number of genera or minimum number of species and percent range area occupied during each epoch.
Variables Eocene Oligocene Miocene Pliocene Pleistocene
Minimum genera p,0.001 p= 0.004 p,0.0001 p= 0.023p= 0.021 R2= 0.73 R2= 0.42 R2= 0.50 R2= 0.18 R2= 0.16 Minimum species p= 0.004p,0.001 p,0.0001 p= 0.057 p= 0.042
R2= 0.62 R2= 0.52 R2= 0.49 R2= 0.13
R2= 0.12
Significantp-values and subsequent R2values are noted in bold. All slopes/ relationships are positive.
Mammalian Niche Conservation through Deep Time
Range Size Rank Change and Concordance
Rank changes of families present across all time periods (n= 10)
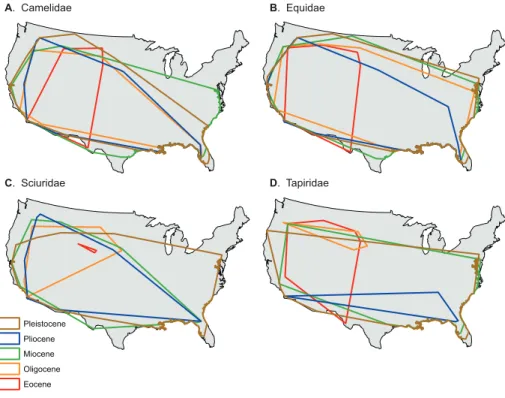
do not follow the same patterns of percent range area occupied (Table S1, Figure 2). From the Eocene to Pleistocene (Table 1, S5), Equidae held the number one ranking in all epochs except for the Pleistocene, where it was second to Cricetidae. Camelidae had the next highest ranks from the Eocene to the Pliocene, falling no lower than fourth and with a rank of 2 during the Pliocene; however, it ranked last in the Pleistocene (among taxa present since the Eocene; 20 out of 28 compared to taxa present since the Pliocene) and demonstrated the largest rank decline of all taxa. Sciuridae and Tapiridae were consistently in the bottom half of range size rankings. Sciuridae increased or maintained its rank from the Eocene through the Pliocene, falling one rank in the Pleistocene. Tapiridae alternated between decreasing and increas-ing in rank from the Eocene to the Pleistocene.
Despite the majority of families either increasing or decreasing in rank at each boundary (Table 1), range size rankings within all four time intervals show statistically significant concordance (at
a= .05; Table 3). Kendall’s W indicates moderate concordance of
ranks across older time intervals (i.e., Eocene-Pleistocene,
Oligocene-Pleistocene, Miocene-Pleistocene; W.0.5; Table 3).
Between the Pliocene and Pleistocene, ranks were strongly concordant (Kendall’s W = 0.824), indicating constancy in relative range size, even though no family maintained precisely the same rank across the transition (Table 3). Additionally, both Pliocene range size ranks and percent range area occupied are correlated
with Pleistocene range size ranks and percent range area occupied,
respectively (R2= 0.42,p,0.001; R2= 0.64,p,0.0001, Figure 3).
Families present during both the Pliocene and Pleistocene were also grouped into various qualitative categories to assess taxonomic and evolutionary influences on range conservatism. At the order or higher taxonomic level (e.g., ungulates and xenarthrans), ungulates averaged 8.38 absolute rank changes (ARC), significantly greater
than rodents (average ARC = 3.43; Fisher’s LSD,p= 0.029). Two
other higher level groupings of multiple families, carnivorans and xenarthrans, ranged from 4.8 to 5 mean ARC from the Pliocene to Pleistocene, but no group was statistically different from rodents, ungulates, or each other. In contrast, gross rank changes (GRC; i.e., raw relative rank changes noting negative or positive changes) per taxonomic group lack significant differences as all averaged
,1 or less gross changes in relative rank. Furthermore,,50% of
families within the groups carnivorans, rodents, xenarthrans, and ungulates increase/decrease in rank, with any deviations from 50% occurring in groups with an odd-number of families (e.g., increases in relative range size occur in 2 of 5 carnivorans, 3 of 7 rodents, 3 of 5 xenarthrans, and 4 of 8 ungulates).
Families containing taxa that went locally extinct in North
America during the Pleistocene (n= 20, Table 1) have an ARC
and GRC of 6.2 and20.6, respectively. These changes are not
significantly different from the ARC and GRC values of taxa containing only survivors (3.5 and 1.5; Mann-Whitney’s U, p= 0.143,p= 0.476, respectively). Furthermore, there are approx-imately equal numbers of taxa exhibiting increases (55%) as Figure 1. Relationships between changes in species, genera, and percent range area occupied through time.A) Minimum genera change and range area change (% occupied; R2= 0.25,p,0.0001); B) minimum species change and range area change (% occupied; R2= 0.17, p,0.001); and, C) minimum genera change and minimum species change (R2= 0.79,p,0.0001) from the Eocene to Oligocene (red diamonds), Oligocene to Miocene (orange circles), Miocene to Pliocene (green triangles), and Pliocene to Pleistocene (blue Xs), with linear regression trend lines noted in solid black for all data and dashed colored lines corresponding to specific epochs (Eocene to Oligocene, R2= 0.91,p,0.0001; Oligocene to
Miocene, R2= 0.56,p,0.001; Miocene to Pliocene, R2= 0.76,p,0.0001; Pliocene to Pleistocene, R2= 0.69,p,0.0001).
doi:10.1371/journal.pone.0035624.g001
decreases (45%) in relative range size rank in families containing victims. This is in contrast to families containing all survivors that decrease (75%) more frequently than increase (25%) in relative range size rank. Similar patterns were demonstrated when comparing families that went locally extinct in North America (ARC and GRC of 4.8 and 0.4, respectively) to those that contain
at least one surviving species (ARC and GRC of 7.1 and20.9,
respectively), yielding no significant differences (Mann-Whitney’s
U,P= 0.981,P= 0.628, respectively). Additionally, the number of
taxa increasing versus decreasing relative range size rank is approximately equal in both survivors (45% increase, 55% decrease) and victims (50% increase/decrease). Lastly, while approximately equal number of taxa increasing and decreasing in relative range size rank were found in megafauna (53% and 47%, respectively), smaller bodied taxa typically decrease in relative range size rank (66% decrease, 33% increase); however, ARC and GRC values are not significantly different
(Mann-Whitney’s U,P= 0.187; Fisher LSD,P= 0.690; respectively).
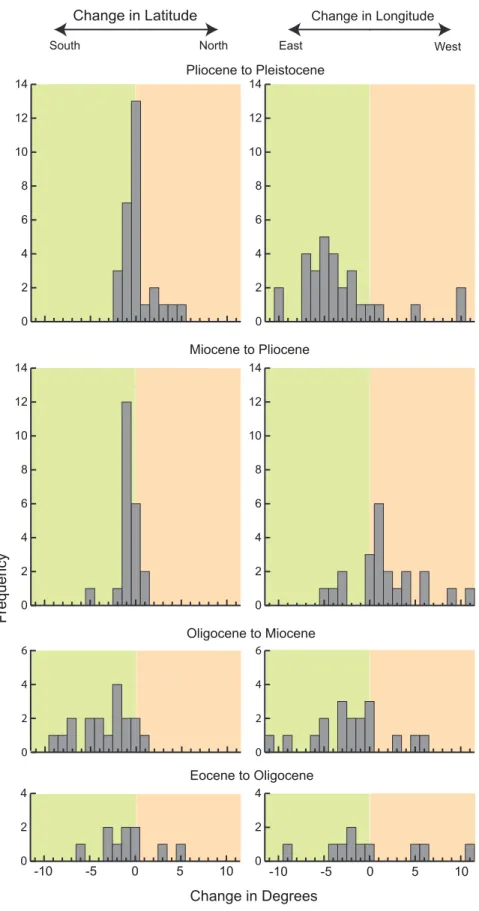
Centroid
In this study, centroids (i.e., the geometric center of the geographic range polygon) for families generally shift to the southeast from the Eocene to Pleistocene (Figures 4 and 5). The distribution of centroid shifts between epochs is more variable between the Eocene to Oligocene and Oligocene to Miocene than from the Miocene to Pliocene and Pliocene to Pleistocene (Figure 4). During the Miocene to Pliocene and Pliocene to
Pleistocene, shifts in centroid latitudes are closely grouped around
61u; however, shifts in longitude are skewed to the east (centered
at,5u) during the Pliocene to Pleistocene and slightly skewed to
the west in the Miocene to Pliocene.
Discussion
In contrast to absolute range size which is constrained by preservation biases, percent range area occupied and range size rank standardize sampling effort, taphonomy, and continental areas across each epoch. Overall, we observe large expansions in percent range area occupied from the Oligocene to the Miocene and from the Pliocene to Pleistocene, with mixed trends leading up to the Oligocene and between the Miocene and Pliocene. Habitat availability and climactic factors may have affected ecological niches during each epoch. For example, it may be that relative range area expansion during the Miocene was a response to changing habitable niches associated with the Miocene grassland expansion [23–25]. The range fluctuation of Tapiridae across time (Figure 2D) is likely not only reflective of this major event, but also of forest expansions and contractions since the Eocene [26]. Furthermore, increasing relative range sizes of nearly all families from the Pliocene to the Pleistocene could be related to pronounced global cooling since the mid-Miocene climatic optimum and/or a result of glacial-interglacial cycling during the Pleistocene [27–28].
Alternatively, percent range area occupied may be influenced by taxonomic diversity. During any given epoch from the Eocene to the Pleistocene, the greater generic or species diversity the greater percent range area occupied, per family (Table 2). Although significant or approaching significance during the Pliocene and Pleistocene, the predictive power of taxonomic diversity is lower than during prior epochs (Table 2). Furthermore, there is only a significant positive relationship between net gains in taxonomic diversity and net gains in percent range area occupied when including all consecutive epoch comparisons from the Eocene to the Pleistocene (Figure 1, Table S3); thus, changes in taxonomic diversity at any given epoch do not correspond to proportional gains/losses at any individual epoch (with the exception of species diversity during the Eocene, Table S3). Collectively, while greater taxonomic diversity suggests greater relative range area, expansions in percent range area occupied may not necessarily be driven by changes in taxonomic diversity. Furthermore, families may be constrained by how much they can increase taxonomic diversity at any given period of time as there is a highly significant relationship between generic and species gains during each epoch and since the Eocene (Figure 1, Table S4). Although we expect a positive relationship between generic and species diversity, with species diversity exceeding generic diversity, the lack of significant deviations from this pattern (typically only occurring during the Pliocene and Pleistocene and not of significant magnitude) is surprising. Overall, adding one new
genus results in the addition of,2.3 species (ranging from 2.0 to
3.6 from the Eocene to Pleistocene, respectively). Regardless of whether families increase or decrease in taxonomic diversity, gains/losses occur proportionally. As it is likely harder to partition resources amongst congeners than confamilials, this relationship may reflect evolutionary and ecological constraints. Additionally, if species ranges are ‘‘heritable’’ (e.g., [29–31]) and overlap more among congeners than predicted, the ability of new taxa to increase familial range area may be limited. Conversely, if range area is not heritable we might expect increased taxonomic diversity to proportionally increase relative range area. Both our family level data from the Eocene to Pleistocene and generic
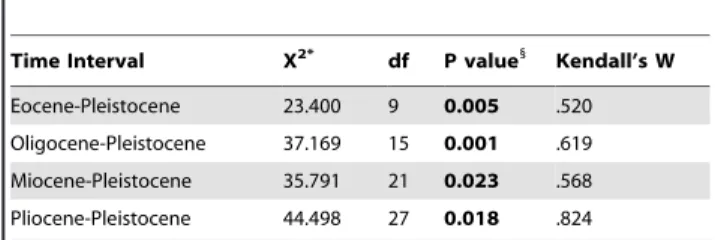
Table 3.Concordance of ranks across geologic epochs.
Time Interval X2* df P value1
Kendall’s W
Eocene-Pleistocene 23.400 9 0.005 .520
Oligocene-Pleistocene 37.169 15 0.001 .619
Miocene-Pleistocene 35.791 21 0.023 .568
Pliocene-Pleistocene 44.498 27 0.018 .824
*X2values calculated by Friedman’s test, a repeated measures comparison for k related groups.
1
Significance value (noted in bold) pertains to both the X2statistic and Kendall’s W, a coefficient of concordance that represents a normalization of Friedman’s test.
doi:10.1371/journal.pone.0035624.t003
Figure 3. Correlation between Pliocene and Pleistocene relative range size.(R2= 0.64,p,0.001).
doi:10.1371/journal.pone.0035624.g003
Mammalian Niche Conservation through Deep Time
examples from Hadly et al. [7] from the Pleistocene to Holocene
(e.g., Canis) lend support to the idea that range area may be
heritable (as changes in range area are not significantly influenced by changes in taxonomic diversity between consecutive time periods), although neither study is explicitly designed to test this idea.
The coarseness of time bins used in this study makes it difficult to link centroid shifts to specific climatic changes as is done in Lyons et al. [20–21]; however, finer time bins would have prohibited the examination of rare families. The polygon for each epoch essentially represents the total range of the family for the entire epoch, with variability due to quick climatic shifts smoothed over several million years. Because of this time-averaging, centroid shifts seem to be a good representation of trends in family distributions and how these trends respond to change over longer timescales. The general southeastern shift of centroids from the Eocene through the Pleistocene (Figure 4, 5) may therefore reflect the general global cooling trend since the Eocene followed by Pleistocene glaciations [27–28]. Another possibility is that families are tracking particular ecosystems. Centroids for tapirs, which are good indicators of forests [26], [32], shift northeast from the Eocene to Oligocene, then southeast between the Oligocene and Pliocene, and slightly northwest in the Pleistocene. Conversely, centroids for Equidae shift southeast from the Eocene to Oligocene and remain relatively fixed in the southern Central Plains, thereafter. Although the movement of centroids southeast of the western interior since the Eocene may also be explained by potential sampling biases inherent in the North American mammal record [22], sampling biases alone do not entirely explain southeastern movement after the Oligocene as many mammalian taxa already had ranges that spanned the majority of the contiguous USA (e.g., Figure 2, S1). Instead, the southeastern movement of centroids may be a combined function of sampling, the presence of South American immigrant taxa in the southern USA in the Pliocene and Pleistocene [22], and a response to generally cooling climates since the Oligocene [27].
have mid-to-low ranks, yet the three greatest net increases in percent range area occupied from the Eocene to Pleistocene are Cricetidae (77.2), Sciuridae (76.6) and Castoridae (73.5). This
may be due to lower initial range sizes (potentially due to sampling biases), such that their potential to expand in a limited area (continental US) was greater.
Figure 5. Centroid shifts between epochs, demonstrating a general southeastern trend through time. doi:10.1371/journal.pone.0035624.g005
Mammalian Niche Conservation through Deep Time
When considering changes in relative range size above the family level at the Pliocene-Pleistocene boundary (Table 1), ungulates significantly shifted more ranks than rodents; however, these shifts were not accompanied by differences in the direction of change. Of the ungulates, equal numbers of taxa increased as decreased in rank size; however, the greatest rank changes noted during this interval include Elephantidae and Camelidae which increased and decreased in 17 ranks, respectively. Rodents also increased and decreased rankings, albeit at a lesser magnitude. Thus, these differences may suggest that gross body size distinctions among different mammalian orders might affect the magnitude of responses to ecological change. If the niches of larger bodied mammals show more susceptibility to short-term ecological change, then body size may serve as an intrinsic control on niche conservatism. However, families containing megafauna did not differ in relative rank changes from families that contained all taxa less than 45 kg. Thus, while ungulates observe the greatest rank changes during the Pliocene to Pleistocene this may be due to a combination of large body size and degree of dietary specializa-tion. Furthermore, it is important to emphasize that order identity does not indicate direction of change. While rodents generally hold lower ranks, Cricetidae was ranked second in the Pleistocene. Thus, while body size correlates with an individual’s home range [36], it does not necessarily correlate with family range size.
The inference of niche conservatism above the genus level by Hadly et al. [7] rests on the ‘‘constancy of relative range sizes’’ seen in their statistical analyses of generic and family-level ranks from the late Pleistocene to late Holocene. Our rank analysis for the Pliocene to Pleistocene interval (Table 3) indicates strongly concordant rankings from the Pliocene to Pleistocene (Kendall’s
W = 0.824, p= 0.018), a result that closely matches their
concordance of rankings observed between the late Pleistocene
to late Holocene transition (Kendall’s W = 0.906,p,0.001; [7]).
Thus, the significant concordance of ranks and correlations between relative range size (ranks and percent area occupied) between the Pliocene and Pleistocene further supports niche
conservatism at the family level over the past ,5 million years
(Figure 3). Notably, rankings were not as strongly concordant across longer time intervals, although the influence of family identity on rank was still significant in all cases (Table 3). Perhaps niche conservatism does not operate as strongly across greater time
intervals (e.g., .5 million years) and the ecological niches of
closely related genera are subject to long term environmental change. These results are consistent with Peterson’s [10] recent review of ecological niche conservatism, noting that niche conservatism operates over deeper timescales than previously thought but does appear to break down over time. This would suggest that the controls on niche conservatism not only vary by taxonomic level, but also timescale.
There was no significant difference in relative range size rank changes from the Pliocene to the Pleistocene between terminal Pleistocene victims and survivors or between body size categories; therefore, evidence indicating that either victims or megafauna were predisposed to extinction is lacking. These data agree with previous work that similarly demonstrates the lack of significant differences in range shifts or changes in range size between terminal Pleistocene victims and survivors from the late Pleisto-cene to today [20]. Although we might expect PleistoPleisto-cene victims and survivors to respond differently if climate change contributed to Pleistocene extinctions [20], our data only demonstrate the lack of significant differences between these groups in range size rank changes from the Pliocene to the Pleistocene. Thus, much work remains to be done to test specific extinction hypotheses, both in North America and globally.
Concluding Remarks
By examining the ranges of mammalian families from the Eocene through the Pleistocene, this study allows a broader view of niche conservatism which is not confounded by the appearance and disappearance of individual species over short time periods. Changes in relative range size and centroid coordinates indicate a response to environmental change at the family level. Concor-dance in rank, especially between the Pliocene and Pleistocene, suggests niche conservatism at the family level over longer time periods than previously demonstrated. Thus, while the location and extent of geographic ranges may vary due to environmental, climatic, and/or sampling biases, the majority of mammalian families maintain their niches relative to one another over deep time and potentially respond to environmental and/or climatic events similarly. Exceptions include ungulates that change ranks significantly more than rodents, potentially indicating that body size and diet are underlying controls of niche conservatism; thus, larger ungulates may be relatively more susceptible to environ-mental change. Furthermore, families containing either Pleisto-cene extinction victims or megafauna do not appear more prone to relative range size reductions.
Range conservation at the family level over deep time reveals the potential adaptability of a family to maintain range size dominance in the face of environmental change, if containing taxa with a moderate diversity of life history characters. For example, morphologically conservative Tapiridae fluctuates in absolute and relative range size potentially in response to the availability of forest habitat. In contrast, Equidae is able to maintain the largest relative range size from the Eocene to the Pliocene while undergoing dramatic morphological evolution [35]. While our data further suggest that ranges of higher level taxonomic classifications are less susceptible to environmental controls than individual species ranges [7], not all families are equal. Furthermore, it is important to consider both taxonomic diversity and the diversity of life history characteristics when predicting geographic ranges at higher taxonomic levels. For example, families that contain more species or more species with a greater diversity of ecological niches may prove more resilient to climatic changes then families with more specialized and/or overlapping life history variables. Therefore, deep time ecological data has the potential to provide valuable insight to understanding mammalian responses to future climate change.
Methods
Compilation of Geographic Range Size of Mammalian Families
longitudinal points of the occurrence data. Rank analysis only considers families that were present in the Pleistocene and at least
one other consecutive epoch (n= 28). In contrast, the analysis of
range centroids includes all families in each epoch for which a polygon could be rendered (i.e., three or more localities per taxon, consistent with Ref. [7]).
Epoch-scale time bins allow the greatest number of families to be included in all subsequent analyses and correspond to unique periods of climate change (e.g., Oligocene cooling, Pleistocene glacial/interglacial cycling; Refs. [27–28]). Smaller scale designa-tions (e.g., land-mammal ages) would have allowed for greater temporal resolution, particularly during the Miocene which is represented by periods of warming and cooling [27]; however, only the most abundant families that are present in all consecutive land-mammal ages would have been included (excluding rare and/or moderately abundant taxa and significantly reducing the number of localities per family of taxa that are present). Therefore, without resorting to only looking at orders or the most abundant families (precluding subsequent analysis of geographic range size rank over deep time due to low samples sizes), epoch-scale analyses are required.
We used ArcMap 9.3 to plot occurrence points on the contiguous United States and create range size polygons for each mammalian family. We eliminated points located in Alaska and sites that plotted outside the present shoreline. Points that were contiguous to the shoreline were included for range area calculations. Following Hadly et al. [7], separate minimum convex polygons were generated for families with the Geospatial Modeling Environment tool [38] from the coordinates of all specimens having a minimum of three points during each epoch. Completed polygons were clipped to current ocean shorelines. Political boundaries were smoothed to include the area immediately south of the US-Mexico border and northern areas of southern Ontario and Quebec between Minnesota and Maine. Range area polygons were re-projected from a geographic coordinate system (GCS North American 1983) into an equal-area projected coordinate system (USA Contiguous Albers Equal Area Conic USGS) so that
areas could be calculated in ArcMap (km2; Table 1).
Analysis of Geographic Range Size and Taxonomic Diversity
In addition to calculating absolute range areas per family per epoch, we calculated a percent occupied range area to control for differences in sampling. Specifically, we divided total geographic ranges by the total range area available per epoch (calculated by generating a minimum convex polygon for all mammalian families sampled per epoch, see Figure S1, Table 1, S1); a resulting percent range area occupied value was calculated for each family per epoch and statistically compared across time (Wilcoxon signed-rank test as these data were not normally distributed, as per Shapiro-Wilk tests; Table S2). The minimum number of genera and minimum number of species per family were calculated per epoch (we use the term ‘‘minimum’’ as only genera and species with two or more occurrences per epoch, in the Paleobiology Database [22], were included; Table S1). Minimum number of genera and species were compared over time (Wilcoxon signed-rank tests; Table S2). Linear regressions were used to assess (i) the relationship between taxonomic diversity (i.e., minimum number of species or minimum number of genera) and percent range area occupied per epoch (we also analyzed relationships between taxonomic diversity and range area rank; however, as results were nearly identical we only report percent range area occupied data; Table 2), and (ii) changes in taxonomic diversity (i.e., change in minimum number of genera or change in minimum number of
species) and range area percent change, between consecutive epochs (Figure 1, Table S3).
Although our data include 15710 occurrences from 4056 unique localities (Eocene 1277, 874; Oligocene 1186, 370; Miocene 5814, 1407; Pliocene 1957, 457; Pleistocene 5476, 948; occurrences and unique localities, respectively), we cautiously examined the relationship between number of localities and percent area occupied (Figure S2, Table S1). Although there is a positive logarithmic relationship between the number of localities and percent area occupied (during each epoch and over time, Figure S2), number of localities is often unrelated to range area. For example, during the Pliocene Mammutidae has the fourth largest range area despite being represented by 19 localities. Lower range areas are also achieved regardless of the number of localities;
during the Eocene,14% range area is occupied by Cricetidae (13
localities) and Canidae (102 localities). However, to err on the side of caution, we statistically compared changes in percent range area occupied, minimum number of genera, and minimum number of species by including all families, all families with 10 or more localities, and all families with 25 or more localities (Table S2).
Analysis of Geographic Range Size Rank
Range areas were converted to a log10 scale, sorted in
descending order, and assigned a relative rank in order to standardize differences in taphonomic preservation and land availability between epochs. Rank analysis was conducted across four time intervals, with varying sample sizes (Table 1):
Eocene-Pleistocene, Oligocene-Pleistocene, Miocene-Pleistocene, and
Pliocene-Pleistocene. Eocene to Pleistocene rank analysis only includes families for which range area could be calculated in all five epochs (Table S5). Following Hadly et al. [7], we employ non-parametric statistics (Friedman’s test) to assess the constancy of ranks across each interval. Because sample size differences among the four time intervals preclude direct comparison of ranks, Kendall’s W, a normalization of the Friedman test, allows us to characterize the concordance of rankings within each time interval. This essentially serves as a proxy of range conservatism at multiple timescales. Linear regressions were also used to further assess correlations between Pliocene and Pleistocene relative range size and ranks. Furthermore, we compared average relative rank changes (the absolute value, ARC) and average gross relative rank changes (an average of the net differences, GRC) of higher taxonomic groups (e.g., orders or higher), and Pleistocene families containing one or more taxon defined as megafauna (greater than or equal to 45 kg; compiled from [22], [33], [39–42]). We also compared families containing taxa that went extinct during the terminal Pleistocene extinction in North America with those lacking any victims [37]. Additionally, we compared families that went entirely extinct in North America with taxa containing at least one surviving taxon. The majority of statistical comparisons employ non-parametric Mann-Whitney U tests, as most data are not normally distributed; however, all statistical tests are noted and parametric tests employed when appropriate.
Centroids
Following Lyons et al. [20–21], we also calculated centroids (in decimal degrees) for each polygon in ArcMap. The centroid points of family polygons represent the geometric center of each range extent. Complementing range size analysis, centroid movement provides a good average predictor of species range movement overall [20–21]. Here, we use centroids to demonstrate the direction and distance of family range shifts between epochs.
Mammalian Niche Conservation through Deep Time
Supporting Information
Figure S1 Range area polygons for all localities
includ-ed during each epoch.
(EPS)
Figure S2 Relationship between number of unique
localities per family and percent range area occupied during each epoch. Logarithmic trend lines for each epoch correspond to the following symbol colors: Eocene (red squares,
R2= 0.56), Oligocene (orange circles, R2= 0.67), Miocene (green
triangles, R2= 0.68), Pliocene (blue Xs, R2= 0.60), and Pleistocene
(brown+s, R2= 0.71). The black trend line corresponds to all data
(R2= 0.61).
(EPS)
Table S1 Range area and rank, minimum number of
genera and species, and total number of unique localities per family per epoch from the Eocene to the Pleistocene.
(XLS)
Table S2 Summary of Wilcoxon signed-rank tests of
changes in percent range area occupied, genera, and species between consecutive epochs.
(DOC)
Table S3 Summary of linear regressions of net changes
in minimum genera or minimum species and net
changes in percent range area occupied between con-secutive epochs.
(DOC)
Table S4 Summary of linear regressions of net changes
in minimum genera and net changes in minimum species between consecutive epochs.
(DOC)
Table S5 Family range size ranks from the Eocene to
Pleistocene.
(DOC)
Acknowledgments
We thank J. Alroy, S. Corapi, D. Ettenson, E. Hadly, R. Haupt, N. Jordan, J. Romer, and L. Yann for discussions pertaining to and/or suggestions for improving this manuscript. Further, earlier versions of this manuscript were improved and expanded in scope by suggestions from PLoS ONE academic editor D. Nogueso-Bravo and two anonymous reviewers. This work would not have been possible without the Paleobiology Database (Paleobiology Database contribution#153) and the major contributor of data used in this paper, J. Alroy.
Author Contributions
Conceived and designed the experiments: LRGD RABT CSK JCR MCV. Performed the experiments: LRGD RABT CSK JCR MCV. Analyzed the data: LRGD RABT CSK JCR MCV. Wrote the paper: LRGD RABT CSK JCR MCV.
References
1. Walther G-R, Post E, Convey P, Menzel A, Parmesan C, et al. (2002) Ecological responses to recent climate change. Nature 416: 389–395.
2. Parmesan C, Yohe G (2003) A globally coherent fingerprint of climate change impacts across natural systems. Nature 421: 37–42.
3. Root TL, Price JT, Hall KR, Schneider SH, Rosenzweig C, et al. (2003) Fingerprints of global warming on wild animals and plants. Nature 421: 57–60.
4. Post E, Forchhammer MC (2004) Spatial synchrony of local populations has increased in association with the recent Northern Hemisphere climate trend. Proc Natl Acad Sci USA 101: 9286–9290.
5. DeSantis LRG, Feranec RS, MacFadden BJ (2009) Effects of global warming on ancient mammalian communities and their environments. PLoS One 4: e5750.
6. Martinez-Meyer E, Peterson AT, Hargrove WW (2004) Ecological niches as stable distributional constraints on mammal species, with implications for Pleistocene extinctions and climate change projections for biodiversity. Global Ecol Biogeogr 13: 305–314.
7. Hadly EA, Spaeth PA, Li C (2009) Niche conservatism above the species level. Proc Natl Acad Sci USA 106: 19707–19714.
8. Wiens JJ, Graham CH (2005) Niche conservatism: Integrating evolution, ecology, and conservation biology. Annu Rev Ecol Evol Syst 36: 519–539. 9. Losos JB (2008) Phylogenetic niche conservatism, phylogenetic signal and the
relationship between phylogenetic relatedness and ecological similarity among species. Ecol Lett 11: 995–1007.
10. Peterson AT (2011) Ecological niche conservatism: a time-structured review of evidence. J Biogeogr 38: 817–827.
11. Peres CA (2001) Synergistic effects of subsistence hunting and habitat fragmentation on Amazonian forest vertebrates. Conserv Biol 15: 1490–1505. 12. Sax DF, Gaines SD, Brown JH (2002) Species invasions exceed extinctions on
islands worldwide: A comparative study of plants and birds. Am Nat 160: 766–783.
13. Fahrig L (2003) Effects of habitat fragmentation on biodiversity. Annu Rev Ecol Evol Syst 34: 487–515.
14. Clavero M, Garcı´a-Berthou E (2005) Invasive species are a leading cause of animal extinctions. Trends Ecol Evol 20: 110.
15. Walther G-R, Roques A, Hulme PE, Sykes MT, Pysˇek P, et al. (2009) Alien species in a warmer world: Risks and opportunities. Trends Ecol Evol 24: 686–693.
16. Martin PS, Klein RG (1984) Quaternary Extinctions: A Prehistoric Revolution (Univ. of Arizona Press, Tucson, AZ).
17. Barnosky AD, Koch PL, Feranec RS, Wing SL, Shabel AB (2004) Assessing the causes of the Late Pleistocene extinctions on the continents. Science 306: 70–75.
18. Alroy J (2001) A multispecies overkill simulation of the end-Pleistocene megafaunal mass extinction. Science 292: 1893–1896.
19. Lyons SK, Smith FA, Brown JH (2004) Of mice, mastodons and men: Human-mediated extinctions on four continents. Evol Ecol Res 6: 339–358. 20. Lyons SK, Wagner PJ, Dzikiewicz K (2010) Ecological correlates of range shifts
of Late Pleistocene mammals. Phil Trans R Soc B 365: 3681–3693. 21. Lyons SK (2003) A quantitative assessment of the range shifts of Pleistocene
mammals. J Mammal 84: 385–402.
22. Paleobiology Database (2010) Mammalia. Paleobiology Database Online Archives. J. Alroy major contributor. Available: http://paleodb.org. Accessed 2010 Apr 20.
23. MacFadden BJ, Cerling TE (1994) Fossil horses, carbon isotopes and global change. Trends Ecol Evol 9: 481–486.
24. Cerling TE, Harris JM, MacFadden BJ, Leakey MG, Quade J, et al. (1997) Global vegetation change through the Miocene/Pliocene boundary. Nature 389: 153–158.
25. Janis CM, Damuth J, Theodor JM (2000) Miocene ungulates and terrestrial primary productivity: Where have all the browsers gone? Proc Natl Acad Sci USA 97: 7899–7904.
26. DeSantis LRG, MacFadden B (2007) Identifying forested environments in Deep Time using fossil tapirs: evidence from evolutionary morphology and stable isotopes. Cour Forschungsinst Senckenberg 258: 147–157.
27. Zachos J, Pagani M, Sloan L, Thomas E, Billups K (2001) Trends, rhythms, and aberrations in global climate 65 Ma to present. Science 292: 686–693. 28. Haug GH, Ganopolski A, Sigman DM, Rosell-Mele A, Swann GEA, et al.
(2005) North Pacific seasonality and the glaciation of North America 2.7 million years ago. Nature 433: 821–825.
29. Webb TJ, Gaston KJ (2003) On the heritability of geographic range sizes. Am Nat 161: 553–566.
30. Hunt G, Roy K, Jablonski D (2005) Species-level heritability reaffirmed: A comment on ‘‘On the heritability of geographic range sizes.’’ Am Nat 166: 129–135.
31. Waldron A (2007) Null models of geographic range size evolution reaffirm its heritability. Am Nat 170: 221–231.
32. DeSantis LG (2011) Stable isotope ecology of extant tapirs from the Americas. Biotropica 43: 746–754.
33. Nowak RM (1999) Walker’s Mammals of the World: Sixth Edition. Baltimore: John Hopkins University Press. 1936 p.
34. Jenkins SH, Busher PE (1979) Castor canadensis. Mamm Species 120: 1–8. 35. MacFadden BJ (2005) Fossil horses – evidence for evolution. Science 307:
1728–1730.
36. McNab BK (1963) Bioenergetics and the determination of home range size. Am Nat 97: 133–140.
37. Faith JT, Surovell TA (2009) Synchronous extinction of North America’s Pleistocene mammals. Proc Natl Acad Sci USA 106: 20641–20645. 38. Beyer HL (2009) Geospatial Modelling Environment (software version 0.3.3
39. Janis CM, Scott KM, Jacobs LL, eds. (1998) Terrestrial Carnivores, Ungulates, and Ungulate like Mammals, Evolution of Tertiary Mammals of North America (Cambridge Univ. Press, Cambridge, UK).
40. Janis CM, Gunnell GF, Uhen MD (2008) Small Mammals, Xenarthrans, and Marine Mammals, Evolution of Tertiary Mammals of North America. Cambridge: Cambridge University Press. 691 p.
41. Vizcaı´no SF, Loughry WJ, eds. (2008) The biology of the Xenarthra (Univ. of Florida Press, Gainesville, FL).
42. Reynolds PS (2002) How big is a giant? The importance of method in estimating body size of extinct mammals. J Mammal 83: 321–332.
Mammalian Niche Conservation through Deep Time