Reactivation of ancestral strains of HIV-1 in the gp120 V3
env
region
in patients failing antiretroviral therapy and subjected to
structured treatment interruption
Wilson Pereira Silva
a, Domingos E.M. Santos
a, Elcio Leal
a, Adriana Brunstein
a,
Maria Cecilia A. Sucupira
a, Ester C. Sabino
b, Ricardo Sobhie Diaz
a,⁎
a
Escola Paulista de Medicina, Universidade Federal de São Paulo, Rua Pedro de Toledo, 781-16 andar-CEP 04039-032, São Paulo, SP, Brazil
b
Fundação Pró-Sangue. Av. Dr. Enéas de Carvalho Aguiar, 155-1 andar-CEP 05403-000, São Paulo, SP, Brazil
Received 16 January 2006; returned to author for revision 15 February 2006; accepted 19 April 2006 Available online 25 July 2006
Abstract
We analyzed gp120V3 HIV-1envregion genetic diversity of 27 patients failing antiretrovirals and subjected to 12-week structured treatment interruption (STI). Based on heteroduplex mobility assays, eight patients presented low pre- and post-STI genetic diversity (G1); five presented high pre-STI but low post-STI diversity (G2); five presented low pre-STI and high post-STI diversity (G3); and nine, high pre- and post-STI diversity (G4). One patient from G1, two from G2 and two from G3 were subjected to proviral DNA end-point PCR and sequencing. In three patients, the dramatic disturbance caused by STI resulted in ancestral viral progeny activation, which repopulated the cell reservoir. In two patients presenting highly homogeneous sequences and low immune selective pressure (dN/dS ratio <1), this phenomenon was not observed. The mechanisms involved in viral evolution, in which antiretroviral therapy also applies selective pressure, sometimes affects coreceptor usage of circulating viruses, leading to the suppression of ×4 strains.
© 2006 Published by Elsevier Inc.
Keywords:Structured treatment interruption; HIV-1; Envelope gene; Antiretroviral resistance
Introduction
Notorious for its genetic diversity, the HIV-1 genome generates all possible mutations on a continuous basis. This occurs as a result of the high rates of misincorporation by the reverse transcriptase (≈4 × 10⁻⁴ per replication cycle), the higher levels of viral replication and the size of genome (≈1010 base pairs) (Mansky and Temin, 1995; Perelson et al., 1996). However, the viral population that seeds a new infection is usually highly homogeneous in both genotype and phenotype, and infection is followed by an increase in viral genetic diversity over time (Diaz et al., 1996; McNearney et al., 1992; Zhang et
al., 1993; Zhu et al., 1993). The envelope gene encodes a
glycoprotein that is subjected to great selective pressure exerted by the immune system during chronic infection (Diaz et al.,
1997; Zhang et al., 1997). The rate of evolution of this gene is
approximately 1% per year (Diaz et al., 1997; Shankarappa et al., 1999), thereby generating the so-called viral quasispecies.
The viral phenotypes, which change during the course of HIV-1 infection, are classified as syncytium-inducing (SI) or non-syncytium-inducing (NSI) (Cheng-Mayer et al., 1990). There is a correlation between the phenotype, cytopathoge-nicity and cell tropism. The NSI phenotypes typically bind to the CCR5 chemokine receptors and present tropism for macrophages and monocytes, whereas SI phenotypes bind to CXCR4 and present tropism for lymphocytes (Roos et al.,
1992; Zhu et al., 1993). The NSI phenotypes are present
during primary infection and are less cytopathic, whereas SI phenotypes present greater potential for in vitro cell destruction and emerge over the course of infection (Koot
et al., 1996; Shankarappa et al., 1999). Some authors have
⁎Corresponding author. Laboratório de Retrovirologia, R. Pedro de Toledo, 781, São Paulo, SP-04039-032, Brazil. Fax: +55 11 4192 3176.
E-mail address:rsdiaz@usp.br(R.S. Diaz).
shown a correlation between the emergence of SI viral phenotypes and disease progression (Koot et al., 1996;
Shankarappa et al., 1999). The phenotype change requires
mutation in the env gene. A change in the V3 loop amino acid charge from neutral or negative (D or E) to positive (R or K) at positions 306 or 320 leads the HIV-1 phenotype to change from NSI to SI (Fouchier et al., 1992).
The use of antiretroviral therapy leads to selective pressure similar to that exerted by the immune system. Because antiretroviral-resistant mutant viral strains are preexisting, subinhibitory levels of drugs increase the risk that such strains will be selected. In these cases, an accumulation of resistance mutations is followed by a decrease in the pharmacological activity of antiretroviral agents (Coffin, 1995; Larder and
Kemp, 1989).
Resistance mutations also lead to a decrease in the replicative fitness of the virus (Goudsmit et al., 1997; Maeda et al., 1998;
Martinez-Picado et al., 2000). In the absence of antiretroviral
agents, the fitness of the wild-type virus is usually superior to that of the antiretroviral-resistant mutant virus. This phenom-enon allows the reemergence of the wild-type virus in patients with resistant strain subjected to antiretroviral interruption. In studies of structured antiretroviral interruption (STI) in patients with virological failure, increased viral load and decreased CD4 counts have been observed simultaneous to the reversion of the antiretroviral resistance mutations (Deeks et al., 2001; Miller et
al., 2000). In the present study, we analyzed the genetic
diversity of the HIV-1 gp120 V3 env region in chronically infected patients subjected to a 12-week STI.
Results
Genetic characterization of HIV-1 populations
Proviral HIV-1 samples obtained from a group of 27 individuals subjected to an STI were screened by HMA. An intra-sample HMA was performed to evaluate the diversity within the quasispecies of each individual (Fig. 1). The PCR input, as estimated by end-point PCR and by real-time PCR DNA proviral load, was at least 50 copies (data not shown). We used the following definition criteria: sample showing only one band (homoduplex) was interpreted as having low diversity, reflecting a relative homogeneity of the proviral population; and sample showing a confluence of bands inferring more complex proviral quasispecies. According to these criteria, pre- and post-STI samples were analyzed, and the 27 individuals were divided into four groups: group 1 (patients 01, 07, 09, 13, 15, 20, 22 and 23), presenting little pre- or post-STI genetic diversity; group 2 (patients 03, 08, 19, 24 and 26), presenting high pre-STI but low post-STI genetic diversity; group 3 (patients 02, 04, 05, 10 and 25), presenting low pre-STI but high post-STI genetic diversity; and group 4 (patients 06, 12, 14, 16, 17, 18, 21, 27 and 28), presenting high pre- and post-STI genetic diversity. One patient from group 1 (patient 01), two from group 2 (patients 03 and 19) and two from group 3 (patients 04 and 05) were selected and subjected to a quasispecies analysis by proviral DNA genomic sequencing of the C2-V3-C3 gp120 region of theenvgene.
Virologic and immunologic markers during STI
The 27 patients were experienced in all three classes of antiretrovirals, with a median of 8.9 prior ARV, ranging from 6 to 13. The median baseline HIV-1 RNA was 3.97 log10copies/
mL, and the median baseline CD4+ cell count of 224 cells/mm3. Our results demonstrated an average reduction in CD4+ T cell count of 95 cells and an average increase of 0.64 log10in viral
load, after 12 weeks of STI. Our results demonstrated an average reduction in T CD4+ of 95 cells and an average increase of 0.64 log10in viral load, after 12 weeks of STI. The CD4+ T
cell counts and plasma HIV-1 viral loads during STI were studied in detail for five patients (patients 01, 03, 04, 05 and 19), and the results are depicted inFig. 2. There was an increase in viral load and a decrease in CD4+ T cell count after the 12-week STI in patients 01, 05 and 19. No significant viral load increase was seen in patients 03 and 04 (less than 0.5 log10increase),
although a significant decrease in CD4 count was documented.
Antiretroviral resistance-related mutations during STI
The evolution of the resistance mutation profile is depicted in
Fig. 2. We generated pol sequences from plasma RNA and
proviral DNA for all patients and there was a concordance in the resistance profile in both plasma and PBMCs either before or after STI. We did not observe mixed HIV populations in the resistance-related codons in any patient either before or after STI in plasma or PBMCs. Overall, resistance codons were replaced by wild-type codons, with the exception of the primary mutations in patient 19.
Genetic diversity of the C2-V3-C3 region
For each one of the five patients (patients 01, 03, 04, 05 and 19), we evaluated genetic diversity in the proviral quasispecies present in the pre- and post-STI samples. In samples from patients 01, 03 and 05, there were strong correlations between the HMA-inferred genetic diversity values and those measured by sequencing. The genetic diversity of clones found in pre-STI patient 01 samples (01A samples) was 0.00623 versus 0.00459 for those found in post-STI samples (01M samples). The dN/dS ratio for all patient 01 clones, according to the selected Goldman–Yang model (M0), was 0.1973, and there were no sites under positive selective pressure. For patient 03, genetic diversity of clones in the pre-STI samples (03A samples) was 0.05896, compared with 0.02942 for post-STI sample (03M sample) clones and 0.05182 for all clones combined. For this patient (patient 03), the M2 model was the best fit, and residues 291, 300, 302, 304, 320, 325 and 329 presented dN/dS ratios >1 (Fig. 3). There was no positive selection found in residues of patient 04 samples, in which the genetic diversity was 0.0107 in pre-STI samples (04A samples), 0.00791 in post-STI samples (04J samples) and 0.00959 on average. According to the Goldman–Yang model (M0), the mean dN/dS ratio in patient 04 samples was 0.4987. In patient 05 samples, the genetic diversity of clones was higher in post-STI samples (05L samples). Clones found in pre-STI patient 05 samples (05A samples) presented a genetic diversity of 0.0179 versus 0.0812 for those in post-STI samples (05L samples) and 0.0422 for all clones combined. For this patient (patient 05), M2 was selected, and we found dN/dS ratios >1 in residues 304, 306, 319, 321, 324, 345, 352, 353, 354, 356 and 359 (Fig. 3). The highest number of residues under positive selective pressure was found in patient 19 samples. For the quasispecies in PBMCs, we found a genetic diversity of 0.0363 for the pre-STI clones (in 19A samples), and 0.0312 for clones post-STI (19H samples). For quasispecies in plasma, we found the genetic diversity to be 0.0277 for clones in pre-STI samples (19Ar samples), 0.0194 for clones in samples collected after 1 week of STI (19Br samples) and 0.0482 for clones in post-STI samples (19Hr samples). According to the model M3, this patient (patient 19) presented high numbers of residues under positive selective pressure. In patient 19 PBMC samples, residues 278, 291, 293, 297, 334, 335, 338, 349, 351, 352 and 359 presented dN/dS ratios >1, and the majority of those residues (residues 278, 293, 334, 335, 338, 349, 352, 353 and
359) also presented dN/dS ratios >1 in patient 19 plasma samples.
Phylogenetic and coalescent analysis
In an attempt to better clarify the clustering pattern and the ancestral recrudescence, we performed phylogenetic and coalescent analyses. The sequences collected pre-STI were identified by grey circles, the sequences from post-STI were identified by black circles. The maximum likelihood trees constructed with the gp120 V3envregion of patients 03, 05 and 19 showed a similar topology clustering the sequences in two distinct groups (Figs. 4–6). The clustering pattern was strongly related to the STI status of sequences, in this way sequences from pre-STI clustered in a group whereas sequences from post-STI cluster in another distinct group. Because this bipolarity of the pre- and post-STI sequences was consistently observed in patients 03, 05 and 19, we then rooted the trees at the midpoint root that most likely will represent the ancestor of all sequences for each patient. This temporal pattern of the trees allowed us to estimate the distance of each cluster to the root. The post-STI clusters (cluster M in patient 03, cluster I in patient 05 and clusters GW1 and GW2 in patient 19) were located closer to the midpoint root whereas the pre-STI clusters (cluster A in patients 03 and 05 and cluster GG in patient 19) were generally located farther from the root. Additionally, the branch length leading to the root of post-STI clusters was shorter than the length of pre-STI clusters. In details, for patient 03 the branch length of the cluster M (pos-STI) was 0.00862 (±0.002) whereas the branch length of the cluster A (pre-STI) was 0.03341 (±0.005) (Fig. 4). For patient 05, the branch length of cluster I (post-STI) was 0.03155 (±0.0034) and for cluster A (pre-STI) it was 0.05178 (±0.004). Finally, for patient 19 the branch length of the clusters GW 1 and GW 2 (post-STI) was 0.01323 (±0.007) and 0.03881 (±0.006), respectively, whereas the branch length of the cluster GG (pre-STI) was 0.10195 (±0.002). The above results showed steadily that the post-STI sequences diversified less than pre-STI sequences from the midpoint root.
To give more strength to our hypothesis of recrudesce of ancient variants, we used the coalescent approach to estimate
“age” of the clusters. This analysis revealed that the clusters formed by post-STI sequences had reduced coalescent time intervals compared to those estimated for the clusters formed by pre-STI sequences. For patient 03, for example, the coalescent time interval for the cluster M was 0.025 substitutions whereas for the cluster A it was four times longer; 0.10 substitutions
(Fig. 4, panels A and B, respectively). Likewise, for patient 05/
sequences coalesced less from the ancestor, thus showing that the post-STI sequences are older than the pre-STI sequences. Data for patients 1 and 4 are not presented due to the relative homogeneity of their sequences pre- and post-STI.
Discussion
In this study, we analyzed the genetic diversity of chronically HIV-1-infected patients failing antiretroviral therapy and sub-jected to STI. The preliminary analysis using HMA revealed no defined pattern ofenvevolution after antiretroviral interruption. It is interesting to note that, despite the selective pressure imposed by antiretroviral therapy, genetic diversity can vary widely in this gene. In addition, after interruption of the selective pressure exerted by the antiretroviral agents, there is a change in the genetic complexity of the gp120 V3 region of viruses over a short period of time in 17 out of 27 individuals, favoring either the increase or decrease of the genetic diversity of the virus. There have been few studies analyzing the impact of STI on genes other thanpol(Kijak et al., 2002). Studies of the use of STI in patients failing antiretroviral therapy have shown that this strategy leads to an increase in viral load and a decrease in CD4
counts, as well as rapid replacement of viruses presenting resistance mutations in thepolgene by wild-type viruses (Deeks
et al., 2001; Miller et al., 2000). These emerging wild-type
viruses probably represent viral populations archived in reservoirs or sanctuaries and emerge due to their higher fitness in the absence of antiretroviral agents. Another related issue that needs to be taken into consideration is genomic recombination. One hypothesis is that despite thepolprofile, the more highly adaptedenvshould prevail. If this is true, recombination would result in the currentenvprofile being maintained, even with the post-STI emergence of wild-typepolprofile.
In order to make a more detailed evaluation, we used end-point PCR to analyze the genetic profile of pre- and post-STI viral strains by sequencing clones amplified from samples obtained from five patients. As an initial screening method, HMA was used. Although not highly specific, HMA allows the rapid and inexpensive analysis of a large number of samples and has primarily been used for these applications (Delwart et al.,
1993; Diaz et al., 1995; Long et al., 2000). Indeed, we found an
interesting lack of concordance between the two methods in some of the five cases in which sequencing was performed. As mentioned earlier, in samples from patients 01, 03 and 05, there
were strong correlations between the genetic diversity values inferred by HMA and those measured by sequencing. In the HMA, samples from patient 01 presented low genetic complex-ity before and after STI, which was in agreement with the sequencing results showing genetic diversity to be 0.32% in the pre-STI sample and 0.62% in the post-STI sample. The same occurred in patient 03 samples, which presented high pre-STI genetic diversity and low post-STI genetic diversity in the HMA,
which were 5.9% and 2.9%, respectively, in the sequencing. In the HMA, patient 05 samples presented low pre-STI genetic diversity and high post-STI genetic diversity, which were 1.8% and 8.1%, respectively, in the sequencing. However, samples from patients 04 and 19 presented genetic diversity values obtained through the use of the two methodologies that initially seem to be unrelated. The HMA of patient 04 samples classified the clones as presenting low pre-STI and high post-STI genetic
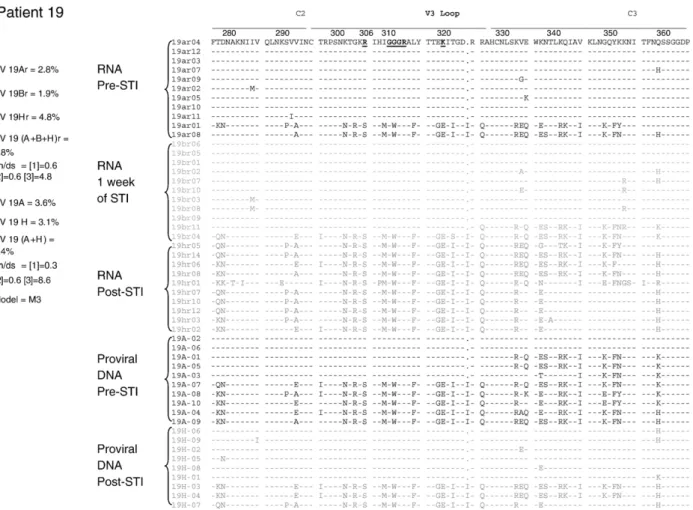
complexity. However, in the analysis of the sequencing results for the same samples, genetic diversity was low in pre- and post-STI samples (1.1% and 0.8%, respectively). Careful examina-tion of the HMA of the post-STI sample revealed that there was only one heteroduplex band presenting slow migration rather than the smear of heteroduplexes closer to the homoduplexes seen in the other high genetic complexity samples. Interestingly, as seen inFig. 3, the quasispecies infecting this patient presented sequences with a deletion. The HMA showed that this deletion, although not influencing the amount of genetic diversity calculated from the sequences, resulted in anomalous annealing, which in turn led to slower migration of the heteroduplexes. In the HMA of patient 19 samples, we found high initial genetic diversity and low final genetic diversity, whereas the sequencing revealed 3.6% and 3.1%, respectively. Although there was a discrete decrease in post-STI genetic diversity, we considered genetic diversity to be high at both time points. This patient was especially interesting because, in addition to the conflict between HMA and sequencing results, there was also a significant increase in viral load and a decrease in the CD4
count, despite the fact that the wild-type virus did not emerge after STI. Thepolgene mutations led to a high level of genotypic antiretroviral resistance. After STI, the patient did not revert to wild type, either at the provirus (PBMC) or virion (plasma) level. All other patients reverted to wild-type mutations after STI, and thepolprovirus profile of patient 19 was similar to that found in the plasma of all patients (data not shown). These results motivated us to evaluate this patient in greater detail. To that end, we analyzed the V3 quasispecies viruses present in plasma and included one sample obtained after 1 week of STI.
The sequence analysis produced very interesting results. Patient 01 did not present any change in theenvsequence profile after STI, despite the changes presented in the polgene. The proviral population remained homogeneous with extremely low selective positive pressure, denoting the low immune pressure exerted by this antigenic stimulus (Fig. 3). The results from patient 04 are similar to those obtained for patient 01. In contrast, patient 03 samples presented a significant post-STI decrease in genetic diversity. It is of note that the majority of pre-STI strains presented characteristics consistent with ×4 strains (SI
phenotype), as predicted by the presence of amino acids with positive charges at position 306 or 320 of the V3 loop (R or K). After STI, these strains were replaced by strains presenting amino acids with neutral charges at position 306 (S) or negative charges at position 320 (E), which is typical of R5 NSI strains
(Fouchier et al., 1992). It is recognized that ×4 strains do not
usually appear in the early stages of HIV-1 infection, typically arising and replacing the R5 strains in the advanced stages of the disease. We therefore believe that this patient was in the advanced stages of the disease when antiretroviral therapy was started, and that, after STI, there was a reemergence of strains that had been present in the early stages of the disease, together with the reemergence of wild-type pol gene. In addition, selective pressure, as inferred by the dN/dS ratios, was high in the strains found in patient 03 samples.
More interesting still is the phenomenon seen in patient 05. As seen in patient 03 samples, the pre-STI patient 05 samples presented exclusively ×4 strains (R at position 306), and the post-STI patient 05 samples presented a mixed population of ×4 and R5 strains in similar proportions, some strains maintaining a positive charge at position 306 and others maintaining a neutral charge at this position. This mixed viral population was also responsible for the increase in genetic diversity in the post-STI sample. In this patient, selective pressure was also high, as evidenced by the high rates of
non-synonymous substitutions, which sustained the high dN/dS ratio. It is likely that recombination is the mechanism by which the more recent (×4) strains coexist with the more ancient, reemerged (R5) strains. This scenario was repeated in the case of patient 19. The phenomenon was more pronounced from the sequencing of virus samples obtained as actively replicating virions that were shed in the blood stream. The pre-STI strains were ×4 strains, presenting K at positions 306 and 320, and these strains were replaced by R5 strains presenting neutral (S) amino acids at position 306, or negative (E) amino acids at position 320 after STI. In addition, pre-STI strains presented a GGGR motif at the tip of the V3 loop, which was replaced by a GWGR motif after STI. It is known that GWGR is the typical motif found in a proportion of Brazilian clade B strains (Hendry et al., 1996; Morgado et al., 1994), and that, due to the instability of the tryptophan in this position, this motif tends to disappear over the course of HIV infection. Tryptophan is typically replaced by amino acids, such as glycine, that are genetically closer to tryptophan. The reemergence of strains with the GWGR motif provides further evidence that the more recent strains were replaced by older strains. As previously mentioned, although patient 19 was the only patient that did not revert the antiretroviral resistance-related viral mutations to wild type, either in the plasma or in the PBMC, there was a significant increase in viral load after
STI. This suggests that although there was broad antiretroviral resistance due to the presence of resistance mutations, these medications might have a residual antiretroviral effect on viral suppression.
It is also of note that, after STI, CD4 counts did not always change in ways that were proportional to post-STI changes in viral loads. In patients 03 and 04, there was no significant increase in viral loads after 12 weeks of STI, although CD4 counts decreased by more than 50%. The unique feature in these two cases was the reemergence of the wild-type strains. In both of these cases, there was an increase in viral activation after STI (data not shown). One could therefore speculate that the massive cell destruction was related to the cell activation caused by the emergence of wild-type viruses and not to the direct cytopathic effect of the high viral loads (Smith et al., 2002).
One possible limitation of our study is the fact that we analyzed the provirus quasispecies rather than the viral quasispecies. Indeed, RNA analysis could have increased the sensitivity to the more dynamic changes in the viral quasis-pecies, such as those seen in patient 19 samples. However, our focus was the impact of these changes on the cellular reservoir of these patients. Studies of HIV-1 dynamics have indicated that because the half-life of more than 99% HIV-infected cells is approximately 2.4 days, the time required to seed the cell reservoir is extremely short (Ho, 1995; Wei et al., 1995).
Our study therefore provides unique and interesting insights into aspects of the dynamics of HIV-1 viral replication in humans. We demonstrated that the dramatic disturbance caused by the interruption of antiretroviral therapy results in the activation of old progenies that are able to repopulate the patient's cell reservoir. However, there were two patients in whom this phenomenon was not observed. These two patients presented highly homogeneous sequences and low immune selective pressure, as inferred by the dN/dS ratios <1. We have developed three separate hypotheses regarding these two cases. First, these patients might have been treated early, before significant genetic diversity was acquired, thereby presenting only one viral profile in the quasispecies. Second, as has previously been suggested (Wolinsky et al., 1996), low selective pressure due to a weak immune system might have precluded the generation of significant genetic diversity, again resulting in a single viral profile. Third, as proposed byCosta
et al. (2004), because the change in thepolprofile in these two
cases suggested that the best adaptedenvprofile to the patient at this time would be the current one, recombination might have maintained the geneticenvprofile after STI. Indeed, there is some evidence that recombination may have occurred in patient 05. In patient 05 samples, we detected two distinct viral populations after STI: one being a more ancient, emerging population; and the other presenting similar proportions of
ancient and recent strains. Our findings provide insights into some of the mechanisms involved in viral evolution, in which selective pressure is applied not only by the immune system but also by antiretroviral therapy. Therefore, one outcome of STI for patients could be the impact on the coreceptor usage of circulating viruses, leading to the suppression of ×4 strains.
Methods
Sample collection
Samples to be analyzed were collected from 27 chronically infected patients who had experienced antiretroviral therapy failure and were subjected to an STI at the Universidade Federal de São Paulo, Brazil, between June 1999 and June 2000. All
samples were obtained from peripheral blood mononuclear cells (PBMCs), except for select samples obtained from an individual patient, which were derived from plasma.
Nucleic acid purification
The HIV-1 proviral DNA was extracted from buffy coats using the QIAamp DNA Blood Mini Kit (Qiagen Inc., Santa Clarita, CA), and viral RNA was purified from plasma using the QIAamp viral RNA kit (Qiagen) according to the manufacturer instructions.
cDNA synthesis
Following RNA viral denaturation at 70 °C for 10 min, cDNA synthesis was performed at 42 °C for 90 min using a
reverse transcriptase enzyme (20 U Super Script TM II; Gibco BRL-Life Technologies, Rockville, MD).
Nested PCR amplification
A C2-V3-C3 region 300-bp fragment (designated V3 for the sake of simplicity) was amplified using nested PCR as previously described (Wolfs et al., 1991). For the pol gene amplification, we used a nested PCR as previously described
(Sucupira et al., 2001).
Heteroduplex mobility analysis
After PCR amplification, samples were screened using heteroduplex mobility analysis (HMA) (Delwart et al., 1993). The V3 PCR products were denatured at 94 °C for 2 min, chilled on ice and subjected to electrophoresis on a polyacrylamide gel as previously described (Diaz et al., 1999).
End-point PCR
The strategy for generating PCR clones was based on serial dilutions of DNA samples. An aliquot of the last dilution in which there was positive amplification was added to a PCR mixture (total volume of 1 mL), which was then divided among 20 reaction tubes (50μL per tube). If the number of positive amplifications was that expected from the Poisson distribution (the probability of each amplification event starting from a single template and inversely proportional to the number of events), the positive amplification products were considered clones (Diaz et al., 1995; Simmonds et al., 1990).
DNA sequencing
The PCR products were purified using the QIAquick PCR Purification Kit” (Qiagen Inc., Chatsworth, CA) according to manufacturer instructions.
Sequencing was performed using the Thermo Sequenase Fluorescent-labeled primer cycle sequencing kit (RPN 2436; Amersham Pharmacia Biotech UK Limited, Buckinghamshire, England), and primers were labeled with CY5.5. Electropho-resis was performed using the Long Reader Tower (Bayer Corp., Berkeley, CA).
Predicting the HIV-1 phenotype
Theenvsequences corresponding to the V3 loop region were used to predict the coreceptor use and the viral phenotype based on the presence of residues at positions 306 and 320 in the V3 loop (Chesebro et al., 1991; De Jong et al., 1992; Milich et al.,
1993).
Genetic diversity
Patient sequences were aligned by eye using the SeaView
(Galtier et al., 1996). The Modeltest program (Posada and
Crandall, 1998) was used to select maximum likelihood models
of nucleotide substitutions for each alignment, and corrected distance matrices were then built using the PAUP* program [Swofford, DL (2002) PAUP*; Phylogenetic analysis using parsimony (*and other methods), Version 4; Sinauer Associates, Sunderland, MA]. Genetic diversity was calculated as
d Rijpij=nc;
wherepis the corrected distance between sequencesiandj, and nc is the total number of sequence comparisons among n
sequences (Nei, 1987):
nc nn 1=2:
Selection pressures
Evidences that support selective pressure on the V3 region comes from the analysis of the dN/dS ratio of sequence pairs, where dN is the observed frequency of non-synonymous substitution per replacement site, and the dS is the observed frequency of synonymous substitution per silent site. The higher the dN/dS ratio (>1), the stronger the selective pressure for amino acid change. Phylogenetic trees for each patient were inferred by maximum likelihood using the PAUP* program, and for each alignment and correspondent tree, three models of codon substitution were compared using a likelihood ratio test (LRT) using CODEML as implemented in the PAML package
[Yang, 1997; Phylogenetic Analysis by Maximum Likelihood
(PAML), Version 1.4. department of Integrative Biology, University of California, Berkeley]. The first model, M0, assumes that all codons fall into a single category of sites with fixed non-synonymous to synonymous substitutions (dN/dS) ratios (Goldman and Yang, 1994). The second model, M1, assumes a class of conserved sites with dN/dS ratios equals 0 and a class of neutral sites with dN/dS = 1. The third model, M2, comprises the categories used in the second model and adds an additional category of positively selected sites with dN/dS >1
(Nielsen and Yang, 1998). An LRT was performed to compare
the M0 and M1 models. When M1 was chosen, another LRT was applied to compare it with M2. When M2 was chosen, positively selected sites were identified by their posterior probabilities, as calculated by CODEML, of belonging to the class of sites presenting dN/dS ratios >1.
Alignment and phylogenetic inference
The sequences were manually aligned using the SE-AL program (Version 2.0; Department of Zoology, Oxford Univer-sity [http://evolve.zoo.ox.ac.uk/software/]). Phylogenetic infer-ences were made using gp120 V3 env region of HIV-1. Maximum likelihood trees were done by first determining the most appropriate model of nucleotide substitution for each data set, according to a hierarchical likelihood ratio test (hLRT), as implemented in the program Modeltest v3.06
(Posada and Crandall, 1998). The most appropriate evolutive
nearest-neighbor interchange method (NNI). All phylogenetic inferences were done using the program PAUP*. To the coalescent analysis, we used the reversible jump Markov chain Monte Carlo method (Opgen-Rhein et al., 2005) as is implemented in the “ape” library of the R-package (http://
www.r-project.org).
Acknowledgments
This study received financial support from the Fundação de Amparo à Pesquisa do Estado de São Paulo (FAPESP, Foundation for the Support of Research in the State of São Paulo; grant number: 98/14381-4).
References
Cheng-Mayer, C., Quiroga, M., Tung, J.W., Dina, D., Levy, J.A., 1990. Viral determinants of human immunodeficiency virus type 1 T-cell or macrophage tropism, cytopathogenicity, and CD4 antigen modulation. J. Virol. 64 (9), 4390–4398.
Chesebro, B., Nishio, J., Perryman, S., Cann, A., O'Brien, W., Chen, I.S., Wehrly, K., 1991. Identification of human immunodeficiency virus envelope gene sequences influencing viral entry into CD4-positive HeLa cells, T-leukemia cells, and macrophages. J. Virol. 65 (11), 5782–5789.
Coffin, J.M., 1995. HIV population dynamics in vivo: implications for genetic variation, pathogenesis, and therapy. Science 267 (5197), 483–489. Costa, L.J., Mayer, A.J., Busch, M.P., Diaz, R.S., 2004. Evidence for
selection of more adapted human immunodeficiency virus type 1 recombinant strains in a dually infected transfusion recipient. Virus Genes 28 (3), 259–572.
De Jong, J.J., De Ronde, A., Keulen, W., Tersmette, M., Goudsmit, J., 1992. Minimal requirements for the human immunodeficiency virus type 1 V3 domain to support the syncytium-inducing phenotype: analysis by single amino acid substitution. J. Virol. 66 (11), 6777–6780.
Deeks, S.G., Wrin, T., Liegler, T., Hoh, R., Hayden, M., Barbour, J.D., Hellmann, N.S., Petropoulos, C.J., McCune, J.M., Hellerstein, M.K., Grant, R.M., 2001. Virologic and immunologic consequences of discontinuing combination antiretroviral-drug therapy in HIV-infected patients with detectable viremia. N. Engl. J. Med. 344 (7), 472–480.
Delwart, E.L., Shpaer, E.G., Louwagie, J., McCutchan, F.E., Grez, M., Rubsamen-Waigmann, H., Mullins, J.I., 1993. Genetic relationships determined by a DNA heteroduplex mobility assay: analysis of HIV-1env
genes. Science 262 (5137), 1257–1261.
Diaz, R.S., Sabino, E.C., Mayer, A., Mosley, J.W., Busch, M.P., 1995. Dual human immunodeficiency virus type 1 infection and recombination in a dually exposed transfusion recipient. The Transfusion Safety Study Group. J. Virol. 69 (6), 3273–3281.
Diaz, R.S., Sabino, E.C., Mayer, A., deOliveira, C.F., Mosley, J.W., Busch, M.P., 1996. Lack of dual HIV infection in a transfusion recipient exposed to two seropositive blood components. AIDS Res. Hum. Retrovir. 12 (13), 1291–1295.
Diaz, R.S., Zhang, L., Busch, M.P., Mosley, J.W., Mayer, A., 1997. Divergence of HIV-1 quasispecies in an epidemiologic cluster. AIDS 11 (4), 415–422.
Diaz, R.S., De Oliveira, C.F., Pardini, R., Operskalski, E., Mayer, A.J., Busch, M.P., 1999. HIV type 1 tat gene heteroduplex mobility assay as a tool to establish epidemiologic relationships among HIV type 1-infected indivi-duals. AIDS Res. Hum. Retrovir. 15 (13), 1151–1156.
Fouchier, R.A., Groenink, M., Kootstra, N.A., Tersmette, M., Huisman, H.G., Miedema, F., Schuitemaker, H., 1992. Phenotype-associated sequence variation in the third variable domain of the human immunodeficiency virus type 1 gp120 molecule. J. Virol. 66 (5), 3183–3187.
Galtier, N., Gouy, M., Gautier, C., 1996. SEAVIEW and PHYLO_WIN: two graphic tools for sequence alignment and molecular phylogeny. Comput. Appl. Biosci. 12 (6), 543–548.
Goldman, N., Yang, Z., 1994. A codon-based model of nucleotide substitution for protein-coding DNA sequences. Mol. Biol. Evol. 11 (5), 725–736. Goudsmit, J., de Ronde, A., de Rooij, E., de Boer, R., 1997. Broad spectrum of
in vivo fitness of human immunodeficiency virus type 1 subpopulations differing at reverse transcriptase codons 41 and 215. J. Virol. 71 (6), 4479–4484.
Hendry, R.M., Hanson, C.V., Bongertz, V., Morgado, M., Duarte, A., Casseb, J., Brigido, L., Sabino, E., Diaz, R., Galvao-Castro, B., 1996. Immunoreac-tivity of Brazilian HIV isolates with different V3 motifs. Mem. Inst. Oswaldo Cruz 91 (3), 347–348.
Ho, D.D., 1995. HIV-1 dynamics in vivo. J. Biol. Regul. Homeostatic Agents 9 (3), 76–77.
Kijak, G.H., Simon, V., Balfe, P., Vanderhoeven, J., Pampuro, S.E., Zala, C., Ochoa, C., Cahn, P., Markowitz, M., Salomon, H., 2002. Origin of human immunodeficiency virus type 1 quasispecies emerging after antiretroviral treatment interruption in patients with therapeutic failure. J. Virol. 76 (14), 7000–7009.
Koot, M., van 't Wout, A.B., Kootstra, N.A., de Goede, R.E., Tersmette, M., Schuitemaker, H., 1996. Relation between changes in cellular load, evolution of viral phenotype, and the clonal composition of virus populations in the course of human immunodeficiency virus type 1 infection. J. Infect. Dis. 173 (2), 349–354.
Larder, B.A., Kemp, S.D., 1989. Multiple mutations in HIV-1 reverse transcriptase confer high-level resistance to zidovudine (AZT). Science 246 (4934), 1155–1158.
Long, E.M., Martin, H.L., Kreiss Jr., J.K., Rainwater, S.M., Lavreys, L., Jackson, D.J., Rakwar, J., Mandaliya, K., Overbaugh, J., 2000. Gender differences in HIV-1 diversity at time of infection. Nat. Med. 6 (1), 71–75. Maeda, Y., Venzon, D.J., Mitsuya, H., 1998. Altered drug sensitivity, fitness, and evolution of human immunodeficiency virus type 1 with pol gene mutations conferring multi-dideoxynucleoside resistance. J. Infect. Dis. 177 (5), 1207–1213.
Mansky, L.M., Temin, H.M., 1995. Lower in vivo mutation rate of human immunodeficiency virus type 1 than that predicted from the fidelity of purified reverse transcriptase. J. Virol. 69 (8), 5087–5094.
Martinez-Picado, J., Savara, A.V., Shi, L., Sutton, L., D'Aquila, R.T., 2000. Fitness of human immunodeficiency virus type 1 protease inhibitor-selected single mutants. Virology 275 (2), 318–322.
McNearney, T., Hornickova, Z., Markham, R., Birdwell, A., Arens, M., Saah, A., Ratner, L., 1992. Relationship of human immunodeficiency virus type 1 sequence heterogeneity to stage of disease. Proc. Natl. Acad. Sci. U.S.A. 89 (21), 10247–10251.
Milich, L., Margolin, B., Swanstrom, R., 1993. V3 loop of the human immunodeficiency virus type 1 Env protein: interpreting sequence variability. J. Virol. 67 (9), 5623–5634.
Miller, V., Sabin, C., Hertogs, K., Bloor, S., Martinez-Picado, J., D'Aquila, R., Larder, B., Lutz, T., Gute, P., Weidmann, E., Rabenau, H., Phillips, A., Staszewski, S., 2000. Virological and immunological effects of treatment interruptions in HIV-1 infected patients with treatment failure. AIDS 14 (18), 2857–2867.
Morgado, M.G., Sabino, E.C., Shpaer, E.G., Bongertz, V., Brigido, L., Guimaraes, M.D., Castilho, E.A., Galvao-Castro, B., Mullins, J.I., Hendry, R.M., et al., 1994. V3 region polymorphisms in HIV-1 from Brazil: prevalence of subtype B strains divergent from North American/European prototype and detection of subtype F. AIDS Res. Hum. Retrovir. 10 (5), 569–576.
Nei, M., 1987. Molecular Evolutionary Genetics. Columbia Univ. Press, New York.
Nielsen, R., Yang, Z., 1998. Likelihood models for detecting positively selected amino acid sites and applications to the HIV-1 envelope gene. Genetics 148 (3), 929–936.
Opgen-Rhein, R., Fahmeir, L., Strimmer, K., 2005. Inference of demographic history from genealogical trees using reversible jump Markov chain Monte Carlo. BMC Evolut. Biol. 5 (6), 1–13.
Perelson, A.S., Neumann, A.U., Markowitz, M., Leonard, J.M., Ho, D.D., 1996. HIV-1 dynamics in vivo: virion clearance rate, infected cell life-span, and viral generation time. Science 271 (5255), 1582–1586.
Roos, M.T., Lange, J.M., de Goede, R.E., Coutinho, R.A., Schellekens, P.T., Miedema, F., Tersmette, M., 1992. Viral phenotype and immune response in primary human immunodeficiency virus type 1 infection. J. Infect. Dis. 165 (3), 427–432.
Shankarappa, R., Margolick, J.B., Gange, S.J., Rodrigo, A.G., Upchurch, D., Farzadegan, H., Gupta, P., Rinaldo, C.R., Learn, G.H., He, X., Huang, X.L., Mullins, J.I., 1999. Consistent viral evolutionary changes associated with the progression of human immunodeficiency virus type 1 infection. J. Virol. 73 (12), 10489–10502.
Simmonds, P., Balfe, P., Peutherer, J.F., Ludlam, C.A., Bishop, J.O., Brown, A.J., 1990. Human immunodeficiency virus-infected individuals contain provirus in small numbers of peripheral mononuclear cells and at low copy numbers. J. Virol. 64 (2), 864–872.
Smith, K.Y., Steffens, C.M., Truckenbrod, A., Landay, A., Al-Harthi, L., 2002. Immune reconstitution after successful treatment with protease inhibitor-based and protease inhibitor-sparing antiretroviral regimens. J. Acquired Immune Defic. Syndr. 29 (5), 544–545.
Sucupira, M.C., Souza, I.E., Costa, L.J., Scheinberg, M.A., Diaz, R.S., 2001. Antiretroviral treatment failure and HIV-1 genotypic resistance in Sao Paulo, Brazil, Antiviral Therapy. Antivir. Ther. 6 (4), 263–264.
Wei, X., Ghosh, S.K., Taylor, M.E., Johnson, V.A., Emini, E.A., Deutsch, P., Lifson, J.D., Bonhoeffer, S., Nowak, M.A., Hahn, B.H., et al., 1995. Viral
dynamics in human immunodeficiency virus type 1 infection. Nature 373 (6510), 117–122.
Wolfs, T.F., Zwart, G., Bakker, M., Valk, M., Kuiken, C.L., Goudsmit, J., 1991. Naturally occurring mutations within HIV-1 V3 genomic RNA lead to antigenic variation dependent on a single amino acid substitution. Virology 185 (1), 195–205.
Wolinsky, S.M., Korber, B.T., Neumann, A.U., Daniels, M., Kunstman, K.J., Whetsell, A.J., Furtado, M.R., Cao, Y., Ho, D.D., Safrit, J.T., 1996. Adaptive evolution of human immunodeficiency virus-type 1 during the natural course of infection. Science 272 (5261), 537–542.
Yang, Z., 1997. Phylogenetic Analysis by Maximum Likelihood (PAML), Version 1.4. Department of Integrative Biology, University of California, Berkeley. Zhang, L.Q., MacKenzie, P., Cleland, A., Holmes, E.C., Brown, A.J.,
Simmonds, P., 1993. Selection for specific sequences in the external envelope protein of human immunodeficiency virus type 1 upon primary infection. J. Virol. 67 (6), 3345–3356.
Zhang, L., Diaz, R.S., Ho, D.D., Mosley, J.W., Busch, M.P., Mayer, A., 1997. Host-specific driving force in human immunodeficiency virus type 1 evolution in vivo. J. Virol. 71 (3), 2555–2561.