BGD
9, 5415–5443, 2012Partitioning of soil water among canopy
trees
M. Meißner et al.
Title Page
Abstract Introduction
Conclusions References
Tables Figures
◭ ◮
◭ ◮
Back Close
Full Screen / Esc
Printer-friendly Version Interactive Discussion
Discussion
P
a
per
|
Dis
cussion
P
a
per
|
Discussion
P
a
per
|
Discussio
n
P
a
per
|
Biogeosciences Discuss., 9, 5415–5443, 2012 www.biogeosciences-discuss.net/9/5415/2012/ doi:10.5194/bgd-9-5415-2012
© Author(s) 2012. CC Attribution 3.0 License.
Biogeosciences Discussions
This discussion paper is/has been under review for the journal Biogeosciences (BG). Please refer to the corresponding final paper in BG if available.
Partitioning of soil water among canopy
trees during a soil desiccation period in a
temperate mixed forest
M. Meißner1, M. K ¨ohler1, L. Schwendenmann2, and D. H ¨olscher1
1
Department of Tropical Silviculture and Forest Ecology, Burckhardt Institute, Faculty of Forest Sciences and Forest Ecology, University of G ¨ottingen, B ¨usgenweg 1, 37077 G ¨ottingen, Germany
2
School of Environment, The University of Auckland, Private Bag 92019, Auckland 1142, New Zealand
Received: 12 March 2012 – Accepted: 11 April 2012 – Published: 9 May 2012
Correspondence to: M. Meißner ([email protected])
BGD
9, 5415–5443, 2012Partitioning of soil water among canopy
trees
M. Meißner et al.
Title Page
Abstract Introduction
Conclusions References
Tables Figures
◭ ◮
◭ ◮
Back Close
Full Screen / Esc
Printer-friendly Version Interactive Discussion
Discussion
P
a
per
|
Dis
cussion
P
a
per
|
Discussion
P
a
per
|
Discussio
n
P
a
per
|
Abstract
Complementary resource use is considered an important mechanism in the study of biodiversity effects. Here we explore how species identity, species mixture and tree size influence the vertical partitioning of soil water among canopy trees during a soil des-iccation period. In the Hainich forest, Germany, the species Fagus sylvatica, Tilia sp. 5
andFraxinus excelsior were studied in single- and three-species mixed clusters, each consisting of three co-dominant trees situated within a larger mixed forest stand. Ver-tical soil water uptake depth was assessed by analyzing the hydrogen stable isotope composition (deuterium, δD) of water from depth intervals throughout the soil profile and in tree xylem water. For single species clusters, a mixing model suggested that
10
Fagusdistinctively drew water from soil depths of 0.3–0.5 m,Tiliafrom 0.3–0.5 m and 0.5–0.7 m andFraxinusmainly used water from 0.5–0.7 m. In mixed clusters, the up-take patterns of Fagus and Tilia were similar to those of the single-species clusters (mainly uptake form 0.3–0.5 m), butFraxinusshowed a different uptake pattern. Fraxi-nusin mixture had a somewhat homogenously distributed uptake over the soil depths
15
0.2–0.7 m. For single species clusters, there was no correlation between main soil wa-ter uptake depth and tree diamewa-ter, irrespective of variations in tree size. In contrast, for mixed clusters there was a significant decrease in the main uptake depth with increas-ing tree size (P <0.001,Radj2 =0.73), irrespective of species mix. In consequence, soil water partitioning was strongest where species were mixed and tree size varied. We
20
further analyzed whether single and mixed-species clusters differed in the level of water uptake, e.g. due to complementarity, but our soil water budgeting did not indicate any such differences. A possible explanation might be that the volume of water used is pre-dominantly governed by properties at the stand level, such as aerodynamic roughness, than by processes acting at the meter scale between neighbouring trees. With respect
25
BGD
9, 5415–5443, 2012Partitioning of soil water among canopy
trees
M. Meißner et al.
Title Page
Abstract Introduction
Conclusions References
Tables Figures
◭ ◮
◭ ◮
Back Close
Full Screen / Esc
Printer-friendly Version Interactive Discussion
Discussion
P
a
per
|
Dis
cussion
P
a
per
|
Discussion
P
a
per
|
Discussio
n
P
a
per
|
1 Introduction
Water availability is considered a major control of productivity in forests of central Eu-rope and other regions of the world (Breckle and Walter, 2002; Huxman et al., 2004; Ellenberg and Leuschner, 2010). Under certain environmental conditions, the degree to which water is available for transpiration and production is governed by a plant’s
5
capacity to exploit soil water resources; a property that can be enhanced by comple-mentarity among co-occurring plants. Resource use complecomple-mentarity postulates that functional traits enable plants to exploit resources unavailable to others or use the same resource at a different place or time (Vandermeer, 1989). Resource partitioning and the consequently more effective utilization of resources have been suggested as
10
an explanation for the higher productivity observed in many mixed plant communities compared to monospecific stands (Hagger and Ewel, 1997; Hooper et al., 2005).
One approach to studying plant water acquisition patterns and complementary water use is the assessment of water stable isotopes such as deuterium in soil and plants (Ehleringer and Dawson, 1992). Since roots do not fractionate water during uptake, the
15
deuterium signatures in the plant water reflect the uptake-weighted average ofδD of potential water sources (Ehleringer and Dawson, 1992). A comparison of plant water
δD with that of soil water from different soil depths can reveal the actual soil water source depth for any plant.
By using such an approach in a diverse Panamanian old-growth forest, considerable
20
spatial soil water partitioning among co-existing trees was documented (Jackson et al., 1995; Meinzer et al., 1999). Within and among species, water uptake depth was strongly related to tree size, with smaller trees preferentially tapping deeper sources of soil water than larger trees; species-specific characteristics were however difficult to disentangle (Meinzer et al., 1999). Species-specific soil water uptake patterns were
25
BGD
9, 5415–5443, 2012Partitioning of soil water among canopy
trees
M. Meißner et al.
Title Page
Abstract Introduction
Conclusions References
Tables Figures
◭ ◮
◭ ◮
Back Close
Full Screen / Esc
Printer-friendly Version Interactive Discussion
Discussion
P
a
per
|
Dis
cussion
P
a
per
|
Discussion
P
a
per
|
Discussio
n
P
a
per
|
trees tapping deeper water sources were considerably higher and had a greater diam-eter than that of the cacao trees.
In grasslands as well as tree plantations, it has been observed that plant species diversity enhanced transpiration rates (Verheyen et al., 2008; Kunert et al., 2012), and complementarity in respect of water uptake was discussed as an underlying
mech-5
anism. Such a strategy may however also lead to a faster decline in available water for diverse communities during drought (van Peer et al., 2004; Verheyen et al., 2008). There is little information on complementarity in relation to water uptake in temper-ate broad-leaved mixed forests, but such information is becoming more relevant as there is an ongoing trend in silviculture towards more naturalness or close-to-nature
10
forestry (O’Hara, 2001; L ¨owe, 2007). Close to nature forestry implies a transformation of monocultural stands of narrow tree diameter range into stands composed of several tree species with a broader range of diameter. Since global climate change scenarios predict an increase in intensity and frequency of drought events during the vegetation period for large parts of central Europe (Rowell and Jones, 2006; Christensen et al.,
15
2007; IPCC, 2007), there is an increasing urgency to study possible effects of changing species composition and tree diameter range on soil water use.
The present study was conducted in the temperate broad-leaved Hainich forest of central Germany. Previous studies from the region indicate considerable differences in water vapour exchange at the leaf level (Gebauer et al., 2008) as well as whole-tree
20
water use among co-occurring tree species (K ¨ocher et al., 2009). At the stand level, there were indications of enhanced soil water uptake during periods when soil water content declined in mixed stands compared to monospecific beech stands (Kr ¨amer & H ¨olscher, 2010). In this study, we focused on groups of neighbouring trees (tree clus-ters), as neighborhood was suggested to be highly important in diversity studies (Potvin
25
BGD
9, 5415–5443, 2012Partitioning of soil water among canopy
trees
M. Meißner et al.
Title Page
Abstract Introduction
Conclusions References
Tables Figures
◭ ◮
◭ ◮
Back Close
Full Screen / Esc
Printer-friendly Version Interactive Discussion
Discussion
P
a
per
|
Dis
cussion
P
a
per
|
Discussion
P
a
per
|
Discussio
n
P
a
per
|
soil water uptake scales with tree size. We further asked whether differences in water uptake volumes occur among the differently composed tree clusters.
2 Methods
2.1 Study area
This study was conducted in the Hainich forest in northern Thuringia, central Germany,
5
an area rich in tree species. The study plots are located in the south-eastern part of the forest area on a low mountain range at an elevation of approximately 350 m (a.s.l.). The geological substrate is Triassic limestone covered by loess, forming nutrient-rich Luvi-sols (Guckland et al., 2009). The climate is subatlantic with a mean annual temperature of 7.5◦C and a long term mean precipitation of approximately 590 mm (1973–2004,
10
Deutscher Wetterdienst, Offenbach, Germany). For the last 40 years, the forest has remained almost free of harvesting or thinning due to its use as a military training area since 1964 and its integration into a new national park in 1997 (M ¨older et al., 2006). The forest stands in which our study clusters are located may contain deciduous forest over 200 years old (M ¨older et al., 2009). The dominant tree species areFagus sylvat-15
ica(L.),Fraxinus excelsior (L.),Tilia cordata(Mill). andTilia platyphyllos (Scop.). The twoTilia species often form hybrids, which are phenologically difficult to differentiate. Hence, in this study we did not differentiate between the species and refer to them as
Tilia sp..
2.2 Tree clusters
20
In two mixed forest stands within the Hainich (Lindig and Thiemsburg, approx. 2 km apart) the species Fagus sylvatica, Tilia sp. and Fraxinus excelsior were studied in single and three-species mixed clusters. Clusters consisted of three co-dominant trees and each cluster type was replicated four times resulting in a total of 16 clusters (8 in each area). The average distance between the clusters of each area was 124 m at
BGD
9, 5415–5443, 2012Partitioning of soil water among canopy
trees
M. Meißner et al.
Title Page
Abstract Introduction
Conclusions References
Tables Figures
◭ ◮
◭ ◮
Back Close
Full Screen / Esc
Printer-friendly Version Interactive Discussion
Discussion
P
a
per
|
Dis
cussion
P
a
per
|
Discussion
P
a
per
|
Discussio
n
P
a
per
|
Thiemsburg and 112 m at Lindig. There were no significant differences among cluster types with respect to tree height, but the monospecific Fagus clusters showed sig-nificantly larger stem diameter at breast height (dbh) than the monospecific Fraxinus
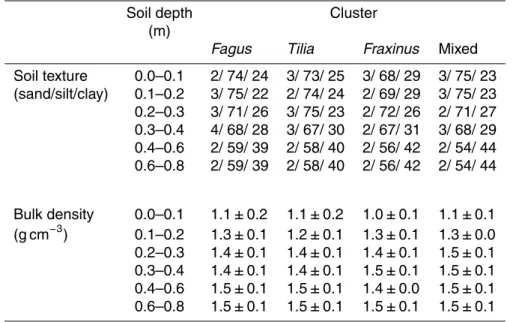
clusters (Table 1). A Shannon-Wiener diversity index (H’) of trees within a 20 m radius of the clusters did not reveal any significant differences among cluster types. Soil clay
5
content and bulk density increased with increasing soil depth comparably within all clusters (Table A1).
2.3 Soil moisture measurements
Soil volumetric water content (θin m3m−3
) was measured with a portable FDR probe (Frequency Domain Reflectometry; Diviner 2000, Sentek Pty Ltd., Stepney, Australia).
10
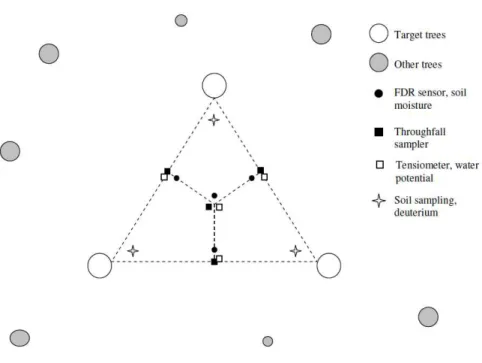
Four PVC access tubes were installed on each cluster (Fig. 1) to a maximum depth of 0.7 m and readings were taken at depth intervals of 0.1 m at an average distance of 3.4±1.5 m from the clustered trees. In some clusters, it was not possible to install all access tubes to the full extent, as heterogeneously weathered limestone debris occurred already at shallow depths and obstructed the installation. The FDR sensor
15
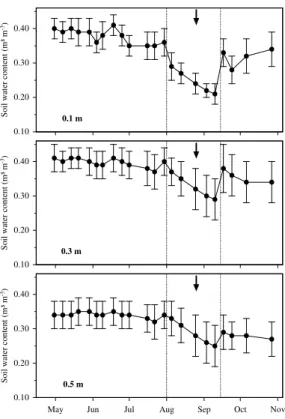
was depth-specifically calibrated for the local soil conditions (Kr ¨amer and H ¨olscher, 2010). Data on soil water content were collected weekly from 30 April to 31 October 2009.
Soil water potentials (ψ in hPa) were measured with tensiometers (T1-UMS, Umwelt Monitoring Systeme, Germany) at depths of 0.1, 0.3 and 0.5 m. The tensiometers used
20
had a measurement limit of −700 hPa, which resulted in them drying-out during pro-longed desiccation periods. To compensate for this effect we used the Rosetta DLL (Dy-namik Linked Library) program by Schaap et al. (2001), implemented in the HYDRUS-1D model (Simunek et al., 2008), to transform measured volumetric soil water contents into soil water potentials. Measured water potentials from tensiometers were used as
25
BGD
9, 5415–5443, 2012Partitioning of soil water among canopy
trees
M. Meißner et al.
Title Page
Abstract Introduction
Conclusions References
Tables Figures
◭ ◮
◭ ◮
Back Close
Full Screen / Esc
Printer-friendly Version Interactive Discussion
Discussion
P
a
per
|
Dis
cussion
P
a
per
|
Discussion
P
a
per
|
Discussio
n
P
a
per
|
2.4 Soil water uptake depth
To assess profiles of relative water uptake for each of the observed species we deter-mined the natural abundance of the stable isotope2H=Deuterium, D. Samples from soil and trees of the 16 clusters were taken once during a summer desiccation pe-riod on 25 and 26 August in 2009 (Fig. 2). Soil samples were taken at depth intervals
5
of 0–0.1, 0.1–0.2, 0.2–0.3, 0.3–0.5 m and 0.5–0.7 m under the crown area inside the clusters. Each sample consisted of a mixture of two adjacent soil cores taken at the same depth. Xylem tissue samples were taken from the outer 6 cm of the stem at three points at breast height from each individual tree with an increment borer. The bark was removed after sampling to avoid contamination of xylem water with phloem water. All
10
samples were stored in 40 ml glass bottles, closed with a Teflon coated lid, sealed with Parafilm, and then kept frozen until water extraction to reduce subsequent evapora-tion from the samples (Ehleringer et al., 2000). Extracevapora-tion of water from plant and soil samples was conducted via cryogenic vacuum extraction according to Ehleringer and Osmond (1989). The applied extraction time was 90 minutes for soil and stem samples
15
(West et al., 2006).
The analysis of extracted water was carried out at the Center for Stable Isotope Research and Analysis (KOSI, Georg-August-University G ¨ottingen, Germany). Mea-surements of the hydrogen isotopic composition were conducted by injecting the wa-ter into a high temperature conversion elemental analyzer (TC/EA, Thermo Electron
20
Corporation, Bremen, Germany) coupled via a Con-Flo III interface to a Delta V Plus isotope ratio mass spectrometer (Thermo Electron Corporation) (Gehre et al., 2004). Isotope ratios were expressed as per mill deviations to the internationally accepted Vienna Standard Mean Ocean Water (VSMOW, RStandard) (Gonfiantini, 1978) with a measurement precision of±2 ‰ forδD.
25
BGD
9, 5415–5443, 2012Partitioning of soil water among canopy
trees
M. Meißner et al.
Title Page
Abstract Introduction
Conclusions References
Tables Figures
◭ ◮
◭ ◮
Back Close
Full Screen / Esc
Printer-friendly Version Interactive Discussion
Discussion
P
a
per
|
Dis
cussion
P
a
per
|
Discussion
P
a
per
|
Discussio
n
P
a
per
|
depth. However, this visual method precludes the possibility of assessing proportional contributions of multiple water sources by quantitative means (Asbjornsen et al., 2007). Therefore we used a mixing model (Isosource, Phillips and Gregg, 2003) that calculates the relative contribution of each soil depth to stem water in order to assess the soil depth each tree used as a potential water source. The underlying assumption is that
5
the isotopic signature of the plant water is a mixture of the signatures found in the soil. In their study, Asbjornsen et al. (2007) showed that this model can reveal subtle differences in water uptake patterns that are not apparent through visual assessment alone. The fractional increment used in our model calculations was set to 0.1 and the uncertainty level to 0.5 ‰. It has to be noted that the mixing model outcome showed a
10
range of feasible source contributions for a given soil layer. For statistical analyses the mean of all feasible source contribution estimates (mean model outcome) for a given soil layer was used. In order to relate tree dbh to main soil water uptake depth we also plotted the isotope signature (δD) of each trees’ main water uptake depth against its respective dbh.
15
2.5 Soil water budgeting
In order to determine the daily water uptake per tree cluster (mm day−1) during the soil desiccation period in 2009 (30 July to 09 October 2009), soil water budgeting was con-ducted at 0–0.7 m soil depth for each cluster (Eq. 1). Average throughfall on all clusters during that period was 8.1 mm. Soil water storage was calculated for each cluster from
20
soil water content (m3m−3) multiplied by the depth of each soil layer (0.1 m).
W u=(T f+Sf)−∆S
∆t (1)
Variables included in the budgeting equation were throughfall (Tf), stemflow (Sf), change in soil water storage between two successional measurements (∆S) and the elapsed time between two successional measurements (∆t).Runoffand deep drainage
25
BGD
9, 5415–5443, 2012Partitioning of soil water among canopy
trees
M. Meißner et al.
Title Page
Abstract Introduction
Conclusions References
Tables Figures
◭ ◮
◭ ◮
Back Close
Full Screen / Esc
Printer-friendly Version Interactive Discussion
Discussion
P
a
per
|
Dis
cussion
P
a
per
|
Discussion
P
a
per
|
Discussio
n
P
a
per
|
the desiccation period. According to a modelling study by Bittner et al. (2010), for these forests stands drainage can be considered zero during summer months and particu-larly so during dry spells.
Stemflow was estimated from data for the same forest area taken from the study of Kr ¨amer and H ¨olscher (2009). For each cluster tree, we used the available data on
5
stemflow in relation to dbh and rainfall intensity to calculate total inflow of stemflow per cluster and rainfall event. However, its quantity was of comparatively little importance (0–3 % of gross precipitation), even forFagus. We measured throughfall at four posi-tions on each cluster. The throughfall gauges consisted of a plastic bottle screwed to a funnel with an opening of 10.5 cm in diameter. The bottle was housed in a plastic tube
10
attached to a metal rod at a height of one meter. To reduce evaporation from the rain gauge, a table tennis ball was placed in the funnel. Gauges were emptied weekly from 30 April to 31 October 2009.
2.6 Data analysis
For every sampling date, mean values and standard deviation of rainfall, soil water
15
content and soil water tension were calculated for each cluster (n=4). Before analy-sis, parameters were tested for normality using the Shapiro-Wilks test. We applied a linear mixed effect model to identify effects of tree species and soil depth on fractional water uptake. An ANOVA was applied on the model outcome for variance analysis fol-lowed by a post-hoc HSD-test for pair wise comparison and correlation analysis. The
20
model output suggested that the explanatory variables soil depth and the soil depth by species interaction had significant effects in the single species clusters as well as in the mixture (p <0.001). For species difference in terms of amounts of daily water uptake and throughfall, ANOVA and HSD-test analysis were conducted, too. All analyses were carried out using R, version 2.11.1 (R Development Core Team, 2010).
BGD
9, 5415–5443, 2012Partitioning of soil water among canopy
trees
M. Meißner et al.
Title Page
Abstract Introduction
Conclusions References
Tables Figures
◭ ◮
◭ ◮
Back Close
Full Screen / Esc
Printer-friendly Version Interactive Discussion
Discussion
P
a
per
|
Dis
cussion
P
a
per
|
Discussion
P
a
per
|
Discussio
n
P
a
per
|
3 Results
3.1 Soil water uptake depth
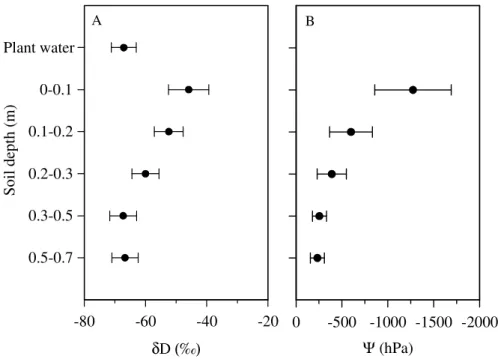
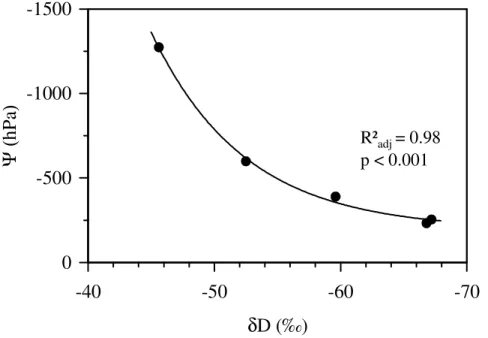
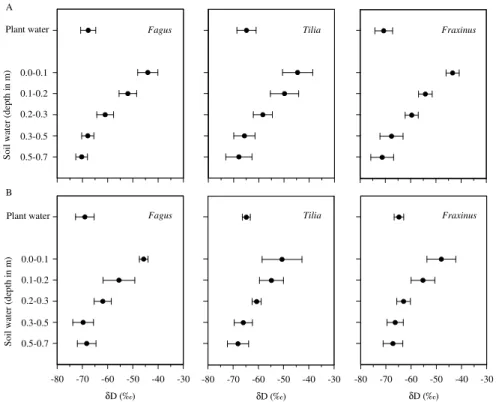
At the time of sampling, the soil water isotopic signature forδD showed a decline in the soil profile from the topsoil to 0.5 m, levelling offat 0.5–0.7 m (Fig. 3a), most likely due to the isotope fractionation caused by evaporation. Isotopic gradients of δD in
5
the soil profiles were comparable among the different species in single-species and in mixed clusters (Fig. A1). Figure A1 shows that stem waterδD matched soil water
δD in deeper layers 0.3–0.5 m and 0.5–0.7 m depending on species and mixture. Soil water potentials (Ψpgn the clusters increased from an average of∼ −1200 hPa in 0– 0.1 m to∼ −600 hPa in 0.1–0.2 m, followed by a mellower increase to ∼ −230 hPa in
10
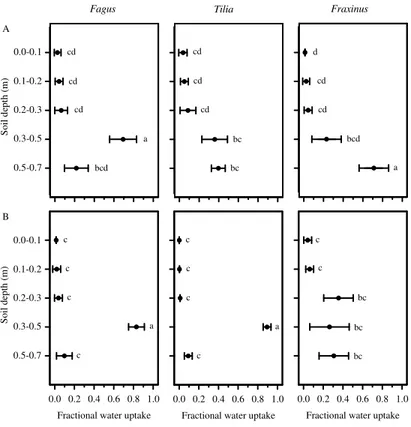
0.5–0.7 m soil depth (Fig. 3b). The patterns shown in Fig. 3 resulted in a strong rela-tionship between soil waterδD andΨ;δD decreased with increasingΨg Fig. 4). The mixing model indicated that in single-species clusters, Fagus obtained water mainly from 0.3–0.5 m, and thatTiliautilized the soil depth range of 0.3–0.5 m and 0.5–0.7 m to a similar extent.Fraxinuslargely drew water from 0.5–0.7 m soil depth, which differed
15
significantly from the other species (Fig. 5a).
In mixed clusters, Fagus and Tilia mainly took water from 0.3–0.5 m. Fraxinus
showed a wider range of water uptake by also tapping water sources from 0.2–0.3 m depth but taking a lower fraction from 0.5–0.7 m soil depth (Fig. 5b). The significant dif-ference in water uptake forFraxinuscompared to the other species was a lower uptake
20
fraction from 0.3–0.5 m.
A comparison of fractional water uptake between species in single and mixed species clusters showed significant differences at the depth intervals 0.3–0.5 m and 0.5–0.7 m forTilia and at 0.5–0.7 m forFraxinuswhile the pattern ofFagusshowed no such dif-ference. In single species clusters compared to mixed clusters,Tiliadrew significantly
25
BGD
9, 5415–5443, 2012Partitioning of soil water among canopy
trees
M. Meißner et al.
Title Page
Abstract Introduction
Conclusions References
Tables Figures
◭ ◮
◭ ◮
Back Close
Full Screen / Esc
Printer-friendly Version Interactive Discussion
Discussion
P
a
per
|
Dis
cussion
P
a
per
|
Discussion
P
a
per
|
Discussio
n
P
a
per
|
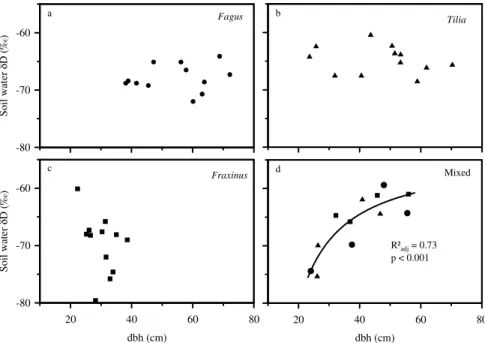
In the single-species clusters, there was no clear relation between tree diameter and deuterium signature of the main soil water uptake depths despite a considerable diameter range (38.1–72.2 cm for Fagus, 23.6–70.3 cm forTilia and 22.3–38.6 cm for
Fraxinus) (Fig. 6a–c). In contrast, in the mixed clusters (dbh ranging from 24.0–56.1 and no species dominating a certain diameter range) δD of the main uptake depth
5
increased significantly with increasing dbh (P <0.001;Radj2 =0.73; Fig. 6d). This sug-gests that in the mixed clusters, trees with large dbh obtained water mainly from 0.3 m and above, whereas trees with a smaller dbh mainly tapped the soil layers below 0.3 m.
3.2 Volume of soil water uptake
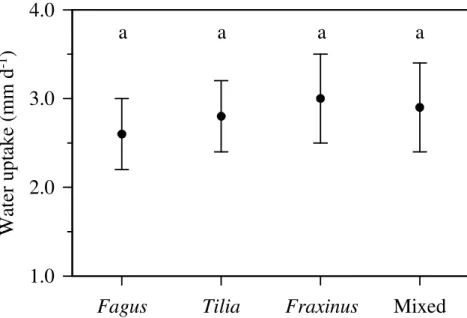
The computed average daily water uptake during the soil desiccation period (from 30
10
July 2009 to 10 September 2009) for the single-species clusters was 2.6±0.4 mm d−1 for Fagus, 2.9±0.5 mm d−1 for Tilia, 3.0±0.5 mm d−1 for Fraxinus; for the mixed species clusters it was 2.8±0.4 mm d−1. There were no significant differences in aver-age daily water uptake between the four cluster types (Fig. 7).
4 Discussion
15
4.1 Water uptake depth
The samples for the deuterium analysis were taken during a summer period when soil water content declined, as it frequently occurs in the region as e.g. documented in H ¨olscher et al. (2003) and Kr ¨amer and H ¨olscher (2010). At the time of sampling, a gradient in soil waterδD signatures had established that accordingly allowed for a
20
differentiation of soil depth. The lowest δD signatures (more negative) were found at greater soil depths, where the soil water potential was also highest (less negative). Due to the water potential gradient it can be assumed that with increasing soil depth water extraction became easier for the trees. A study on fine root distribution conducted in 12 nearby study plots and on the same tree species found that fine root biomass
BGD
9, 5415–5443, 2012Partitioning of soil water among canopy
trees
M. Meißner et al.
Title Page
Abstract Introduction
Conclusions References
Tables Figures
◭ ◮
◭ ◮
Back Close
Full Screen / Esc
Printer-friendly Version Interactive Discussion
Discussion
P
a
per
|
Dis
cussion
P
a
per
|
Discussion
P
a
per
|
Discussio
n
P
a
per
|
decreased markedly with soil depth with∼64–77 % being located in the upper 0.2 m of the soil profile, independent of tree species or species mixture (Meinen et al., 2009a). Therefore, we can assume a comparable root distribution for our tree clusters and species, with a higher fine root allocation in shallow layers and less in the deeper ones. The comparison of xylem and soil water δD values indicated differences in water
5
uptake patterns of the three studied species of canopy trees growing in single species clusters. It revealed a significantly higher water uptake at the depth interval of 0.3– 0.5 m for Fagus clusters and at 0.5–0.7 m also a higher uptake for Fraxinus clusters, compared to the other species respectively (Fig. 5a). From such data, one may be ex-pected to find water uptake complementarity where these species occur in mixtures,
10
due to differing main water uptake depths. In mixed clusters, Fraxinus showed a dis-tinctly lower water uptake from 0.3–0.5 m soil depth and again a higher uptake from 0.5–0.7 m compared to the other two species (Fig. 5b). The assumed complementarity from the single cluster observation was not confirmed in the mixture, as Fagus and
Tiliaappear to draw water from the exact same depth (0.3–0.5 m) andFraxinusshows
15
a different water uptake pattern.
A comparison between single and mixed clusters showed that Tilia and Fraxinus
seemed to have a markedly different water uptake pattern when growing in a mixture with other species, while the uptake pattern of Fagus remained independent of ad-mixture.Fagusis usually considered a highly competitive species in central European
20
forests, which is mainly attributed to the well developed ability of mature trees to cast shade that constricts the development of many other tree species, and considering its own offspring are shade tolerant (Leuschner and Ellenberg, 2010). Moreover, in the rhizosphere,Faguswas documented to be a strong competitor (Leuschner et al., 2001; Rewald and Leuschner, 2009; Meinen et al., 2009a, b). Thus, it is possible that
25
competition withFagusin mixed clusters led to changes in uptake patterns ofTiliaand
Fraxinus.
BGD
9, 5415–5443, 2012Partitioning of soil water among canopy
trees
M. Meißner et al.
Title Page
Abstract Introduction
Conclusions References
Tables Figures
◭ ◮
◭ ◮
Back Close
Full Screen / Esc
Printer-friendly Version Interactive Discussion
Discussion
P
a
per
|
Dis
cussion
P
a
per
|
Discussion
P
a
per
|
Discussio
n
P
a
per
|
observed in both single- and in mixed species clusters. The water uptake ofFraxinus
differed by one and two soil depth intervals in the single and mixed species clusters respectively. However, in both situations it only withdrew approximately 70 % of its wa-ter from the given depths, which suggests that the wawa-ter uptake patwa-tern of Fraxinus
was flexible, but that the share of soil water uptake from soil depths with little
inter-5
ference from other species was similar in both situations. Interestingly,Fraxinusrarely occurs in central European forests as a mature tree in single-species stands while it is frequently found in mixed forests with neighbors belonging to other tree species. In the mixed clusters we found a strong relationship betweenδD signature of the main water uptake depth and dbh (Radj2 = 0.73, p <0.001). Trees with larger dbh obtained
10
water predominantly from the topsoil, whereas trees with smaller dbh mainly tapped the soil layers below. A similar pattern with smaller trees tapping at deeper sources of water than larger ones was found by Meinzer et al. (1999) in a tropical old-growth forest in Panama. The authors suggested that large trees have a more extended horizontal root system, allowing for partial compensation of the reduced water content in upper
15
soil layers with a more extensively explored horizontal soil area. Such an explanation would fit with the finding of Lang et al. (2010) in our study area who found that dbh is positively correlated with root distance from the tree. A higher soil nutrient content is also often found in the upper soil layers, making it beneficial for trees with large dbh to utilize these soil regions, as their demand on nutrients is higher when compared to
20
smaller trees.
Meinzer et al. (1999) further mention that diurnal stem water storage capacity in-creases exponentially with stem size, which might serve as a buffer for peak demand of water uptake. In contrast, in an Indonesian cacao agroforest, Schwendenmann et al. (2010) found that Gliricidia shade trees, which had larger dbh than cacao trees,
25
BGD
9, 5415–5443, 2012Partitioning of soil water among canopy
trees
M. Meißner et al.
Title Page
Abstract Introduction
Conclusions References
Tables Figures
◭ ◮
◭ ◮
Back Close
Full Screen / Esc
Printer-friendly Version Interactive Discussion
Discussion
P
a
per
|
Dis
cussion
P
a
per
|
Discussion
P
a
per
|
Discussio
n
P
a
per
|
In our data set, tree size did however show no effect on the vertical distribution of soil water uptake of trees when located in the single species clusters, despite the similar diameter range compared to the mixed clusters. In addition, in the mixed clusters, there was no particular species dominating in particular tree size (see Fig. 6d). Thus, the re-lation seems to be independent of species identity, but conditional on the presence of
5
other species as neighbors. No further comparison with the Meinzer et al. (1999) study is possible however, as there was no differentiation between trees with con-specific neighbors or different-species neighbors. The reasons behind the strong relation be-tween tree diameter to main soil water uptake depth in mixed clusters and its absence in single-species clusters in our study is ambiguous. It may be influenced by the
plastic-10
ity in soil water uptake depths ofTiliaandFraxinusgrowing in single or mixed species clusters as observed in combination with differing dbh sizes.
4.2 Volume of soil water uptake
Complementarity in soil water uptake may also lead to enhanced soil water use. For example, in a Panamanian tree plantation tree transpiration rates increased with
in-15
creasing tree species diversity, which by way of statistical analysis, Loreau and Hector (2001) suggest to be significant biodiversity effects mainly based on species comple-mentarity (Kunert et al., 2012). There were also indications in the Hainich forest that mixed stands used more water for transpiration in the beginning of a drought period than monospecific beech stands (Kr ¨amer and H ¨olscher, 2010; Bittner et al., 2010).
De-20
spite the observation of complementarity in soil water uptake depth in the present study, we did not observe statistically significant differences in the volume of water uptake be-tween single- and mixed-species clusters. A possible explanation is that evapotranspi-ration rates, which have an affect on the volume of water uptake in trees, are controlled by stand structure and can vary with changes in e.g. aerodynamic roughness. These
25
BGD
9, 5415–5443, 2012Partitioning of soil water among canopy
trees
M. Meißner et al.
Title Page
Abstract Introduction
Conclusions References
Tables Figures
◭ ◮
◭ ◮
Back Close
Full Screen / Esc
Printer-friendly Version Interactive Discussion
Discussion
P
a
per
|
Dis
cussion
P
a
per
|
Discussion
P
a
per
|
Discussio
n
P
a
per
|
All our study clusters were embedded in two larger mixed forest stands and thus possible differences between single- and mixed species stands may not have been detected. It may also be argued that the volume of water extracted in the single- and mixed species clusters is the same, but that the expense of water uptake may be dif-ferent, e.g. leading to altered water use efficiency.
5
Our study also has implications with respect to forest management in close-to-nature forestry, which is an upcoming practice for temperate broad-leaved forest manage-ment. It shows that this practice leads to stands of a wider diameter distribution and it may also enhance tree species diversity. Our data would suggest that a wide diameter range in a single species stand would not lead to a variation in soil water uptake depth.
10
Species mixture hints to complementarity, but our data did not suggest that comple-mentarity leads to increased water consumption. In summary, our results imply that soil water partitioning among canopy trees is strongest where species are mixed and tree size varies.
Acknowledgements. This study was conducted within the framework of the Research Training
15
Group “Graduiertenkolleg 1086: The role of biodiversity for biogeochemical cycles and biotic in-teractions in temperate deciduous forests”, funded by the DFG (German Research Foundation). We thank Dominik Seidel, Tobias Wommelsdorf and Christina Langenbruch for providing data on cluster characteristics, the Centre for Stable Isotope Research and Analysis in G ¨ottingen for the valuable cooperation, Kyle Lawson for support during data collection, and Daniel McCluskey 20
as well as the reviewers for critically reading and commenting the manuscript.
References
Asbjornsen, H., Mora, G., and Helmers, J.: Variation in water uptake dynamics among contrast-ing agricultural and native plant communities in the Midwestern US, Agr. Ecosyst. Environ., 121, 343–356, 2007.
25
BGD
9, 5415–5443, 2012Partitioning of soil water among canopy
trees
M. Meißner et al.
Title Page
Abstract Introduction
Conclusions References
Tables Figures
◭ ◮
◭ ◮
Back Close
Full Screen / Esc
Printer-friendly Version Interactive Discussion
Discussion
P
a
per
|
Dis
cussion
P
a
per
|
Discussion
P
a
per
|
Discussio
n
P
a
per
|
Breckle, S. W. and Walter, H.: Walter’s Vegetation of the Earth: The Ecological Systems of the Geo-Biosphere, 4th Edn., Springer Berlin Heidelberg, 2002.
Christensen, J. H., Hewitson, B., Busuioc, A., Chen, A., Gao, X., Held, I., Jones, R., Kolli, R. K., Kwon, W-T., Laprise, R., Maga ˜na Rueda, V., Mearns, L., Men ´endez, C. G., R ¨ais ¨anen, J., Rinke, A., Sarr, A., and Whetton, P.: Regional climate projections, Climate Change 2007: The 5
Physical Science Basis, Contributions of Working Group I to the Fourth Assessment Report of the Intergovernmental Panel on Climate Change, edited by: Solomon, S. et al., Cambridge University Press, New York, 2007.
DWD (Deutscher Wetterdienst Offenbach), http://www.dwd.de.
Ehleringer, J. R. and Osmond, C.: Stable Isotopes, Plant Physiological Ecology Field Methods 10
and Instrumentation, edited by: Pearcy, R. W., Ehleringer, J. R., Mooney, H. A., and Rundel, P. W., Chapman and Hall Ltd London, 281–299, 1989.
Ehleringer, J. R. and Dawson, T. E.: Water uptake by plants: perspectives from stable isotope composition, Plant Cell Environ., 15, 1073–1083, 1992.
Ehleringer, J. R., Roden, J., and Dawson, T. E.: Assessing ecosystem-level water relations 15
through stable isotope ratio analyses, Methods in Ecosystem Science, edited by: Sala, O. E., Jackson, R. B., Mooney H. A., Howarth, R. W., 181–398, 2000.
Ellenberg, H. and Leuschner, C.: Vegetation Mitteleuropas mit den Alpen: in ¨okologischer, dy-namischer und historischer Sicht, 5th Edn., Ulmer Eugen Verlag, 2010.
Gebauer, T., Horna, V., and Leuschner, C.: Variability in radial sap flux density patterns and sap-20
wood area among seven co-occurring temperate broad-leaved tree species, Tree Physiol., 28, 1821–1830, 2008.
Gehre, M., Geilmann, H., Richter, J., Werner, R. A., Brand, W. A.: Continuous flow 2H/1H and 18O/16O analysis of water samples with dual inlet precision, Rapid Commun. Mass Sp., 18, 2650–2660, 2004.
25
Gonfiantini, R.: Standards for stable isotope measurements in natural compounds, Nature, 271, 534–536, 1978.
Guckland, A., Jacob, M., Flessa, H., Thomas, F. M., and Leuschner, C.: Acidity, nutrient stocks, and organic-matter content in soils of a temperate deciduous forest with different abundance of European beech (Fagus sylvatica L.), J. Plant Nutr. Soil Sc., 172, 500–511, 2009.
30
BGD
9, 5415–5443, 2012Partitioning of soil water among canopy
trees
M. Meißner et al.
Title Page
Abstract Introduction
Conclusions References
Tables Figures
◭ ◮
◭ ◮
Back Close
Full Screen / Esc
Printer-friendly Version Interactive Discussion
Discussion
P
a
per
|
Dis
cussion
P
a
per
|
Discussion
P
a
per
|
Discussio
n
P
a
per
|
H ¨olscher, D., Koch, O., Korn, S., and Leuschner, C.: Sap flux of five co-occurring tree species in a temperate broad-leaved forest during seasonal soil drought, Trees, 19, 628–637, 2005. Hooper, D. U., Chapin III, F. S., Ewel, J. J., Hector, A., Inchausti, P., Lavorel, S., Lawton, J. H.,
Lodge, D. M., Loreau, M., Naeem, S., Schmid, B., Set ¨al ¨a, H., Symstad, A. J., Vandermeer, J., and Wardle, D. A.: Effects of biodiversity on ecosystem functioning: a consensus of current 5
knowledge, Ecol. Monogr., 75, 3–35, 2005.
Huxman, T. E., Smith, M. D., Fay, P. A., Knapp, A. K., Shaw, M. R., Loik, M. E., Smith, S. D., Tissue, D. T., Zack, J. C., Weltzin J. F., Pockman, W. T., Sala, O. E., Haddad, B. M., Harte, J., Koch, G. W., Schwinning, S., Small, E. E., and Williams, D. G.: Convergence across biomes to a common rain-use efficiency, Nature, 429, 651–654, 2004.
10
Intergovernmental Panel on Climate Change (IPCC), Climate Change 2007: The Physical Sci-ence Basis, Contribution of Working Group I to the Fourth Assessment Report of the Inter-governmental Panel on Climate Change, edited by: Solomon, S. et al., Cambridge University Press, New York, 996 pp., 2007.
Jackson, P. C., Cavelier, J., Goldstein, G., Meinzer, F. C., and Holbrook, N. M.: Partitioning of 15
water-resources among plants of a lowland tropical forest, Oecologia, 101, 197–203, 1995. K ¨ocher, P., Gebauer, T., Horna, V., and Leuschner, C.: Leaf water status and stem xylem flux
in relation to soil drought in five temperate broad-leaved tree species with contrasting water use strategies, Ann. For. Sci., 66, 101, 2009.
Kr ¨amer, I. and H ¨olscher, D.: Rainfall partitioning along a tree diversity gradient in a deciduous 20
old-growth forest in Central Germany, Ecohydrology, 2, 102–114, 2009.
Kr ¨amer, I. and H ¨olscher, D.: Soil water dynamics along a tree diversity gradient in a deciduous forest in Central Germany, Ecohydrology, 3, 262–271, 2010.
Kunert, N., Schwendenmann, L., Potvin, C., and H ¨olscher, D.: Tree diversity enhances tree transpiration in a Panamanian forest plantation, J. Appl. Ecol., 49, 135–144 2012.
25
Lang, C., Dolynska, A., Finkeldey, R., and Polle, A.: Are beech (Fagus sylvatica) roots territorial? Forest Ecol. Manag., 260, 1212–1217, 2010.
Leuschner, C., Hertel, D., Coners, H., and B ¨uttner, V.: Root competition between beech and oak: a hypothesis, Oecologia, 126, 276–284, 2001.
Loreau, M. and Hector, A.: Partitioning selection and complementarity in biodiversity experi-30
ments, Nature, 412, 72–76, 2001.
BGD
9, 5415–5443, 2012Partitioning of soil water among canopy
trees
M. Meißner et al.
Title Page
Abstract Introduction
Conclusions References
Tables Figures
◭ ◮
◭ ◮
Back Close
Full Screen / Esc
Printer-friendly Version Interactive Discussion
Discussion
P
a
per
|
Dis
cussion
P
a
per
|
Discussion
P
a
per
|
Discussio
n
P
a
per
|
Meinen, C., Hertel, D., and Leuschner, C.: Biomass and morphology of fine roots in temperate broad-leaved forests differing in tree species diversity: is there evidence of belowground overyielding? Oecologia, 161, 99–111, 2009a.
Meinen, C., Leuschner, C., Ryan, N. T., and Hertel, D.: No evidence of spatial root system segregation and elevated fine root biomass in multi-species temperate broad-leaved forests, 5
Trees, 23, 941–950, 2009b.
Meinzer, F. C., Andrade, J. L., Goldstein, G., Holbrook, N. M., Cavelier, J., and Wright, S. J.: Partitioning of soil water among canopy trees in a seasonally dry tropical forest, Oecologia, 121, 293–301, 1999.
M ¨older, A., Bernhardt-R ¨omermann, M., and Schmidt, W.: Forest ecosystem research in Hainich 10
National Park (Thuringia): First results on flora and vegetation in stands with contrasting tree species diversity, Waldoekologie online, 3, 83–99, 2006.
M ¨older, A., Bernhardt-R ¨omermann, M., and Schmidt, W.: Vielf ¨altige Baumschicht - reichhaltige Verj ¨ungung? Zur Naturverj ¨ungung von artenreichen Laubw ¨aldern im Nationalpark Hainich, Allgemeine Forst- und Jagdzeitung, 180, 76–87, 2009.
15
O’Hara, K. L.: The Silviculture of transformation – a commentary, Forest Ecol. Manag., 151, 81–86, 2001.
Phillips, D. L. and Gregg, J. W.: Source partitioning using stable isotopes: coping with too many sources, Oecologia, 136, 261–269, 2003.
Potvin, C. and Dutilleul, P.: Neighborhood effects and size-asymmetric competition in a tree 20
plantation varying in diversity, Ecology, 90, 321–327, 2009.
Rewald, B. and Leuschner, C.: Belowground competition in a broad-leaved temperate mixed forest: pattern analysis and experiments in a four-species stand, Eur. J. For. Res., 128, 387– 398, 2009.
Rowell, D. P. and Jones, R. G.: Causes and uncertainty of future summer drying over Europe, 25
Clim. Dynam., 27, 281–299, 2006.
Schaap, M. G., Leij, F. J., and Van Genuchten, M. T.: ROSETTA: a computer program for es-timating soil hydraulic parameters with hierarchical pedotransfer functions, J. Hydrol., 251, 163–176, 2001.
Schwendenmann, L., Veldkamp, E., Moser, G., H ¨olscher, D., K ¨ohler, M., Clough, Y., Anas, I., 30
BGD
9, 5415–5443, 2012Partitioning of soil water among canopy
trees
M. Meißner et al.
Title Page
Abstract Introduction
Conclusions References
Tables Figures
◭ ◮
◭ ◮
Back Close
Full Screen / Esc
Printer-friendly Version Interactive Discussion
Discussion
P
a
per
|
Dis
cussion
P
a
per
|
Discussion
P
a
per
|
Discussio
n
P
a
per
|
functioning of a cacao agroforestry system, Sulawesi, Indonesia, Glob. Change Biol., 16, 1515–1530, 2010.
Simunek, J., Van Genuchten, M. T., and Sejna, M.: Development and Applications of the HY-DRUS and STANMOD Software Packages and Related Codes, Vadose Zone J., 7, 587–600, 2008.
5
Vandermeer, J. H.: The ecology of intercropping, Cambridge University Press, Cambridge, UK, 1989.
Van Peer, L., Nijs, I., Reheul, D., and De Cauwer, B.: Species richness and susceptibility to heat and drought extremes in synthesized grassland ecosystems: compositional vs physiological effects, Funct. Ecol., 18, 769–778, 2004.
10
Verheyen, K., Bulteel, H., Palmborg, C., Olivi ´e, B., Nijs I., Raes, D., and Muys, B.: Can com-plementarity in water use help to explain diversity-productivity relationships in experimental grassland plots? Oecologia, 156, 351–361, 2008.
BGD
9, 5415–5443, 2012Partitioning of soil water among canopy
trees
M. Meißner et al.
Title Page
Abstract Introduction
Conclusions References
Tables Figures
◭ ◮
◭ ◮
Back Close
Full Screen / Esc
Printer-friendly Version Interactive Discussion
Discussion
P
a
per
|
Dis
cussion
P
a
per
|
Discussion
P
a
per
|
Discussio
n
P
a
per
|
Table 1.Characteristics of single and mixed species tree clusters. Values are means±sd (n=
4), similar letters specify no significant difference between cluster types. The Shannon index (H’) refers to a 20 m radius around the center of each cluster.
Cluster
Fagus Tilia Fraxinus Mixed
Tree dbh (cm) 54.4 ± 12a 44.1 ± 14.3ab 30.2 ± 3.7b 39.7 ± 8.1ab
Tree height (m) 28.6 ± 2.8a 27.9 ± 2.5a 29.9 ± 1.1a 28.4 ± 2.2a
Cluster area (m2) 33.3 ± 14.6a 27.1 ± 18.8a 7.8 ± 1.6a 21.7 ± 21.4a
BGD
9, 5415–5443, 2012Partitioning of soil water among canopy
trees
M. Meißner et al.
Title Page
Abstract Introduction
Conclusions References
Tables Figures
◭ ◮
◭ ◮
Back Close
Full Screen / Esc
Printer-friendly Version Interactive Discussion
Discussion
P
a
per
|
Dis
cussion
P
a
per
|
Discussion
P
a
per
|
Discussio
n
P
a
per
|
Table A1.Soil texture and soil bulk density of single and mixed species tree clusters. Values are means±sd (n=4)
Soil depth Cluster
(m)
Fagus Tilia Fraxinus Mixed
Soil texture 0.0–0.1 2/ 74/ 24 3/ 73/ 25 3/ 68/ 29 3/ 75/ 23 (sand/silt/clay) 0.1–0.2 3/ 75/ 22 2/ 74/ 24 2/ 69/ 29 3/ 75/ 23 0.2–0.3 3/ 71/ 26 3/ 75/ 23 2/ 72/ 26 2/ 71/ 27 0.3–0.4 4/ 68/ 28 3/ 67/ 30 2/ 67/ 31 3/ 68/ 29 0.4–0.6 2/ 59/ 39 2/ 58/ 40 2/ 56/ 42 2/ 54/ 44 0.6–0.8 2/ 59/ 39 2/ 58/ 40 2/ 56/ 42 2/ 54/ 44
BGD
9, 5415–5443, 2012Partitioning of soil water among canopy
trees
M. Meißner et al.
Title Page
Abstract Introduction
Conclusions References
Tables Figures
◭ ◮
◭ ◮
Back Close
Full Screen / Esc
Printer-friendly Version Interactive Discussion
Discussion
P
a
per
|
Dis
cussion
P
a
per
|
Discussion
P
a
per
|
Discussio
n
P
a
per
|
BGD
9, 5415–5443, 2012Partitioning of soil water among canopy
trees
M. Meißner et al.
Title Page Abstract Introduction Conclusions References Tables Figures ◭ ◮ ◭ ◮ Back Close
Full Screen / Esc
Printer-friendly Version Interactive Discussion Discussion P a per | Dis cussion P a per | Discussion P a per | Discussio n P a per | 0.10 0.20 0.30 0.40 S o il w at er co n te n t (m ³ m ) -3 0.1 m 0.10 0.20 0.30 0.40 S o il w at er co n te n t (m ³ m ) -3 0.3 m 0.10 0.20 0.30 0.40 S o il w a te r co n te n t (m ³ m ) -3
May Jun Jul Aug Sep Oct Nov
0.5 m
BGD
9, 5415–5443, 2012Partitioning of soil water among canopy
trees
M. Meißner et al.
Title Page
Abstract Introduction
Conclusions References
Tables Figures
◭ ◮
◭ ◮
Back Close
Full Screen / Esc
Printer-friendly Version Interactive Discussion
Discussion
P
a
per
|
Dis
cussion
P
a
per
|
Discussion
P
a
per
|
Discussio
n
P
a
per
|
0 -500 -1000 -1500 -2000
Ψ(hPa)
B
-80 -60 -40 -20
δD ‰( )
0.5-0.7 0.3-0.5 0.2-0.3 0.1-0.2 0-0.1 Plant water
S
o
il
d
ep
th
(m
)
A
BGD
9, 5415–5443, 2012Partitioning of soil water among canopy
trees
M. Meißner et al.
Title Page
Abstract Introduction
Conclusions References
Tables Figures
◭ ◮
◭ ◮
Back Close
Full Screen / Esc
Printer-friendly Version Interactive Discussion
Discussion
P
a
per
|
Dis
cussion
P
a
per
|
Discussion
P
a
per
|
Discussio
n
P
a
per
|
0
-500
-1000
-1500
Ψ
(
)
h
P
a
-40
-50
-60
-70
δ
D (‰)
R²adj= 0.98
p < 0. 010
BGD
9, 5415–5443, 2012Partitioning of soil water among canopy
trees
M. Meißner et al.
Title Page Abstract Introduction Conclusions References Tables Figures ◭ ◮ ◭ ◮ Back Close
Full Screen / Esc
Printer-friendly Version Interactive Discussion Discussion P a per | Dis cussion P a per | Discussion P a per | Discussio n P a per | Fraxinus Tilia Fagus 0.5-0.7 0.3-0.5 0.2-0.3 0.1-0.2 0.0-0.1 S o il d ep th (m )
0.0 0.2 0.4 0.6 0.8 1.0 Fractional water uptake
0.0 0.2 0.4 0.6 0.8 1.0 Fractional water uptake
0.0 0.2 0.4 0.6 0.8 1.0 Fractional water uptake 0.5-0.7 0.3-0.5 0.2-0.3 0.1-0.2 0.0-0.1 S o il d ep th (m ) A B a cd cd cd bcd bc cd cd cd bc cd cd d bcd a c c c c c c c c c c bc bc bc a a
BGD
9, 5415–5443, 2012Partitioning of soil water among canopy
trees
M. Meißner et al.
Title Page
Abstract Introduction
Conclusions References
Tables Figures
◭ ◮
◭ ◮
Back Close
Full Screen / Esc
Printer-friendly Version Interactive Discussion
Discussion
P
a
per
|
Dis
cussion
P
a
per
|
Discussion
P
a
per
|
Discussio
n
P
a
per
|
-80 -70 -60
S
o
il
w
at
er
D
(‰
)
δ
20 40 60 80
dbh (cm) -80
-70 -60
S
o
il
w
at
er
D
(‰
)
δ
20 40 60 80
dbh (cm)
R²adj= 0.73 p < 0.001
Fagus
Mixed
Fraxinus
Tilia
a b
c d
BGD
9, 5415–5443, 2012Partitioning of soil water among canopy
trees
M. Meißner et al.
Title Page
Abstract Introduction
Conclusions References
Tables Figures
◭ ◮
◭ ◮
Back Close
Full Screen / Esc
Printer-friendly Version Interactive Discussion
Discussion
P
a
per
|
Dis
cussion
P
a
per
|
Discussion
P
a
per
|
Discussio
n
P
a
per
|
1.0
2.0
3.0
4.0
W
at
er
u
p
ta
k
e
(m
m
d
)
-1
Fagus
Tilia
Fraxinus
Mixed
a
a
a
a
Fig. 7.Estimated water uptake (mm d−1) from 0 to 0.7 m soil depth during desiccation period from 30 July to 09 October 2009. Measured on single and mixed species clusters composed of
Fagus,Tilia andFraxinus. Values are means±sd (n=4), similar letters specify no significant
BGD
9, 5415–5443, 2012Partitioning of soil water among canopy
trees
M. Meißner et al.
Title Page
Abstract Introduction
Conclusions References
Tables Figures
◭ ◮
◭ ◮
Back Close
Full Screen / Esc
Printer-friendly Version Interactive Discussion
Discussion
P
a
per
|
Dis
cussion
P
a
per
|
Discussion
P
a
per
|
Discussio
n
P
a
per
|
0.5-0.7 0.3-0.5 0.2-0.3 0.1-0.2 0.0-0.1 Plant water
S
o
il
w
at
er
(d
ep
th
in
m
)
Fagus Tilia Fraxinus
A
-80 -70 -60 -50 -40 -30
δD (‰)
-80 -70 -60 -50 -40 -30
δD (‰)
-80 -70 -60 -50 -40 -30
δD (‰) 0.5-0.7
0.3-0.5 0.2-0.3 0.1-0.2 0.0-0.1 Plant water
S
o
il
w
at
er
(d
ep
th
in
m
)
Fagus Tilia Fraxinus
B