304
ANALYSIS OF THE DIFFUSION OF SCIENTIFIC RESEARCH ON RIVER BASINS (WATERSHEDS) IN BRAZIL
D. Bordin1, L.R.A. Gabriel Filho1*, F.F. Putti2, C.P. Cremasco1, B.C. Goes1, E.G. Satolo1 1
UNESP - Univ Estadual Paulista, Campus de Tupã, SP, Brasil
2
UNESP - Univ Estadual Paulista, Campus de Botucatu, SP, Brasil.
ABSTRACT
River basins or watershed areas have suffered great impact due to deforestation and pollution, which in turn also comprises decrease in the volume of water in rivers involved. Current research overviews scientific literature related to the theme "Watershed", published between 2002 and 2012, and assess the scientific contribution. The research method consists of an exploratory bibliographical survey of Brazilian research on the above-mentioned subject retrieved from the database Web of Science (WoS). Data treatment was conducted through a bibliometric analysis to identify institutions with greater representation in publications and citations by region. The bibliometric analysis was performed with software developed in Delphi language and types of Microsoft Excel® software, Ucinet®, NetDraw® and ArcGIS® that enabled the development of graphical representations related to publications and citations by regions. When the analysis of bibliometric indicators was analyzed, the most productive institutions were mapped and the impact and visibility of their publications and relationships that occurred in collaboration between researchers from major institutions were evaluated. Research related to the theme "Watershed" has its largest production between physically close institutions. This fact shows the need for government action, through investments, for the integration of researchers from different regions to construct a national coverage for these networks. Finally, the Southeast Region of Brazil should be underscored due to its production of more than 50% of publications and citations out of the national total.
Keywords: bibliometrics, scientific collaboration, water.
ANÁLISE DA DIFUSÃO DAS PESQUISAS CIENTÍFICAS COM BACIAS HIDROGRÁFICAS NO BRASIL
RESUMO
As bacias hidrográficas vêm sofrendo grande impacto devido ao desmatamento e a poluição, que consequentemente está apresentando redução no volume de água dos rios envolvidos nelas. O objetivo desta pesquisa é traçar um panorama da produção científica relacionado ao tema “Bacias Hidrográficas” no período entre 2002 e 2012, bem como mensurar a contribuição científica. Para tanto, este trabalho utilizou de como método de pesquisa o levantamento bibliográfico exploratório das pesquisas brasileiras no referido tema, a partir da base de dados Web of Science (WoS). A partir destes dados foi conduzido o tratamento dos dados por meio de uma análise bibliométrica a fim de identificar instituições com maior representatividade em publicações e citações por região. A análise bibliométrica foi realizada com um software desenvolvido em linguagem Delphi e dos tipos de software
Microsoft Excel®, Ucinet®, NetDraw® e ArcGIS® que possibilitaram o desenvolvimento de
representações gráficas que relacionaram as publicações e citações por regiões. Ao realizar a
305 análise dos indicadores bibliométricos, mapeou-se as instituições mais produtivas, calculando o impacto e a visibilidade das publicações e os relacionamentos que ocorrem na colaboração entre pesquisadores das principais instituições. Conclui-se que a pesquisa relacionada ao tema
“Bacias Hidrográficas” tem uma maior produção entre instituições fisicamente próximas, o
que mostra a necessidade de uma atuação governamental, por meio de investimentos, facilitando assim, a integração de pesquisadores de diferentes regiões e possibilitando que essas redes tenham abrangência nacional. Por fim, merece destaque a região Sudeste do Brasil por possuir mais de 50% de publicações e citações do total nacional.
Palavras-chave: bibliometria, colaboração científica, água.
INTRODUCTION
Although two thirds of our planet is composed of water, seas and oceans, there is a growing concern on the scarcity of available fresh water resources for human needs. Total fresh water is a mere 2.7% (approximately 38 million km³) of total available water (1.3870 million km³) (VARGAS, 1999).
Approximately 2.07% of fresh water lies in solid form, comprising glaciers, icebergs and polar ice caps, with a remaining 0.63% for human consumption (MAIA NETO, 1997).
Contrastingly, Brazil has the privilege of harboring a great diversity of natural resources, especially available water resources. In fact, Brazil produces 53% of fresh water in South America and 12% of world total, constituting a highly important share in world hydrography (REBOUÇAS; BRAGA; TUNDISI, 1999). Brazilian river basins or watersheds are subdivided into 10 hydrographic regions, with special reference to three complexes: the Amazon river basin; the São Francisco river basin; the Paraná river basin, with 80% of Brazilian water production (CUNHA; GUERRA, 2003).
The Amazon river basin, totaling 6,925,674 km², of which 63% lies within Brazilian territory, occupies 42% of its territory. It energy potential is 597,606 kW, with approximately 1% of national electric energy, currently produced by 32 hydroelectric plants (BRASIL, 2014).
The São Francisco hydrographic region comprises 8% of the country, with a total land mass of 638,324 km², subdivided
into the High São Francisco (17% of the surface area), Middle São Francisco (50% of the region), Sub-Middle São Francisco (26%) and Low São Francisco (6% of the region). Its current hydroelectric potential lies at 10,380 MW, or 16% of the national hydroelectric potential (BRASIL, 2014).
The Paraná river basin comprises 10% of Brazilian territory, or rather, 879,860 km², and an electric energy potential of 59.3% of all national production, with 38,370,836 kW. There are currently 176 hydroelectric plants in the region. The Itaipu hydroelectric plant should be underscored as the biggest active plant in the world (BRASIL, 2014).
A river basin is defined as a unit of territorial management or a physical unit for management, planning and economical and social development (MUSETTI, 2000). According to Botelho & Silva (2007), the erstwhile hedge limits have been replaced by natural limitations represented by watersheds.
According to Borsato and Martoni (2004), the river basin is defined as a limited area with rivers as its territorial borders, with the specific aim at naturally catching rain water by surface strands. Water drainage converges to a single water exit point made up of several water courses. Queiroz et al. (2009) state that a river basin is a set of different drained land areas limited by a single river, its affluents and sub-affluents.
306 The process must be based on the
constitution of a policy in which general guidelines for a management model should be established. The above includes the administration and functional organization of a management system which comprises all private and public agencies for the implantation of the policy (FREITAS, 2000).
The importance of the management of water resources is related to sustainability and environment as a function of the policies adopted. It affects the economic and social issues within the river basin in which water is administered through knowledge of demand and supply, coupled to environmental conservation. The above is relevant for the effective implantation of management (SANCHES et al, 2009; CRUZ; TUCCI, 2008).
Brazilian Law 9.433, instituted by the National Policy for Water Resources on January 8, 1997 (BRASIL, 1997) established river basins as a unit for the Management of Water Resources, characterized by sharing management with government administration, public works, environmental management and others to consolidate the decentralization and control of the river basins (PORTO; PORTO, 2008; MUSETTI, 2000).
The availability of water in certain regions in Brazil is highly important due to the enormous water potential of the country for regional economic development and the development of the economy based on the hydro-social cycle (TUNDISI, 2008). So that economic stimuli could be enhanced, the revitalization of rivers, lakes and dams should be undertaken in several regions of Brazil, with special attention to the southeastern region, with the subsequent generation of employment, earnings and opportunities for the industry of new technologies for management (TUNDISI, 2008).
It is thus highly important to disseminate strategic studies on water
resources and economy, water resources and energy, water and human health, water and world changes in Brazil to promote long-term scenarios that stimulate consolidated public policies (TUNDISI, 2008).
Studies have been conducted through the years by many Institutes for Higher Education which built knowledge on scientific research worldwide and thus obtained the status of organizations. In a relevant research university one may find the structure of a group formed by post-doctors, post-graduate and graduate students involved with the scientific team (BEAVER, 2001).
Brazil has in fact been in the limelight within the scientific world. It has attained to representative positions by the number of publications, from 8000 articles to 17000 articles in 10 years. The US is its most important international partner in research with 11.1% of all published articles (ADAMS; KING, 2009).
Within the above context which features the importance of river basins in Brazil within a world scenario that currently faces problems of water scarcity worldwide, it is highly important to analyze how Brazilian researchers develop their investigation on the theme. Current paper provides a review of Brazilian scientific production on river basins between 2002 and 2012 to assess its associated scientific contribution.
307
MATERIALS AND METHODS
Current theoretical research is structured on bibliographical information sources retrieved from data base Web of
Science (WoS) which are required to
construct bibliometric indicators of scientific production. Quantitative research is characterized by data systems which include statistical surveys on the theme without any specific concern on their quality (GREGOLIN et al., 2005).
Current research has also an exploratory and descriptive stance. It has an exploratory character and a descriptive one since it seeks information and the characteristics of a defined issue to understand the factors involved and the behavior of the phenomena (COLLINS; HUSSEY, 2005).
Biometry, one of the methods developed for the systematic review of the literature on a specific theme, is the technique for the analysis of publications. It is acknowledged as methodic, transparent and repeatable device (COOK et al., 1997; COOPER, 1998). The term (from the French bibliométrie) first occurred in 1934 in the Traité de
Documentation, by the Belgian librarian
Paul Otlet, who established a new field for the measurement of all aspects related to the publication and reading of books and documents (ROUSSEAU, 2014).
Bibliometry fails to be efficient if publications are characterized by the manipulation of information, with damages of indicators and results. Its development requires a long duration of time and mistakes may occur in data collection with the consequent difficulties in comparisons. In fact, authors frequently use information in which they quoted themselves and thus damage the indicators.
The choice of consolidated and trustworthy data bases is an important process in the conduction of the study. WoS is a world-wide bibliographic data base with a catalogue of thousands of specialized scientific journals. In fact, WoS has been chosen since it identifies
scientific and collaboration productions per institutes (SONNENWALD, 2008).
The first stage in research comprises a search of article in WoS database provided by keywords and within the specific period 2001-2012. The expression
“River basins” between inverted commas
was employed to pinpoint the precise term and not the articles that contained the words, albeit not sequentially, which would jeopardize results.
Inconsistencies in spelling of the terms triggered the standardization and cleansing of data, which, although time-consuming, was a highly recommended procedure to warrant the trustworthiness of results.
This stage recovered a great number of publications on the theme, featuring 94 related articles published between 2002 and 2012.
The next stage consisted in the elaboration of biometric indicators that counted a great deal of data retrieved from the identified articles. Software in Delphi was developed to extract information from WoS database and map the decomposition of data by the identification of relationships (PORTER, 1999). The software could produce indicators from one or two dimensions (also known as frequency lists and matrixes) and generate files to be imported by Microsoft Excel®, and thus the co-relationship between years and regions of publication would be achieved.
Information comprised publications and their geographic distributions throughout the regions in Brazil and separately the institutions within the national boundaries which appeared in
tables headed by the title “Brazil”,
indicating institutions with no indication as regard to state. The institutions responsible for publications were also verified. The co-relationship of each region, the institutions in Brazil and total publications, as a function of time, were also calculated.
308 periods, the standardization of data is
time-consuming and highly complex in bibliometry. The manipulation of information and the generation of results generally take up a great deal of time (ROMANETTO, 2012).
The 94 bibliographic registers on scientific publications between 2002 and 2012 were treated to a systematic normalization of names of institution, with hand-made alterations, to guarantee the trustworthiness of data.
Software in Delphi produced a frequency list, or rather, uni-dimension tallies of the publications, foregrounded on data in a field of bibliographic registration. Matrixes were also produced with data crossing and identification of the number of publications for each region, in each year, within a set of analyzed data.
The third stage comprised a graphic representation of results. The process involved the export of the frequency lists to the software Microsoft Excel® for better visualization and handling of data. A posteriori information was exported for the construction of a map of publications with ArcGIS® and for the establishment of the scientific collaboration network between institutions with the greatest number of publications. Softwares Ucinet® and
NetDraw® were then employed.
A series of indicators were retrieved after the treatment of the above data. They subsidized data analysis performed in the subsequent sections, verifying behavior of publications and citations throughout the years.
RESULTS AND DISCUSSIONS
Survey of scientific publications retrieved from WoS indicated 94
documents related to “River basins”
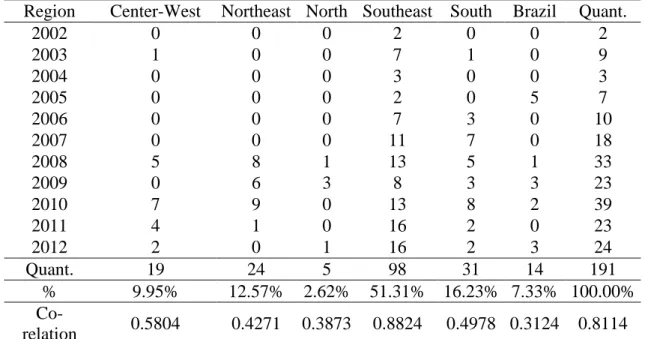
between 2002 and 2012. Table 1 shows
that the contribution of the southeastern region of Brazil reached 51.31%, far greater than the sum of all the other Brazilian regions and institutions
TABLE 1 – Number of publications between 2002 and 2012 in Brazil on the theme of River basins by National and State Institutions
Region Center-West Northeast North Southeast South Brazil Quant.
2002 0 0 0 2 0 0 2
2003 1 0 0 7 1 0 9
2004 0 0 0 3 0 0 3
2005 0 0 0 2 0 5 7
2006 0 0 0 7 3 0 10
2007 0 0 0 11 7 0 18
2008 5 8 1 13 5 1 33
2009 0 6 3 8 3 3 23
2010 7 9 0 13 8 2 39
2011 4 1 0 16 2 0 23
2012 2 0 1 16 2 3 24
Quant. 19 24 5 98 31 14 191
% 9.95% 12.57% 2.62% 51.31% 16.23% 7.33% 100.00%
Co-relation 0.5804 0.4271 0.3873 0.8824 0.4978 0.3124 0.8114
Source: prepared by the author from WoS data.
Table 1 shows that the column with the heading “Brazil” refers to nationwide institutions in which their association with
309 Table 1 also shows that there was an
increase in the number of publications throughout the period, specifically in 2010, and in most publications. Co-relationships calculated by the number of publication within time provided positive rates and indicated an increase in all cases. There was also a strong co-relationship between
publications during the period, especially in the southeastern region, and national total, or rather, 0.8824 and 0.8114 respectively.
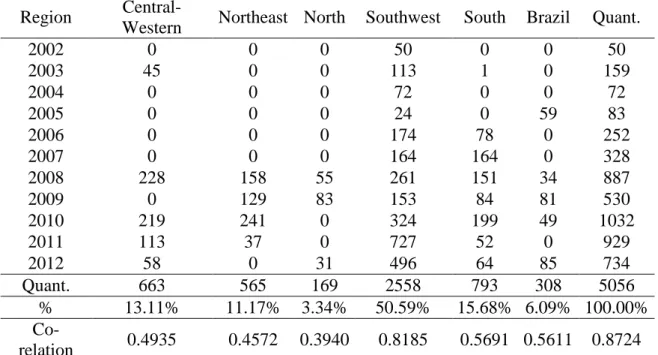
TABLE 2 also reveals that the southeastern region featured the greatest number of citations than the sum of all the other regions and nation-wide institutions.
TABLE 2 – Evolution of citations of nation-wide and regional institutions between 2002 and 2012.
Region
Central-Western Northeast North Southwest South Brazil Quant.
2002 0 0 0 50 0 0 50
2003 45 0 0 113 1 0 159
2004 0 0 0 72 0 0 72
2005 0 0 0 24 0 59 83
2006 0 0 0 174 78 0 252
2007 0 0 0 164 164 0 328
2008 228 158 55 261 151 34 887
2009 0 129 83 153 84 81 530
2010 219 241 0 324 199 49 1032
2011 113 37 0 727 52 0 929
2012 58 0 31 496 64 85 734
Quant. 663 565 169 2558 793 308 5056
% 13.11% 11.17% 3.34% 50.59% 15.68% 6.09% 100.00%
Co-relation 0.4935 0.4572 0.3940 0.8185 0.5691 0.5611 0.8724
Source: prepared by the author from WoS data.
Citations in all the regions and institutions nationwide have increased, with the southeastern region in the limelight, not merely in quantity but in impact, with quantities greater than the sum of citations from all the other regions and institutions throughout the country. A strong relationships exists between the southeastern region and all the other regions throughout the entire period, featuring 0.8185 and 0.8724 respectively.
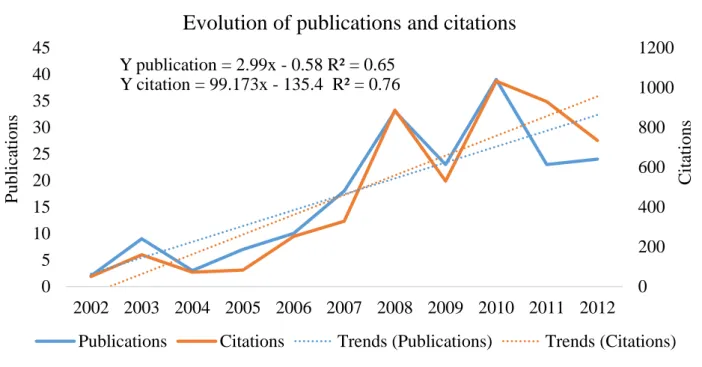
Table 2 shows the evolution of publications and citations. Since there is a
great difference in the rate scale, the left axis refers to publications and the right one to citations.
310
FIGURE 1 – Evolution of publications and citations between 2002 and 2012.
Source: prepared by the author from WoS data.
FIGURE 2 – Brazil regions and graphic representations on the quantity of scientific publications and citations between 2002 and 2012.
Source: prepared by the author from WoS data.
Y publication = 2.99x - 0.58 R² = 0.65 Y citation = 99.173x - 135.4 R² = 0.76
0 200 400 600 800 1000 1200
0 5 10 15 20 25 30 35 40 45
2002 2003 2004 2005 2006 2007 2008 2009 2010 2011 2012
C
it
ati
ons
P
ubli
ca
ti
ons
Evolution of publications and citations
311 In Figure 2 shows Brazilian regions represented by columns whose altitudes demonstrate proportionally the number of publications and citations. The legend reveals two scales, one representing proportionally the size of the column (1600) and the other of the map (1:26.096.542).
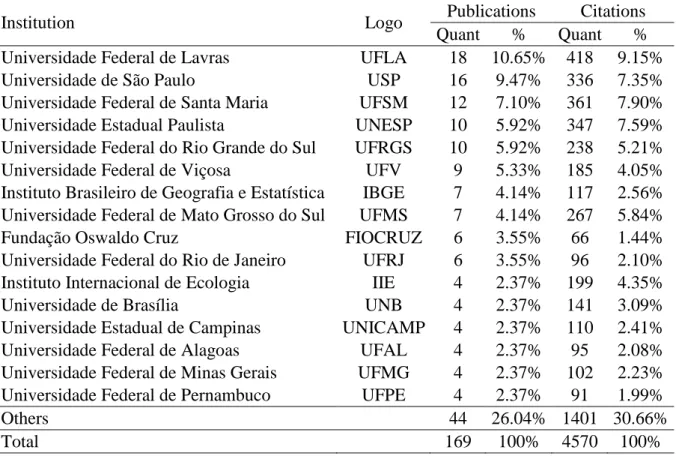
TABLE 3 shows a decreasing list of publications and institutions with four or more published articles on River Basins.
TABLE 3 – Number of articles published in scientific journals and citations of Brazilian Institutions of National and State Research between 2002 and 2012.
Institution Logo Publications Citations
Quant % Quant %
Universidade Federal de Lavras UFLA 18 10.65% 418 9.15%
Universidade de São Paulo USP 16 9.47% 336 7.35%
Universidade Federal de Santa Maria UFSM 12 7.10% 361 7.90%
Universidade Estadual Paulista UNESP 10 5.92% 347 7.59%
Universidade Federal do Rio Grande do Sul UFRGS 10 5.92% 238 5.21%
Universidade Federal de Viçosa UFV 9 5.33% 185 4.05%
Instituto Brasileiro de Geografia e Estatística IBGE 7 4.14% 117 2.56% Universidade Federal de Mato Grosso do Sul UFMS 7 4.14% 267 5.84%
Fundação Oswaldo Cruz FIOCRUZ 6 3.55% 66 1.44%
Universidade Federal do Rio de Janeiro UFRJ 6 3.55% 96 2.10%
Instituto Internacional de Ecologia IIE 4 2.37% 199 4.35%
Universidade de Brasília UNB 4 2.37% 141 3.09%
Universidade Estadual de Campinas UNICAMP 4 2.37% 110 2.41%
Universidade Federal de Alagoas UFAL 4 2.37% 95 2.08%
Universidade Federal de Minas Gerais UFMG 4 2.37% 102 2.23%
Universidade Federal de Pernambuco UFPE 4 2.37% 91 1.99%
Others 44 26.04% 1401 30.66%
Total 169 100% 4570 100%
Source: prepared by the author from WoS data.
All Institutions in Table 2 are government-run, with the exception of the
“Instituto Internacional de Ecologia”. One
should note that the Higher Institutions in the table are accountable for 73.96% of all publications and for 69.34% of citations.
The co-relation between quantity of publications and citations among the Institutions with most publications comprised in Table 3 is 0.8615. Since the
number is positive, growth is evident; since it is close to 1, there is a strong co-relationship and linear dependence between the quantities.
312
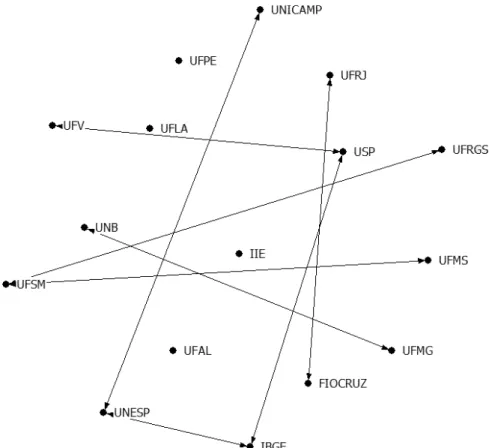
FIGURE 3 – Network of scientific collaboration between Institutions with four or more publications between 2002 and 2012.
Source: prepared by the author from WoS data.
Figure 3 reveals only a slight collaboration between researchers of the above-mentioned Institutions. There were Institutions with research, such as IIE,
UFAL, UFPE and UFLA, without any collaboration with others.
The collaboration network (Figure 3) forms four networks of collaborating Institutions (Table 4).
TABLE 4 – Networks of collaboration between Institutions with the greatest number of publications between 2002 and 2012.
Netwo
rk Institutions
Publications Citations
Quant % Quant %
1 UFV, USP, IBGE, UNESP, UNICAMP 46 27.22% 1095 23.96%
2 UFRGS, UFSM, UFMS 29 17.16% 866 18.95%
4 FIOCRUS, UFRJ 12 7.10% 162 3.54%
3 UFMG, UNB 8 4.73% 243 5.32%
Total 95 56.21% 2366 51.77%
Source: prepared by the author from WoS data.
Data in TABLE 4 reveals that:
Network 1 comprises the collaboration between IBGE and Institutions in the southeastern region, three of which are from the state of São Paulo;
Network 2 comprises Institutions of the Southern region, with the collaboration of UFMS;
Network 3 comprises Institutions exclusively from the state of Rio de Janeiro;
Network 4 comprises the relationship between UnB and an institute from the state of Minas Gerais.
313 not represent totality but the total of the
columns.
Percentages of Table 4 show that networks 1 and 3 had a lower performance percentage in citations when compared to that for publications, contrastingly to networks 2 and 4.
The geographical closeness between institutions affects the collaboration
network and shows the importance of an intervention nationwide so that networks would shun the local milieu and reach towards a wider one. In this case, the National Council for Scientific and Technological Development (CNPq) should increase investments and facilitate research between institutions from different regions.
CONCLUSIONS
A biometric analysis on the evolution of publications in the different Brazilian regions was undertaken to build a survey on Brazilian scientific production on River Basins in published articles between 2002 and 2012. The institutions, quantity of publications and citations and scientific collaboration among the several Institutions were mapped.
In fact, 94 Brazilian Institutions related to the theme River Basins were identified. There was a high scientific production in regions with great concentrations of internationally acknowledged Institutions, namely, the southeastern region.
Scientific publications are predominantly the product of
government-run Institutions, with special reference to UFLA, USP, UFSM, UNESP and UFRGS.
There is only slight or no integration between researchers of the different Institutions. This fact is a negative characteristic to Brazilian researchers in the area since sharing between research groups is highly relevant for new solutions, upgrading and evolution of knowledge
Doubtlessly Brazilian research on the theme, albeit increasing, will only benefit from a greater integration between institutions of different regions. However, investments by the government will surely facilitate research that involves institutions of different regions.
REFERENCES
ADAMS J.; KING C. Global Research Report: Brazil. Research and collaboration in the new geography of science. Leeds: Thomson Reuters; 2009. Available at: http://researchanalytics.thomsonreuters.co m/m/pdfs/GRR-Brazil-Jun09.pdf
BEAVER, D. Reflections on scientific collaboration (and its study): past, present, and future. Scientometrics, Amsterdam, v. 52, n. 3, p. 365-377, 2001
BORSATO, F. H.; MARTONI, A. M. Estudo da fisiologia das bacias hidrográficas urbanas no município de Maringá, Estado do Paraná. Acta Scientiarum, Human and Social Sciences.
Maringá, v.26, n.2, p. 273-285.
BOTELHO, R. G. M., SILVA, A. S. Bacias Hidrográficas e Qualidade
Ambiental. In: VITTE, A. C., GUERRA, A. J. T. (Orgs.). Reflexões sobre a Geografia Física no Brasil. Rio de Janeiro: Bertrand Brasil, 2004.
BRASIL. Governo Federal. LEI Nº 9.433, de 8 de janeiro DE 1997. Institui a Política Nacional de Recursos Hídricos, cria o Sistema Nacional de Gerenciamento de Recursos Hídricos. DOU, Brasília, 08 de janeiro de 1997.
BRASIL, 2014. Projeto Brasil das Águas.
Available at <
http://brasildasaguas.com.br/> On 10/01/2014.
314 CONBOY, K. Agility from First
Principles: reconstructing the concept of agility in information system development.
Information Systems Research, v. 20, n. 3,
p. 329-354, 2009.
COOK, D.J.; MULROW, C.D.; HAYNES, R.B. Systematic reviews: synthesis of best evidence for clinical decisions. Annals of
Internal Medicine, v.126, n.5, p.376-380,
1997.
COOPER, H. Synthesizing Research. Thousand Oaks: Sage, 1998.
CRUZ, J. C.; TUCCI, C. E. M. Estimativa da disponibilidade hídrica através da curva de Permanência. Revista Brasileira de
Recursos Hídricos, Porto Alegre, v.13, n.1,
p.111-124, janeiro/março 2008.
CUNHA, S. B. da A.; GUERRA, J. T. Geomorfologia do Brasil, 3ed., Bertrand Brasil, Rio de Janeiro, 2003.
FREITAS, A. J. Gestão de Recursos Hídricos. In: SILVA, D. D.; PRUSKI, F. F. Gestão de Recursos hídricos: Aspectos Legais, Econômicos, Sociais e Administrativos. Brasília: Secretaria de
Recursos Hídricos; Viçosa-MG:
Universidade Federal de Viçosa; Porto Alegre: Associação Brasileira de Recursos Hídricos, 2000. 659 p.
GREGOLIN, J. A. R. et al. Análise da produção cientifica a partir de indicadores bibliométricos. In: FUNDAÇÃO DE AMPARO À PESQUISA DO ESTADO DE SÃO PAULO. Indicadores de ciência, tecnologia e inovação em São Paulo 2004. São Paulo: FAPESP, 2005.
MAIA NETO, R. F. Água para o desenvolvimento sustentável. A Água em
Revista, Belo Horizonte, n. 9, p.21-32,
1997.
MENDES, P. C. Caracterização da Distribuição pluviométrica do Rio Tijuco. In: Simpósio Brasileiro de Geografia Física Aplicada, v.13. 2009. Viçosa. Anais.
MUSETTI, R. A. Bacias hidrográficas no Brasil: aspectos jurídicos-ambientais.
Revista CEJ, América do Norte, 429 12
2000.
PORTER, A. L. Tech forecasting. Technological Forecasting and Social Change. v. 62, 1999.
PORTO, M. F. A.; PORTO, R. L. L. Gestão de bacias hidrográficas. Estud. Av., São Paulo, v. 22, n. 63, 2008.
PUTTI, F. F.; CATANEO, P. F.; CREMASCO GABRIEL.C.; GABRIEL FILHO, L. R. A. Políticas públicas dos recursos hídricos no desenvolvimento da agricultura irrigada. Fórum Ambiental da
Alta Paulista, v. 9, n. 7, p. 46-57, 2013.
QUEIROZ, A. T.; BARBOSA, G. R.; ZANZARINI, R. M.; ALBINO, K. A.;
REBOUÇAS, A. C.; BRAGA, B.;
TUNDISI, J. G. Águas doces no Brasil: capital ecológico, uso e conservação. São Paulo: Escrituras, 1999, 720 p.
ROMANETTO, L. M. Listas de
padronização e agregação de dados para a elaboração de indicadores bibliométricos de produção e colaboração científica. 70 f. São Carlos: Departamento de Ciência da Informação, Universidade Federal de São Carlos, 2012.
ROUSSEAU, R. Library science: forgotten founder of bibliometrics. Nature, v. 510, n. 218, Jun. 2014.
SÁNCHEZ-ROMANA, R. M.;
FOLEGATTI, M. V.;
ORELLANA-GONZÁLEZ, A. M.G. Situação dos Recursos Hídricos nas bacias hidrográficas dos rios Piracicaba, Capivari e Jundiaí utilizando modelo desenvolvido em dinâmica de sistemas. Engenharia Agrícola, Jaboticabal, v.29, n.4, p.578-590,
de 2009.
SONNENWALD, D. H. Scientific
Collaboration. Annual Review of Information Science and Technology, v.
42, n. 1, 2008.
TUNDISI, J. G. Recursos hídricos no futuro: problemas e soluções. Estud. Av., São Paulo, v. 22, n. 63, 2008.